

The DOI matches its Crossref record; 97 of the 97 references it cites were found in a registry or an index.
DeepDrug3D: Classification of ligand-binding pockets in proteins with a convolutional neural network
Open accessAbstract
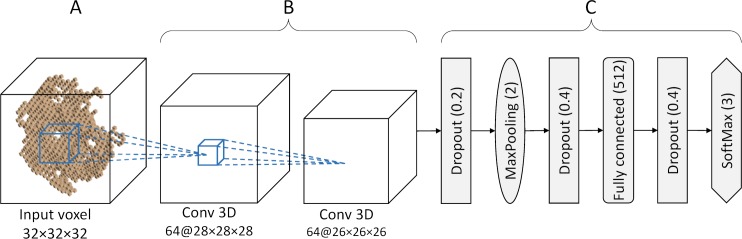
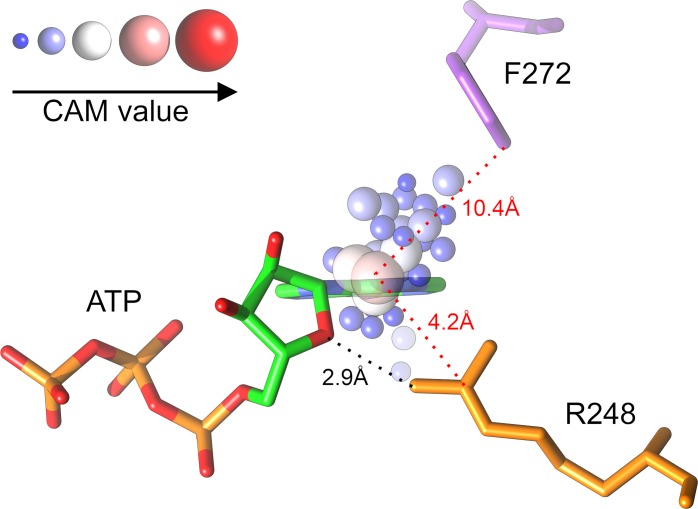
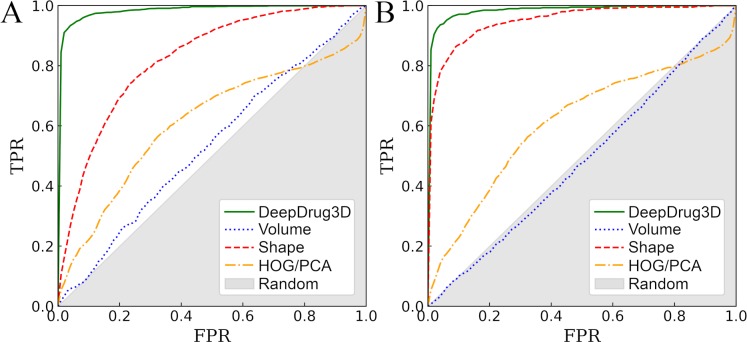
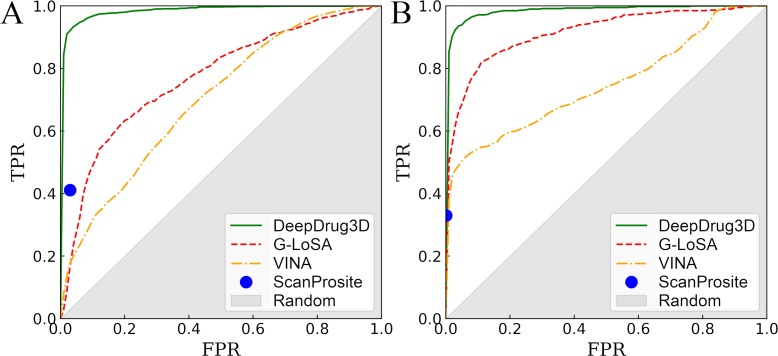
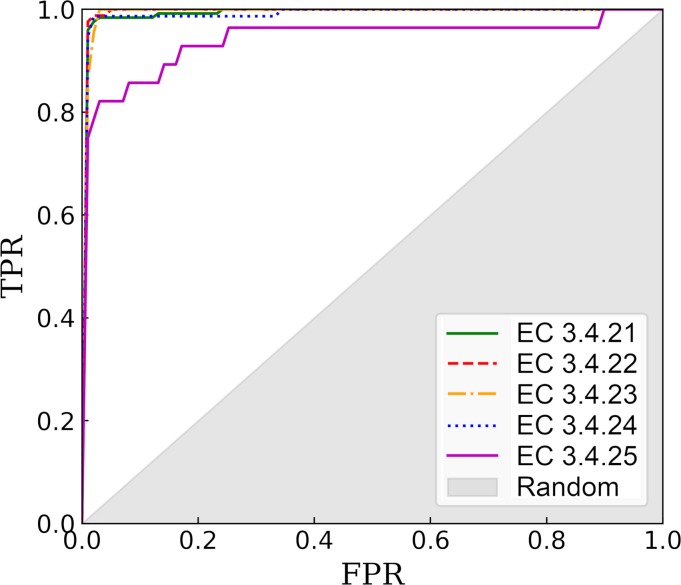
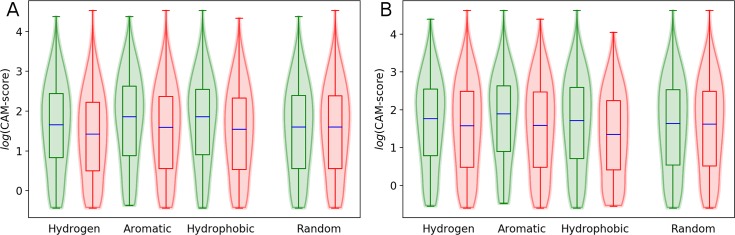
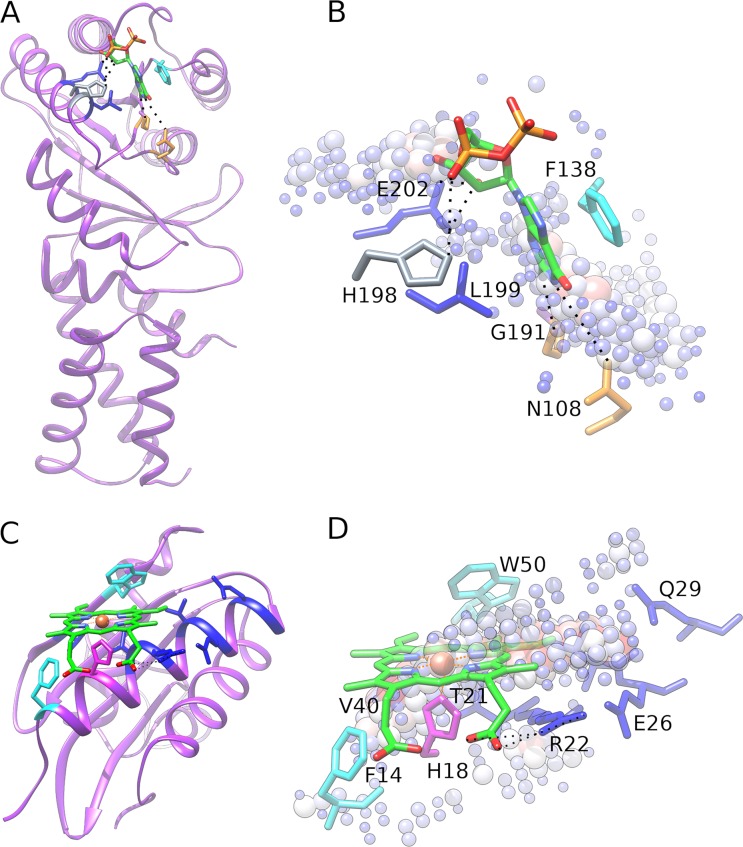
Comprehensive characterization of ligand-binding sites is invaluable to infer molecular functions of hypothetical proteins, trace evolutionary relationships between proteins, engineer enzymes to achieve a desired substrate specificity, and develop drugs with improved selectivity profiles. These research efforts pose significant challenges owing to the fact that similar pockets are commonly observed across different folds, leading to the high degree of promiscuity of ligand-protein interactions at the system-level. On that account, novel algorithms to accurately classify binding sites are needed. Deep learning is attracting a significant attention due to its successful applications in a wide range of disciplines. In this communication, we present DeepDrug3D, a new approach to characterize and classify binding pockets in proteins with deep learning. It employs a state-of-the-art convolutional neural network in which biomolecular structures are represented as voxels assigned interaction energy-based attributes. The current implementation of DeepDrug3D, trained to detect and classify nucleotide- and heme-binding sites, not only achieves a high accuracy of 95%, but also has the ability to generalize to unseen data as demonstrated for steroid-binding proteins and peptidase enzymes. Interestingly, the analysis of strongly discriminative regions of binding pockets reveals that this high classification accuracy arises from learning the patterns of specific molecular interactions, such as hydrogen bonds, aromatic and hydrophobic contacts. DeepDrug3D is available as an open-source program at https://github.com/pulimeng/DeepDrug3D with the accompanying TOUGH-C1 benchmarking dataset accessible from https://osf.io/enz69/.
Overview
The claims and statistics of this paper haven’t been checked yet.
Run the check — free, no account needed. It reads the open-access text and checks the sources it cites.
Integrity signals
Registry
Cites
Statistics
Figures

Verification
Claims the paper makes
The claims and statistics of this paper haven’t been checked yet.
Run the check — free, no account needed. It reads the open-access text and checks the sources it cites.
Claims other papers make about this one
Each is checked against this paper’s own text: does it say what the citing paper says it does?
The source backs part of the claim, not all of it — or backs it for a different population, condition or comparison.
In the citing paper
“AI/ML models have been applied to the identification of these potential pockets, and especially to the up-ranking of the most ligandable ones.138”
From Advancing Targeted Protein Degradation via Multiomics Profiling and Artificial Intelligence (2023) · cites this paper as [138]
Experimental — accuracy not yet measured
Self-check
Percentages, sums and reported differences re-computed from the paper’s own numbers.
The self-check needs the paper’s full text.
Citations
Cites
Deep Residual Learning for Image Recognition
He, K., Zhang, X., Ren, S., & Sun, J. (2016) · 2016 IEEE Conference on Computer Vision and Pattern Recognition (CVPR) · doi:10.1109/cvpr.2016.90 · Cited by 235,474
ImageNet classification with deep convolutional neural networks
Krizhevsky, A., Sutskever, I., & Hinton, G. E. (2017) · Communications of the ACM · doi:10.1145/3065386 · Cited by 112,155
Adam: A Method for Stochastic Optimization
Kingma, D. P., & Ba, J. (2014) · arXiv · doi:10.48550/arxiv.1412.6980 · Cited by 98,946
Gapped BLAST and PSI-BLAST: a new generation of protein database search programs
Altschul, S. (1997) · Nucleic Acids Research · doi:10.1093/nar/25.17.3389 · Cited by 73,302
Berman, H. M. (2000) · Nucleic Acids Research · doi:10.1093/nar/28.1.235 · Cited by 40,196
Trott, O., & Olson, A. J. (2010) · Journal of Computational Chemistry · doi:10.1002/jcc.21334 · Cited by 38,412
Rethinking the Inception Architecture for Computer Vision
Szegedy, C., Vanhoucke, V., Ioffe, S., Shlens, J., & Wojna, Z. (2016) · 2016 IEEE Conference on Computer Vision and Pattern Recognition (CVPR) · doi:10.1109/cvpr.2016.308 · Cited by 32,138
AutoDock4 and AutoDockTools4: Automated docking with selective receptor flexibility
Morris, G. M., Huey, R., Lindstrom, W., Sanner, M. F., Belew, R. K., Goodsell, D. S., & Olson, A. J. (2009) · Journal of Computational Chemistry · doi:10.1002/jcc.21256 · Cited by 26,294
Delving Deep into Rectifiers: Surpassing Human-Level Performance on ImageNet Classification
He, K., Zhang, X., Ren, S., & Sun, J. (2015) · 2015 IEEE International Conference on Computer Vision (ICCV) · doi:10.1109/iccv.2015.123 · Cited by 19,741
Learning Deep Features for Discriminative Localization
Zhou, B., Khosla, A., Lapedriza, A., Oliva, A., & Torralba, A. (2016) · 2016 IEEE Conference on Computer Vision and Pattern Recognition (CVPR) · doi:10.1109/cvpr.2016.319 · Cited by 11,428
Cited by
Sorted by citations
Exploring the computational methods for protein-ligand binding site prediction
Zhao, J., Cao, Y., & Zhang, L. (2020) · Computational and Structural Biotechnology Journal · doi:10.1016/j.csbj.2020.02.008 · Cited by 245
Gangwal, A., Ansari, A., Ahmad, I., Azad, A. K., Kumarasamy, V., Subramaniyan, V., & Wong, L. S. (2024) · Frontiers in Pharmacology · doi:10.3389/fphar.2024.1331062 · Cited by 222
A geometric deep learning approach to predict binding conformations of bioactive molecules
Méndez‐Lucio, O., Ahmad, M., del Rio‐Chanona, E. A., & Wegner, J. K. (2021) · Nature Machine Intelligence · doi:10.1038/s42256-021-00409-9 · Cited by 173
A review of deep learning applications in human genomics using next-generation sequencing data
Alharbi, W., & Rashid, M. (2022) · Human Genomics · doi:10.1186/s40246-022-00396-x · Cited by 179
Meli, R., Morris, G. M., & Biggin, P. C. (2022) · Frontiers in Bioinformatics · doi:10.3389/fbinf.2022.885983 · Cited by 176
Metadata
- Authors
- Pu, L., Govindaraj, R. G., Lemoine, J. M., Wu, H.-C., & Brylinski, M.
- Affiliations
- Louisiana State University (US)
- Venue
- PLOS Computational Biology
- Publisher
- Public Library of Science (PLoS)
- Published
- 2019-02-04
- Volume
- 15
- Issue
- 2
- Pages
- e1006718
- ISSN
- 1553-734X (ISSN-L)
- 1553-7358
- PMC
- PMC6375647
- OpenAlex
- W2914877211
- Cited by
- 133
- References
- 96
- Citations by year
- 2026: 7 · 2025: 11 · 2024: 23 · 2023: 14 · 2022: 28 · 2021: 21 · 2020: 21 · 2019: 8
- FWCI
- 13.24
- Type
- journal article
- Language
- en
- Update notices
- new_version (2019-02-14)
- Open access
- gold
- doi.org
- Licence
- Locations
- PLoS Computational Biology (publishedVersion, cc-by)
- Europe PMC (PubMed Central) (publishedVersion, cc-by)
- PubMed Central (publishedVersion, cc-by)
- PubMed (publishedVersion)
- Civil War Book Review (submittedVersion)
- DOAJ (DOAJ: Directory of Open Access Journals) (submittedVersion, cc-by-sa)
- Funders
- National Institute of General Medical Sciences (R35GM119524)
- Topics
- Life Sciences › Pharmacology, Toxicology and Pharmaceutics › Drug Discovery › Computational Drug Discovery Methods
- Life Sciences › Biochemistry, Genetics and Molecular Biology › Molecular Biology › Protein Structure and Dynamics
- Life Sciences › Biochemistry, Genetics and Molecular Biology › Molecular Biology › Machine Learning in Bioinformatics
- Keywords
- convolutional neural networks, nucleotide binding site, heme binding site, steroid binding proteins, protein structure
- MeSH terms
- Deep Learning, Algorithms, Binding Sites, Ligands, Models, Molecular, Protein Binding, Proteins, Neural Networks, Computer, Computational Biology, Databases, Protein
About these checks
Registry, retraction, Cites and statistics results are computed, not judged, with one exception: a printed reference that no index lists is read once by a model before it counts as a citation error. Claims are extracted by a model and kept only when their quote appears verbatim in the text; each cited source is then checked, with a model’s help, for whether it says what the claim relies on. Those verdicts can be wrong — read the claim’s quote and the cited source before relying on one.
Statistics and arithmetic are recomputed, not judged.
Confidence bands are shown only for fields calibrated on our annotated test set. None is calibrated yet, so no band is shown.
What counts as a claim ›How we measure confidence ›How we check this ›
Are you an author, or do you see a problem with this page? Request a review
