

The DOI matches its Crossref record; 72 of the 72 references it cites were found in a registry or an index.
Unveiling functions of the visual cortex using task-specific deep neural networks
Open accessPublished version of a preprint
Abstract
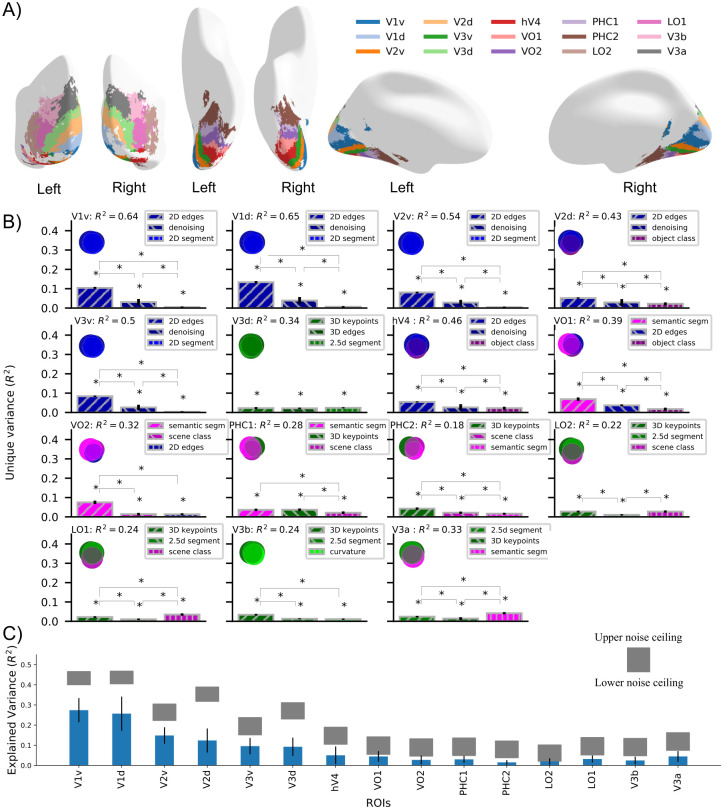
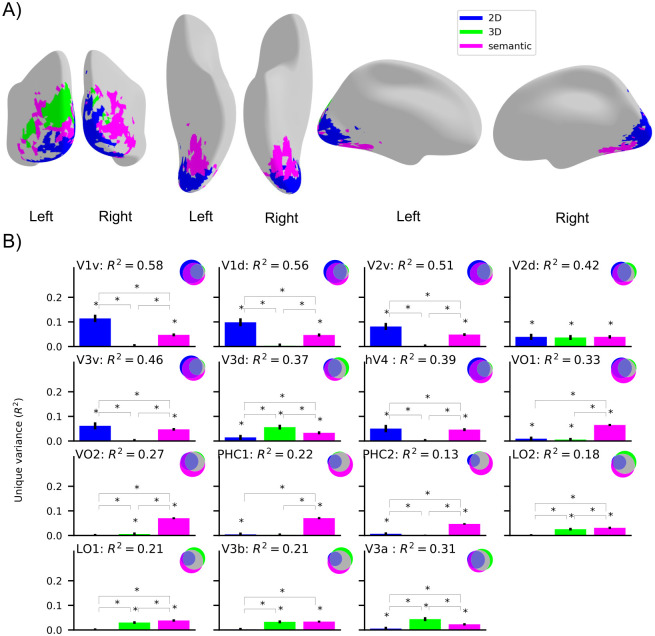
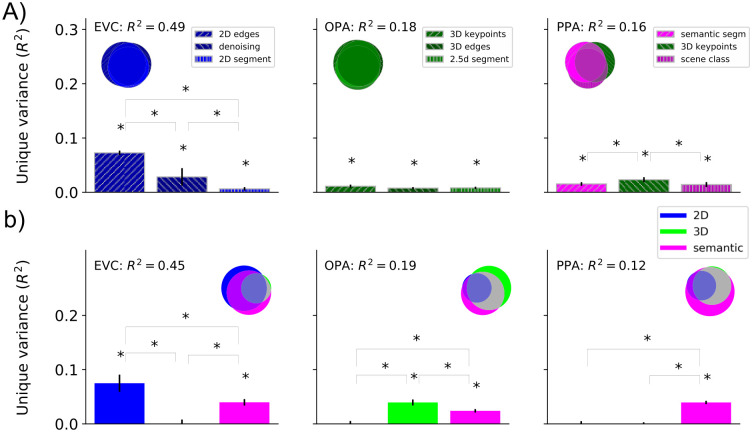
The human visual cortex enables visual perception through a cascade of hierarchical computations in cortical regions with distinct functionalities. Here, we introduce an AI-driven approach to discover the functional mapping of the visual cortex. We related human brain responses to scene images measured with functional MRI (fMRI) systematically to a diverse set of deep neural networks (DNNs) optimized to perform different scene perception tasks. We found a structured mapping between DNN tasks and brain regions along the ventral and dorsal visual streams. Low-level visual tasks mapped onto early brain regions, 3-dimensional scene perception tasks mapped onto the dorsal stream, and semantic tasks mapped onto the ventral stream. This mapping was of high fidelity, with more than 60% of the explainable variance in nine key regions being explained. Together, our results provide a novel functional mapping of the human visual cortex and demonstrate the power of the computational approach.
Overview
The claims and statistics of this paper haven’t been checked yet.
Free: it reads the open-access text and checks the first 5 claims that cite a source we can check. Create a free account to check every claim.
Integrity signals
Registry
Cites
Statistics
Figures

Verification
Claims the paper makes
The claims and statistics of this paper haven’t been checked yet.
Free: it reads the open-access text and checks the first 5 claims that cite a source we can check. Create a free account to check every claim.
Claims other papers make about this one
Each is checked against this paper’s own text: does it say what the citing paper says it does?
The cited source says what the claim attributes to it.
In the citing paper
“Using this approach, known as neuroconnectionism, numerous studies have identified shared representational structure across brains and ANN models, as well as factors influencing this alignment [5–11]”
From The Umwelt Representation Hypothesis: rethinking Universality (2026) · cites this paper as [8]
Self-check
Percentages, sums and reported differences re-computed from the paper’s own numbers.
The self-check needs the paper’s full text.
Citations
Cites
Deep Residual Learning for Image Recognition
He, K., Zhang, X., Ren, S., & Sun, J. (2016) · 2016 IEEE Conference on Computer Vision and Pattern Recognition (CVPR) · doi:10.1109/cvpr.2016.90 · Cited by 235,474
LeCun, Y., Bengio, Y., & Hinton, G. (2015) · Nature · doi:10.1038/nature14539 · Cited by 84,126
Microsoft COCO: Common Objects in Context
Lin, T.-Y., Maire, M., Belongie, S., Hays, J., Perona, P., Ramanan, D., Dollár, P., & Zitnick, C. L. (2014) · Lecture Notes in Computer Science · doi:10.1007/978-3-319-10602-1_48 · Cited by 45,460
Marr, D. (1982) · Cumulative Index of Computer Aided Architectural Design · Cited by 5,733
Representational similarity analysis-connecting the branches of systems neuroscience
Kriegeskorte, N. (2008) · Frontiers in Systems Neuroscience · doi:10.3389/neuro.06.004.2008 · Cited by 3,355
Information-based functional brain mapping
Kriegeskorte, N., Goebel, R., & Bandettini, P. (2006) · Proceedings of the National Academy of Sciences · doi:10.1073/pnas.0600244103 · Cited by 2,113 · cited 1×
“To generate a functional map across the whole visual cortex we performed a searchlight analysis [11,12].”
MethodPerformance-optimized hierarchical models predict neural responses in higher visual cortex
Yamins, D. L. K., Hong, H., Cadieu, C. F., Solomon, E. A., Seibert, D., & DiCarlo, J. J. (2014) · Proceedings of the National Academy of Sciences · doi:10.1073/pnas.1403112111 · Cited by 1,924
Using goal-driven deep learning models to understand sensory cortex
Yamins, D. L. K., & DiCarlo, J. J. (2016) · Nature Neuroscience · doi:10.1038/nn.4244 · Cited by 1,621
The lateral occipital complex and its role in object recognition
Grill-Spector, K., Kourtzi, Z., & Kanwisher, N. (2001) · Vision Research · doi:10.1016/s0042-6989(01)00073-6 · Cited by 1,406
Domain-Specific Knowledge Systems in the Brain: The Animate-Inanimate Distinction
Caramazza, A., & Shelton, J. R. (1998) · Journal of Cognitive Neuroscience · doi:10.1162/089892998563752 · Cited by 1,348
Cited by
The neuroconnectionist research programme
Doerig, A., Sommers, R. P., Seeliger, K., Richards, B., Ismael, J., Lindsay, G. W., Kording, K. P., Konkle, T., van Gerven, M. A. J., Kriegeskorte, N., et al. (2023) · Nature Reviews Neuroscience · doi:10.1038/s41583-023-00705-w · Cited by 233
Conwell, C., Prince, J. S., Kay, K. N., Alvarez, G. A., & Konkle, T. (2022) · doi:10.1101/2022.03.28.485868 · Cited by 160
“…has been significant interest in the Taskonomy models for controlled model comparisons (including by us; Conwell et al., 2021; Wang et al., 2019; Dwivedi et al., 2021; Cadena et al., 2022), a direct implication of these results is that these models should not be used in future research to make…”
BackgroundResultConwell, C., Prince, J. S., Kay, K. N., Alvarez, G. A., & Konkle, T. (2024) · Nature Communications · doi:10.1038/s41467-024-53147-y · Cited by 100
Understanding Human Object Vision: A Picture Is Worth a Thousand Representations
Bracci, S., & de Beeck, H. O. (2022) · Annual Review of Psychology · doi:10.1146/annurev-psych-032720-041031 · Cited by 120
High-performing neural network models of visual cortex benefit from high latent dimensionality
Elmoznino, E., & Bonner, M. (2024) · PLoS Computational Biology · doi:10.1371/journal.pcbi.1011792 · Cited by 72
Self-citation
Metadata
- Authors
- Dwivedi, K., Bonner, M. F., Cichy, R. M., & Roig, G.
- Affiliations
- Goethe University Frankfurt (DE)
- Johns Hopkins University (US)
- Freie Universität Berlin (DE)
- Corresponding author
- Dwivedi, Kshitij
- Roig, Gemma
- Venue
- PLOS Computational Biology
- Publisher
- Public Library of Science (PLoS)
- Published
- 2021-08-13
- Volume
- 17
- Issue
- 8
- Pages
- e1009267
- ISSN
- 1553-734X (ISSN-L)
- 1553-7358
- PMC
- PMC8407579
- OpenAlex
- W3192643265
- Cited by
- 52
- References
- 70
- Citations by year
- 2026: 6 · 2025: 8 · 2024: 16 · 2023: 11 · 2022: 8 · 2021: 2
- FWCI
- 4.86
- Type
- journal article
- Language
- en
- Update notices
- new_version (2021-08-31)
- Open access
- gold
- doi.org
- Licence
- Locations
- PLoS Computational Biology (publishedVersion, cc-by)
- bioRxiv (Cold Spring Harbor Laboratory) (acceptedVersion, cc-by-nc)
- PubMed Central (publishedVersion, cc-by)
- PubMed (publishedVersion)
- RePEc: Research Papers in Economics (submittedVersion)
- DOAJ (DOAJ: Directory of Open Access Journals) (submittedVersion, cc-by-sa)
- Publication Server of Goethe University Frankfurt am Main (Goethe University Frankfurt) (submittedVersion, cc-by)
- Publication Server of Goethe University Frankfurt am Main (Goethe University Frankfurt) (submittedVersion, cc-by-nc)
- Refubium (Universitätsbibliothek der Freien Universität Berlin) (submittedVersion, cc-by)
- OSF Preprints (OSF Preprints) (submittedVersion)
- Universitätsbibliothek der FU Berlin Hochschulschriftenstelle u. Dokumentenserver (cc-by)
- Funders
- Alfons und Gertrud Kassel-Stiftung
- dfg (CI241/1-1, CI241/3-1)
- European Research Council (ERC-2018-StG 803370)
- Topics
- Life Sciences › Neuroscience › Cognitive Neuroscience › Visual perception and processing mechanisms
- Physical Sciences › Computer Science › Computer Vision and Pattern Recognition › Visual Attention and Saliency Detection
- Life Sciences › Neuroscience › Cognitive Neuroscience › Face Recognition and Perception
- Keywords
- visual cortex, functional mapping, deep neural network, ventral stream, dorsal stream, scene perception, 3D scene perception, semantic processing, hierarchical visual processing, functional MRI, computational psychiatry
- MeSH terms
- Deep Learning, Adult, Brain Mapping, Female, Humans, Magnetic Resonance Imaging, Male, Models, Neurological, Photic Stimulation, Semantics, Task Performance and Analysis, Visual Cortex, Visual Perception, Neural Networks, Computer, Computational Biology, Imaging, Three-Dimensional, Functional Neuroimaging
About these checks
Registry, retraction, Cites and statistics results are computed, not judged, with one exception: a printed reference that no index lists is read once by a model before it counts as a citation error. Claims are extracted by a model and kept only when their quote appears verbatim in the text; each cited source is then checked, with a model’s help, for whether it says what the claim relies on. Those verdicts can be wrong — read the claim’s quote and the cited source before relying on one.
Statistics and arithmetic are recomputed, not judged.
Confidence bands are shown only for fields calibrated on our annotated test set. None is calibrated yet, so no band is shown.
What counts as a claim ›How we measure confidence ›How we check this ›
Are you an author, or do you see a problem with this page? Request a review
How to cite
Cite CoChat for the checks on this page, and the paper for its own findings.
- This page
- CoChat. (2026). Citation check: Unveiling functions of the visual cortex using task-specific deep neural networks. https://app.cochat.ai/papers/10.1371/journal.pcbi.1009267
- The paper
- Dwivedi, K., Bonner, M. F., Cichy, R. M., & Roig, G. (2021). Unveiling functions of the visual cortex using task-specific deep neural networks. PLOS Computational Biology. https://doi.org/10.1371/journal.pcbi.1009267
Data sources
Bibliographic data: Semantic Scholar, OpenAlex, Crossref.
Contains information from the Semantic Scholar Academic Graph Datasets, made available under the ODC Attribution License (ODC-BY 1.0).
Semantic Scholar’s data is described in: Kinney, R., et al. (2023). The Semantic Scholar Open Data Platform. arXiv:2301.10140.
