

Gate-based quantum computing for protein design
Open accessThe DOI matches its Crossref record; 38 of the 38 references it cites were found in a registry or an index.
Abstract
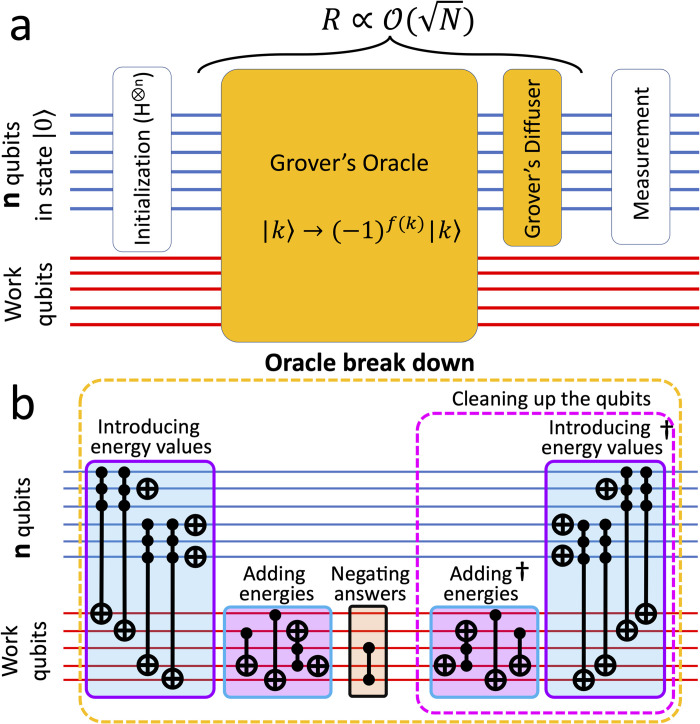
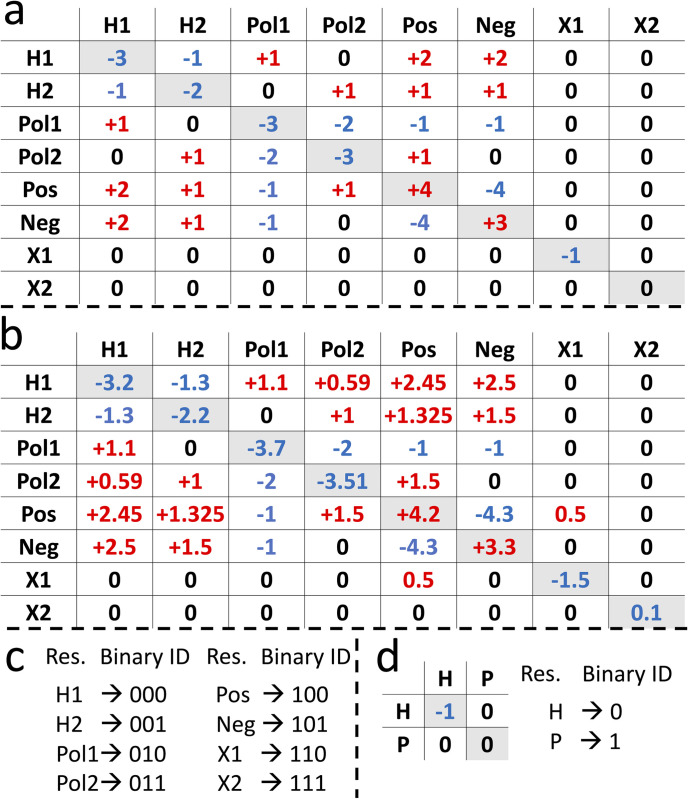
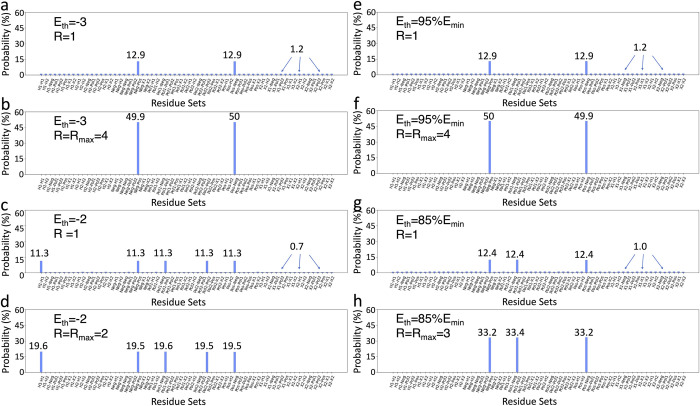
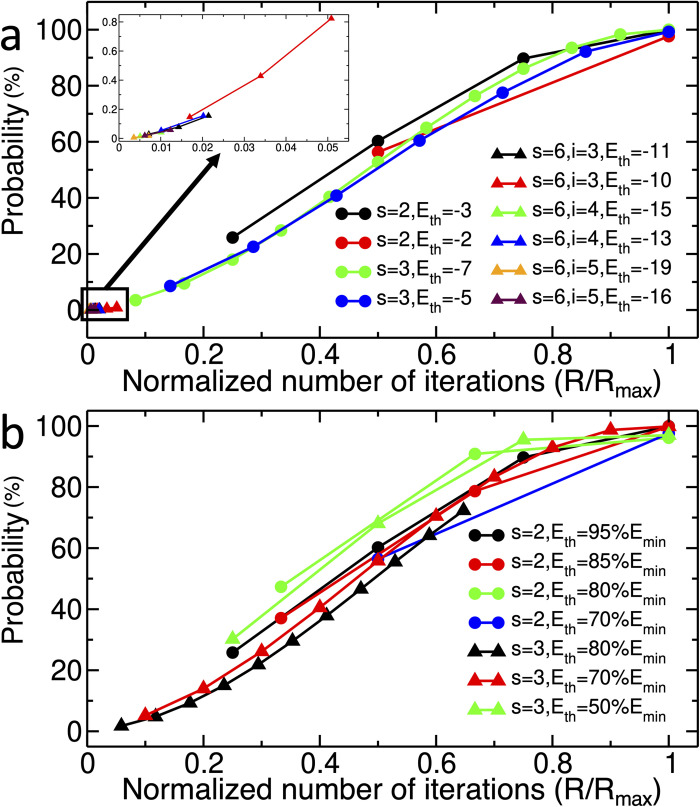
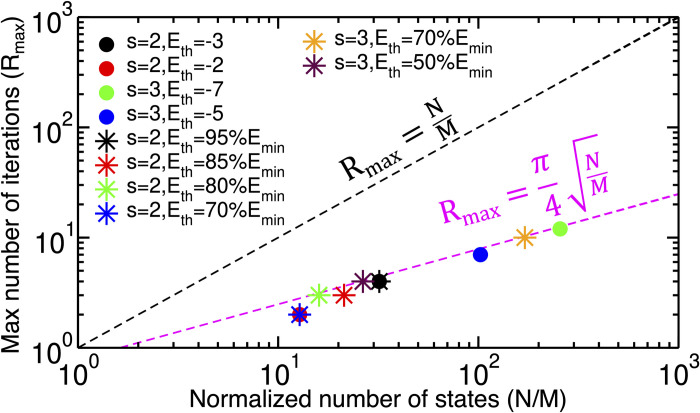
Protein design is a technique to engineer proteins by permuting amino acids in the sequence to obtain novel functionalities. However, exploring all possible combinations of amino acids is generally impossible due to the exponential growth of possibilities with the number of designable sites. The present work introduces circuits implementing a pure quantum approach, Grover’s algorithm, to solve protein design problems. Our algorithms can adjust to implement any custom pair-wise energy tables and protein structure models. Moreover, the algorithm’s oracle is designed to consist of only adder functions. Quantum computer simulators validate the practicality of our circuits, containing up to 234 qubits. However, a smaller circuit is implemented on real quantum devices. Our results show that usingO(N)iterations, the circuits find the correct results among all N possibilities, providing the expected quadratic speed up of Grover’s algorithm over classical methods (i.e.,O(N)).
Overview
The claims and statistics of this paper haven’t been checked yet.
Free: it reads the open-access text and checks the first 5 claims that cite a source we can check. Create a free account to check every claim.
Integrity signals
Registry
Cites
Statistics
Figures

Verification
Claims the paper makes
The claims and statistics of this paper haven’t been checked yet.
Free: it reads the open-access text and checks the first 5 claims that cite a source we can check. Create a free account to check every claim.
Claims other papers make about this one
Each is checked against this paper’s own text: does it say what the citing paper says it does?
The cited source says what the claim attributes to it.
In the citing paper
“Presently, considerable interest is increasing in quantum computing to solve biological problems [56-61].”
From Quantum Computing in the Next-Generation Computational Biology Landscape: From Protein Folding to Molecular Dynamics (2024) · cites this paper as [57]
Self-check
Percentages, sums and reported differences re-computed from the paper’s own numbers.
The self-check needs the paper’s full text.
Citations
Cites
A fast quantum mechanical algorithm for database search
Grover, L. K. (1996) · Proceedings of the twenty-eighth annual ACM symposium on Theory of computing - STOC '96 · doi:10.1145/237814.237866 · Cited by 8,830 · cited 1×
“Grover's algorithm[20], to solve protein design problems.”
Algorithms for quantum computation: discrete logarithms and factoring
Shor, P. W. (2002) · Proceedings 35th Annual Symposium on Foundations of Computer Science · doi:10.1109/sfcs.1994.365700 · Cited by 8,713 · cited 1×
“This step is similar to other quantum algorithms such as Shor’s algorithm[24], and the Deutsch-Jozsa algorithm[25].”
Markov Chain Monte Carlo in Practice
(1995) · Chapman & Hall/CRC eBooks · doi:10.1201/b14835 · Cited by 7,757
A variational eigenvalue solver on a photonic quantum processor
Peruzzo, A., McClean, J., Shadbolt, P., Yung, M.-H., Zhou, X.-Q., Love, P. J., Aspuru-Guzik, A., & O’Brien, J. L. (2014) · Nature Communications · doi:10.1038/ncomms5213 · Cited by 4,552 · cited 3×
“Similarly, a version of the VQE approach is employed by Robert et al .”
Introduction to the Theory of Computation
Sipser, M. (1996) · ACM SIGACT News · doi:10.1145/230514.571645 · Cited by 2,784
Rapid solution of problems by quantum computation
Deutsch, D., & Jozsa, R. (1992) · Proceedings of the Royal Society of London. Series A: Mathematical and Physical Sciences · doi:10.1098/rspa.1992.0167 · Cited by 2,700
Efficient Classical Simulation of Slightly Entangled Quantum Computations
Vidal, G. (2003) · Physical Review Letters · doi:10.1103/physrevlett.91.147902 · Cited by 2,368 · cited 1×
“12 Moreover, since the number of qubits required for the SP and MR model is large, we use the matrix product state (MPS) simulator[29], the only simulator that currently can”
A Quantum Approximate Optimization Algorithm
Farhi, E., Goldstone, J., & Gutmann, S. (2014) · arXiv · doi:10.48550/arxiv.1411.4028 · Cited by 1,789 · cited 4×
“[14] used the QAOA method to study the protein folding on a 9-residue protein using the HP energy model and a 3D lattice structure.”
InfluentialThe Rosetta All-Atom Energy Function for Macromolecular Modeling and Design
Alford, R. F., Leaver-Fay, A., Jeliazkov, J. R., O’Meara, M. J., DiMaio, F. P., Park, H., Shapovalov, M. V., Renfrew, P. D., Mulligan, V. K., Kappel, K., et al. (2017) · Journal of Chemical Theory and Computation · doi:10.1021/acs.jctc.7b00125 · Cited by 1,532
Qiskit: An Open-source Framework for Quantum Computing
Aleksandrowicz, G., Alexander, T., Barkoutsos, P. K., Bello, L., Ben-Haim, Y., Bucher, D., Cabrera-Hernández, F. J., Carballo-Franquis, J., Chen, A., Chen, C.-F., et al. (2019) · Zenodo (CERN European Organization for Nuclear Research) · doi:10.5281/zenodo.2562110 · Cited by 1,434
Research works printed but not linked: 2
- T Babej, 2018, others. Coarse-grained lattice protein folding on a quantum annealer., arXiv preprint arXiv:181100713.
- M Fingerhuth, 2018, others. A quantum alternating operator ansatz with hard and soft constraints for lattice protein folding, arXiv preprint arXiv:181013411.
Cited by
The state of quantum computing applications in health and medicine
Flöther, F. F. (2023) · Research Directions Quantum Technologies · doi:10.1017/qut.2023.4 · Cited by 191
Pal, S., Bhattacharya, M., Lee, S.-S., & Chakraborty, C. (2024) · Molecular Biotechnology · doi:10.1007/s12033-023-00765-4 · Cited by 103
Insights from incorporating quantum computing into drug design workflows
Lau, B., Emani, P. S., Chapman, J., Yao, L., Lam, T., Merrill, P., Warrell, J., Gerstein, M. B., & Lam, H. Y. K. (2023) · Bioinformatics · doi:10.1093/bioinformatics/btac789 · Cited by 54
Quantum computing algorithms: getting closer to critical problems in computational biology
Marchetti, L., Nifosì, R., Martelli, P. L., Da Pozzo, E., Cappello, V., Banterle, F., Trincavelli, M. L., Martini, C., & D’Elia, M. (2022) · Briefings in Bioinformatics · doi:10.1093/bib/bbac437 · Cited by 47
“Gate-based quantum algorithms are also being proposed to address biopolymer conformations, including a hybrid approach combining quantum Monte Carlo and machine learning for protein structure prediction [80], another quantum Monte Carlo approach to antibody loop modelling [54] and protein design exploiting Grover’s al…”
MethodQuantum Artificial Intelligence: A Brief Survey
Klusch, M., Lässig, J., Müssig, D., Macaluso, A., & Wilhelm, F. K. (2024) · Künstliche Intell. · doi:10.1007/s13218-024-00871-8 · Cited by 69
“…network constellation [178] and mission planning [147], energy network management [22, 124], job-shop scheduling in manufacturing [158], weather simulation and forecasting [68, 83, 132, 170] and simulation of materials and chemicals for drug discovery [91, 111, 142] and material design [10, 37].”
Metadata
- Authors
- Khatami, M. H., Mendes, U. C., Wiebe, N., & Kim, P. M.
- Affiliations
- University of Toronto (CA)
- CMC Microsystems (Canada) (CA)
- Pacific Northwest National Laboratory (US)
- Corresponding author
- Kim, Philip M.
- Venue
- PLOS Computational Biology
- Publisher
- Public Library of Science (PLoS)
- Published
- 2023-04-12
- Volume
- 19
- Issue
- 4
- Pages
- e1011033
- ISSN
- 1553-734X (ISSN-L)
- 1553-7358
- PMC
- PMC10124842
- OpenAlex
- W4365135628
- Cited by
- 26
- References
- 36
- Citations by year
- 2026: 2 · 2025: 7 · 2024: 11 · 2023: 3
- FWCI
- 2.17
- Type
- journal article
- Language
- en
- Update notices
- new_version (2023-04-24)
- Open access
- gold
- doi.org
- Licence
- Locations
- PLoS Computational Biology (publishedVersion, cc-by)
- PubMed Central (publishedVersion, cc-by)
- PubMed (publishedVersion)
- arXiv (Cornell University) (submittedVersion)
- OSTI OAI (U.S. Department of Energy Office of Scientific and Technical Information) (submittedVersion)
- RePEc: Research Papers in Economics (submittedVersion)
- DOAJ (DOAJ: Directory of Open Access Journals) (submittedVersion, cc-by-sa)
- arXiv (Cornell University)
- Funders
- Canadian Institutes of Health Research (PJT-159750)
- Topics
- Physical Sciences › Computer Science › Artificial Intelligence › Quantum Computing Algorithms and Architecture
- Physical Sciences › Mathematics › Theoretical Computer Science › DNA and Biological Computing
- Life Sciences › Biochemistry, Genetics and Molecular Biology › Molecular Biology › Protein Structure and Dynamics
- Keywords
- protein design, Grover's algorithm, quantum computing, quantum circuits, combinatorial search, quadratic speedup
- MeSH terms
- Algorithms, Amino Acids, Computing Methodologies, Engineering, Quantum Theory
About these checks
Registry, retraction, Cites and statistics results are computed, not judged, with one exception: a printed reference that no index lists is read once by a model before it counts as a citation error. Claims are extracted by a model and kept only when their quote appears verbatim in the text; each cited source is then checked, with a model’s help, for whether it says what the claim relies on. Those verdicts can be wrong — read the claim’s quote and the cited source before relying on one.
Statistics and arithmetic are recomputed, not judged.
Confidence bands are shown only for fields calibrated on our annotated test set. None is calibrated yet, so no band is shown.
What counts as a claim ›How we measure confidence ›How we check this ›
Are you an author, or do you see a problem with this page? Request a review
How to cite
Cite CoChat for the checks on this page, and the paper for its own findings.
- This page
- CoChat. (2026). Citation check: Gate-based quantum computing for protein design. https://app.cochat.ai/papers/10.1371/journal.pcbi.1011033
- The paper
- Khatami, M. H., Mendes, U. C., Wiebe, N., & Kim, P. M. (2023). Gate-based quantum computing for protein design. PLOS Computational Biology. https://doi.org/10.1371/journal.pcbi.1011033
Data sources
Bibliographic data: Semantic Scholar, OpenAlex, Crossref.
Contains information from the Semantic Scholar Academic Graph Datasets, made available under the ODC Attribution License (ODC-BY 1.0).
Semantic Scholar’s data is described in: Kinney, R., et al. (2023). The Semantic Scholar Open Data Platform. arXiv:2301.10140.
