

The DOI matches its Crossref record; 86 of the 86 references it cites were found in a registry or an index.
Double Strand Breaks Can Initiate Gene Silencing and SIRT1-Dependent Onset of DNA Methylation in an Exogenous Promoter CpG Island
Open accessAbstract
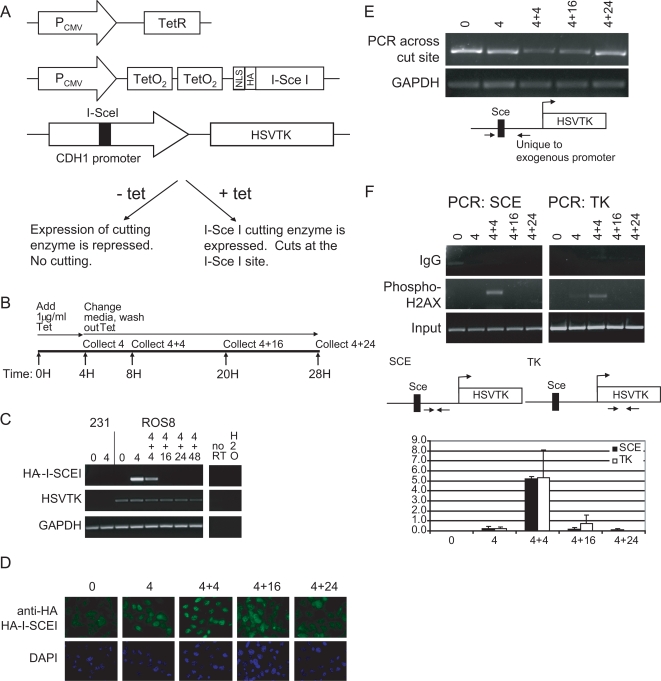
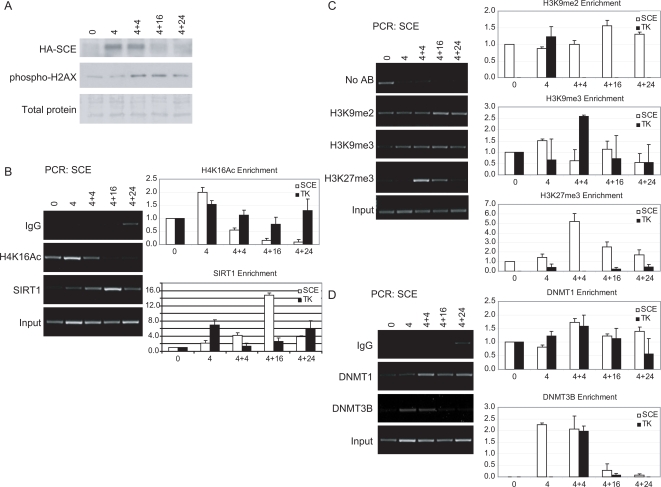
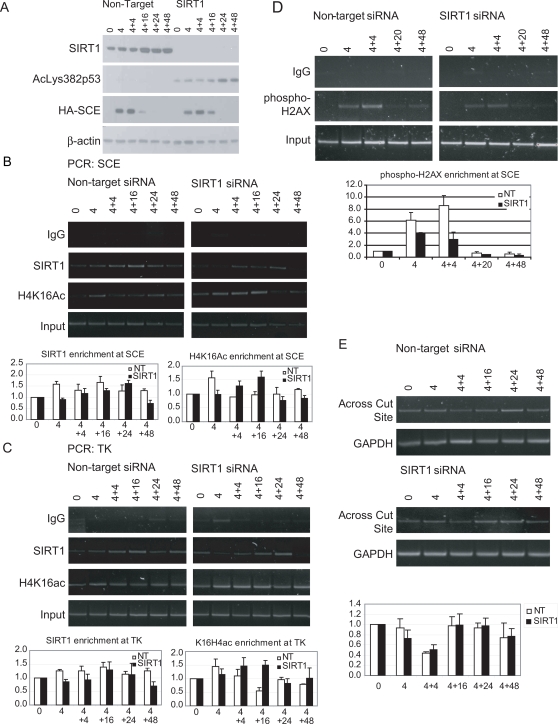
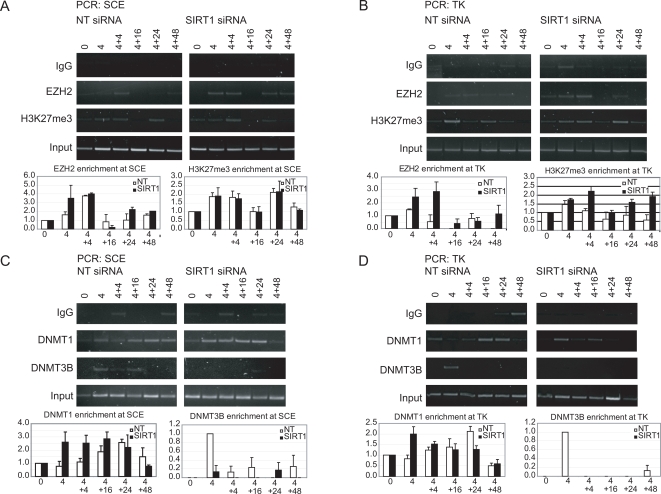
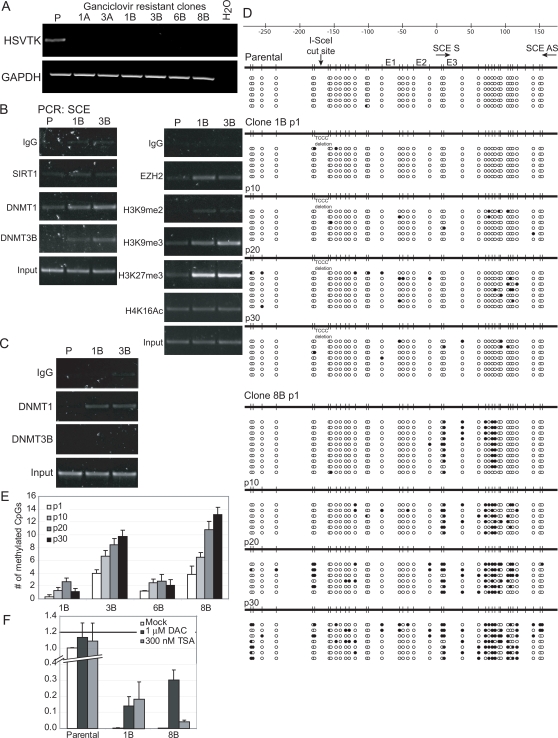
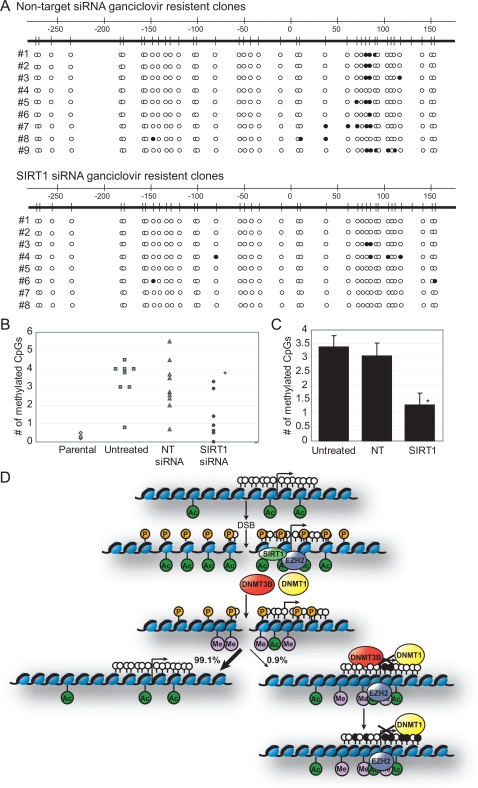
Chronic exposure to inducers of DNA base oxidation and single and double strand breaks contribute to tumorigenesis. In addition to the genetic changes caused by this DNA damage, such tumors often contain epigenetically silenced genes with aberrant promoter region CpG island DNA hypermethylation. We herein explore the relationships between such DNA damage and epigenetic gene silencing using an experimental model in which we induce a defined double strand break in an exogenous promoter construct of the E-cadherin CpG island, which is frequently aberrantly DNA hypermethylated in epithelial cancers. Following the onset of repair of the break, we observe recruitment to the site of damage of key proteins involved in establishing and maintaining transcriptional repression, namely SIRT1, EZH2, DNMT1, and DNMT3B, and the appearance of the silencing histone modifications, hypoacetyl H4K16, H3K9me2 and me3, and H3K27me3. Although in most cells selected after the break, DNA repair occurs faithfully with preservation of activity of the promoter, a small percentage of the plated cells demonstrate induction of heritable silencing. The chromatin around the break site in such a silent clone is enriched for most of the above silent chromatin proteins and histone marks, and the region harbors the appearance of increasing DNA methylation in the CpG island of the promoter. During the acute break, SIRT1 appears to be required for the transient recruitment of DNMT3B and subsequent methylation of the promoter in the silent clones. Taken together, our data suggest that normal repair of a DNA break can occasionally cause heritable silencing of a CpG island-containing promoter by recruitment of proteins involved in silencing. Furthermore, with contribution of the stress-related protein SIRT1, the break can lead to the onset of aberrant CpG island DNA methylation, which is frequently associated with tight gene silencing in cancer.
Overview
The claims and statistics of this paper haven’t been checked yet.
Run the check — free, no account needed. It reads the open-access text and checks the sources it cites.
Integrity signals
Registry
Cites
Statistics
Figures
Verification
Claims the paper makes
The claims and statistics of this paper haven’t been checked yet.
Run the check — free, no account needed. It reads the open-access text and checks the sources it cites.
Claims other papers make about this one
Each is checked against this paper’s own text: does it say what the citing paper says it does?
In the citing paper
“Recent studies have shown that DNA damage can induce changes in gene expression and histone modification patterns that may be mediated, in part, by the conserved lifespan regulatory gene SIRT1 (see below), suggesting a possible mechanistic link between DNA damage, epigenomic state and ageing (45,46).”
From Neural mechanisms of ageing and cognitive decline (2010) · cites this paper as [46]
Self-check
Percentages, sums and reported differences re-computed from the paper’s own numbers.
The self-check needs the paper’s full text.
Citations
Cites
1 retracted
RETRACTED: DNA Damage, Homology-Directed Repair, and DNA Methylation
Cuozzo, C., Porcellini, A., Angrisano, T., Morano, A., Lee, B., Pardo, A. D., Messina, S., Iuliano, R., Fusco, A., Santillo, M. R., et al. (2007) · PLoS Genetics · doi:10.1371/journal.pgen.0030110 · Cited by 198
RetractedJenuwein, T., & Allis, C. D. (2001) · Science · doi:10.1126/science.1063127 · Cited by 9,756
The language of covalent histone modifications
Strahl, B. D., & Allis, C. D. (2000) · Nature · doi:10.1038/47412 · Cited by 8,679
Okano, M., Bell, D. W., Haber, D. A., & Li, E. (1999) · Cell · doi:10.1016/s0092-8674(00)81656-6 · Cited by 6,143
Chen, X., Xiu, M., Xing, J., Yu, S., Min, D., & Guo, F. (2017) · Cellular Physiology and Biochemistry · doi:10.1159/000479439 · Cited by 5,760
Genome maintenance mechanisms for preventing cancer
Hoeijmakers, J. H. J. (2001) · Nature · doi:10.1038/35077232 · Cited by 3,939
Transcriptional silencing and longevity protein Sir2 is an NAD-dependent histone deacetylase
Imai, S.-I., Armstrong, C. M., Kaeberlein, M., & Guarente, L. (2000) · Nature · doi:10.1038/35001622 · Cited by 3,510
Histone deacetylases (HDACs): characterization of the classical HDAC family
RUIJTER, A. J. M. D., GENNIP, A. H. V., CARON, H. N., KEMP, S., & KUILENBURG, A. B. P. V. (2003) · Biochemical Journal · doi:10.1042/bj20021321 · Cited by 3,114
hSIR2SIRT1 Functions as an NAD-Dependent p53 Deacetylase
Vaziri, H., Dessain, S. K., Eaton, E. N., Imai, S., Frye, R. A., Pandita, T. K., Guarente, L., & Weinberg, R. A. (2001) · Cell · doi:10.1016/s0092-8674(01)00527-x · Cited by 2,690
Megabase Chromatin Domains Involved in DNA Double-Strand Breaks in Vivo
Rogakou, E. P., Boon, C., Redon, C., & Bonner, W. M. (1999) · The Journal of Cell Biology · doi:10.1083/jcb.146.5.905 · Cited by 2,422
Cited by
Sorted by citations
Items 201–300 of 385
Ding, N., Maiuri, A. R., & O’Hagan, H. M. (2017) · Mutation Research/Reviews in Mutation Research · doi:10.1016/j.mrrev.2017.09.005 · Cited by 36
Self-citationInteractions between DNA damage, repair, and transcription
Khobta, A., & Epe, B. (2011) · Mutation research. Fundamental and molecular mechanisms of mutagenesis · doi:10.1016/j.mrfmmm.2011.07.014 · Cited by 38
Chen, Y., Li, Y., Guan, Y., Huang, Y., Lin, J., Chen, L., Li, J., Chen, G., Pan, L. K., Xia, X., et al. (2020) · Molecular Oncology · doi:10.1002/1878-0261.12739 · Cited by 36
Greco, M., D’Alò, F., Scardocci, A., Criscuolo, M., Fabiani, E., Guidi, F., Ruscio, A. D., Migliara, G., Pagano, L., Fianchi, L., et al. (2010) · Blood Cells Molecules and Diseases · doi:10.1016/j.bcmd.2010.05.008 · Cited by 33
Vélez-Cruz, R., Zadorin, A. S., Coin, F., & Egly, J. (2012) · Proceedings of the National Academy of Sciences · doi:10.1073/pnas.1213076110 · Cited by 34
Hepatitis delta virus induces specific DNA methylation processes in Huh‐7 liver cancer cells
Benegiamo, G., Vinciguerra, M., Guarnieri, V., Niro, G. A., Andriulli, A., & Pazienza, V. (2013) · FEBS Letters · doi:10.1016/j.febslet.2013.03.021 · Cited by 33
De Novo DNA Methyltransferase DNMT3b Interacts with NEDD8-modified Proteins
Shamay, M., Greenway, M., Liao, G., Ambinder, R. F., & Hayward, S. D. (2010) · Journal of Biological Chemistry · doi:10.1074/jbc.m110.155721 · Cited by 32
Taming Tricky DSBs: ATM on duty
Clouaire, T., Marnef, A., & Legube, G. (2017) · DNA repair · doi:10.1016/j.dnarep.2017.06.010 · Cited by 37
Transcription-coupled DNA double-strand break repair
Guha, S., & Bhaumik, S. R. (2021) · DNA repair · doi:10.1016/j.dnarep.2021.103211 · Cited by 34
Bhattacharyya, N., Gupta, S., Sharma, S. M., Soni, A., Bagabir, S. A., Bhattacharyya, M., Mukherjee, A., Almalki, A. H., Alkhanani, M., Haque, S., et al. (2022) · Journal of Personalized Medicine · doi:10.3390/jpm12030393 · Cited by 32
Synaptic Proteome Changes in a DNA Repair Deficient Ercc1 Mouse Model of Accelerated Aging
Végh, M. J., de Waard, M. C., van der Pluijm, I., Ridwan, Y. R., Bergamin-Sassen, M. J. M., van Nierop, P., van der Schors, R. C., Li, K. W., Hoeijmakers, J. H. J., Smit, A. B., et al. (2012) · Journal of Proteome Research · doi:10.1021/pr201203m · Cited by 33
Replication stress, a source of epigenetic aberrations in cancer?
Jasencakova, Z., & Groth, A. (2010) · BioEssays · doi:10.1002/bies.201000055 · Cited by 29
Resveratrol and SIRT1: Antiaging Cornerstones for Oocytes?
Grzeczka, A., & Kordowitzki, P. (2022) · Nutrients · doi:10.3390/nu14235101 · Cited by 30
Lin, H., Hung, S., Lee, M., Chiou, W., Huang, T., Tseng, C.-E., Shih, L.-Y., Lin, R.-I., Lin, J. M. J., Lai, Y.-H., et al. (2014) · Oncotarget · doi:10.18632/oncotarget.2821 · Cited by 31
Brustel, J., Kozik, Z., Gromak, N., Savic, V., & Sweet, S. M. M. (2018) · Scientific Reports · doi:10.1038/s41598-018-21806-y · Cited by 33
Targeted DNA methylation of neurodegenerative disease genes via homology directed repair
Cali, C. P., Park, D. S., & Lee, E. B. (2019) · Nucleic Acids Research · doi:10.1093/nar/gkz979 · Cited by 28
Methylomic Signatures of High Grade Serous Ovarian Cancer
Cárdenas, H., Fang, F., Jiang, G., Perkins, S. M., Zhang, C., Emerson, R. E., Hutchins, G., Keer, H. N., Liu, Y., Matei, D. E., et al. (2020) · Epigenetics · doi:10.1080/15592294.2020.1853402 · Cited by 29
Inhibition of KDM6 activity during murine ES cell differentiation induces DNA damage
Hofstetter, C., Kampka, J. M., Huppertz, S., Weber, H., Schlösser, A., Müller, A. M., & Becker, M. (2016) · Journal of Cell Science · doi:10.1242/jcs.175174 · Cited by 28
Acetylation of hMOF Modulates H4K16ac to Regulate DNA Repair Genes in Response to Oxidative Stress
Zhong, J., Ji, L., Chen, H., Li, X., Zhang, J., Wang, X., Wu, W., Xu, Y. C., Huang, F., Cai, W., et al. (2017) · International Journal of Biological Sciences · doi:10.7150/ijbs.17260 · Cited by 28
DNA methylation changes following DNA damage in prostate cancer cells
Sutton, L. P., Jeffreys, S. A., Phillips, J. L., Taberlay, P. C., Holloway, A. F., Ambrose, M., Joo, J. E., Young, A., Berry, R., Skala, M., et al. (2019) · Epigenetics · doi:10.1080/15592294.2019.1629231 · Cited by 26
Epigenetic Modulation of Human Podocyte Vitamin D Receptor in HIV Milieu
Chandel, N., Ayasolla, K., Lan, X., Sultana-Syed, M., Chawla, A. K., Lederman, R., Vethantham, V., Saleem, M. A., Chander, P. N., Malhotra, A., et al. (2015) · Journal of Molecular Biology · doi:10.1016/j.jmb.2015.07.011 · Cited by 26
Liu, K., & Jiang, Y. (2016) · Cellular and Molecular Neurobiology · doi:10.1007/s10571-016-0367-y · Cited by 26
Hayashi, K., Hishikawa, A., Hashiguchi, A., Azegami, T., Yoshimoto, N., Nakamichi, R., Tokuyama, H., & Itoh, H. (2020) · Scientific Reports · doi:10.1038/s41598-019-57140-0 · Cited by 25
SIRT1 regulates Mxd1 during malignant melanoma progression
Meliso, F. M., Micali, D., Silva, C. T., Sabedot, T. S., Coetzee, S. G., Koch, A., Fahlbusch, F. B., Noushmehr, H., Schneider‐Stock, R., & Jasiulionis, M. G. (2017) · Oncotarget · doi:10.18632/oncotarget.21457 · Cited by 24
Tharayil, S. P., & Shukla, P. (2025) · International Journal of Molecular Sciences · doi:10.3390/ijms26136233 · Cited by 29
Role of DNA Methylation in Genome Stability
Zhou, D., & Robertson, K. D. (2016) · Elsevier eBooks · doi:10.1016/b978-0-12-803309-8.00024-0 · Cited by 25
Roles of DNA damage in renal tubular epithelial cells injury
Wang, P., Ouyang, J., Jia, Z., Zhang, A., & Yang, Y. (2023) · Frontiers in Physiology · doi:10.3389/fphys.2023.1162546 · Cited by 27
The sirtuins in the pathogenesis of cancer
Voelter‐Mahlknecht, S., & Mahlknecht, U. (2010) · Clinical Epigenetics · doi:10.1007/s13148-010-0008-0 · Cited by 24
Hishikawa, A., Hayashi, K., Yoshimoto, N., Nakamichi, R., Homma, K., & Itoh, H. (2020) · Scientific Reports · doi:10.1038/s41598-020-60420-9 · Cited by 24
DNA Break-Induced Epigenetic Drift as a Cause of Mammalian AgingPreprint
Hayano, M., Yang, J.-H., Bonkowski, M. S., Amorim, J. A., Ross, J. M., Coppotelli, G., Griffin, P. T., Chew, Y. C., Guo, W., Yang, X., et al. (2019) · bioRxiv (Cold Spring Harbor Laboratory) · doi:10.1101/808659 · Cited by 24
Tellez, C. S., Picchi, M. A., Juri, D. E., Do, K., Desai, D. H., Amin, S., Hutt, J. A., Filipczak, P. T., & Belinsky, S. A. (2021) · Clinical Epigenetics · doi:10.1186/s13148-021-01034-4 · Cited by 23
The interplay of DNA damage, epigenetics and tumour heterogeneity in driving cancer cell fitness
Rouault, C. D., Charafe‐Jauffret, E., & Ginestier, C. (2025) · Nature Communications · doi:10.1038/s41467-025-64445-4 · Cited by 23
Sun, D., Layman, T. S., Jeong, H., Chatterjee, P., Grogan, K. E., Merritt, J. R., Maney, D. L., & Yi, S. V. (2021) · Molecular Ecology · doi:10.1111/mec.15793 · Cited by 23
Tian, C., Liu, Q., Ma, K., Wang, Y., Chen, Q., Ambroz, R., Klinkebiel, D. L., Li, Y., Huang, Y., Ding, J., et al. (2013) · Scientific Reports · doi:10.1038/srep01345 · Cited by 22
Newman, M. R., Sykes, P. J., Blyth, B. J., Bezak, E., Lawrence, M. D., Morel, K. L., & Ormsby, R. J. (2014) · Radiation Research · doi:10.1667/rr13460.1 · Cited by 21
RNA methylation and cellular response to oxidative stress-promoting anticancer agents
Ponzetti, M., Rucci, N., & Falone, S. (2023) · Cell Cycle · doi:10.1080/15384101.2023.2165632 · Cited by 22
Friedl, A. A., Mazurek, B., & Seiler, D. M. (2012) · Frontiers in Oncology · doi:10.3389/fonc.2012.00117 · Cited by 21
Delman, M., Avcı, S. T., Akçok, İ., Kanbur, T., Erdal, E., & Çağır, A. (2019) · European Journal of Medicinal Chemistry · doi:10.1016/j.ejmech.2019.07.024 · Cited by 20
Bowden, S. A., Stockwell, P. A., Rodger, E. J., Parry, M. F., Eccles, M. R., Stayner, C., & Chatterjee, A. (2020) · Frontiers in Genetics · doi:10.3389/fgene.2020.00348 · Cited by 20
Stem cells, cancer, and epigenetics
Baylin (2009) · StemBook · doi:10.3824/stembook.1.50.1 · Cited by 22
Kobayashi, N., Dang, T. A., Pham, K. T. M., Gómez-Luciano, L. B., Vu, B. V., Izumitsu, K., Shimizu, M., Ikeda, K., Li, W., & Nakayashiki, H. (2023) · Molecular Biology and Evolution · doi:10.1093/molbev/msad186 · Cited by 19
15q12 Variants, Sputum Gene Promoter Hypermethylation, and Lung Cancer Risk: A GWAS in Smokers
Leng, S., Liu, Y., Weissfeld, J. L., Thomas, C. L., Han, Y., Picchi, M. A., Edlund, C. K., Willink, R. P., Davis, A. L. G., Kieu, C., et al. (2015) · JNCI Journal of the National Cancer Institute · doi:10.1093/jnci/djv035 · Cited by 19
Kumari, D., Lokanga, R. A., Yudkin, D. V., Zhao, X.-N., & Usdin, K. (2012) · Biochimica et Biophysica Acta (BBA) - Gene Regulatory Mechanisms · doi:10.1016/j.bbagrm.2011.12.009 · Cited by 19
Epigenome-wide association studies for breast cancer risk and risk factors.
Johansson, A., & Flanagan, J. M. (2017) · PubMed · Cited by 19
Jusakul, A., Loilome, W., Namwat, N., Techasen, A., Kuver, R., Ioannou, G. N., Savard, C. E., Haigh, W. G., & Yongvanit, P. (2013) · The Journal of Steroid Biochemistry and Molecular Biology · doi:10.1016/j.jsbmb.2013.08.004 · Cited by 19
Histone lysine modifying enzymes and their critical roles in DNA double-strand break repair
Zhang, J., Lu, X., MoghaddamKohi, S., Shi, L., Xu, X., & Zhu, W. (2021) · DNA repair · doi:10.1016/j.dnarep.2021.103206 · Cited by 18
Novel diet-related mouse model of colon cancer parallels human colon cancer
Prasad, A. R. (2014) · World Journal of Gastrointestinal Oncology · doi:10.4251/wjgo.v6.i7.225 · Cited by 18
Excavating relics of DNA methylation changes during the development of neoplasia
Hsiao, S., Huang, T. H. ‐., & Leu, Y. (2009) · Seminars in Cancer Biology · doi:10.1016/j.semcancer.2009.02.015 · Cited by 18
Simon, K. W., Tait, L. R., Miller, F. W., Cao, C., Davy, K. P., LeRoith, T., & Schmelz, E. M. (2010) · Food & Function · doi:10.1039/c0fo00108b · Cited by 17
Identification of a robust DNA methylation signature for Fanconi anemia.
Pagliara, D., Ciolfi, A., Pedace, L., Haghshenas, S., Ferilli, M., Levy, M., Miele, E., Nardini, C., Cappelletti, C., Relator, R., et al. (2023) · American Journal of Human Genetics · doi:10.1016/j.ajhg.2023.09.014 · Cited by 14
Liu, R., Qin, L., Zou, X., Wang, Y., & Pei, Y. (2021) · New Phytologist · doi:10.1111/nph.17353 · Cited by 17
Kisiel, J. B., Garrity-Park, M. M., Taylor, W. R., Smyrk, T. C., & Ahlquist, D. A. (2013) · Inflammatory Bowel Diseases · doi:10.1097/mib.0b013e31829b3f4d · Cited by 17
Jia, B., Chen, J., Wang, Q. L., Sun, X., Han, J., Guastaldi, F. P. S., Xiang, S., Ye, Q., & He, Y. (2021) · Frontiers in Cell and Developmental Biology · doi:10.3389/fcell.2021.648627 · Cited by 17
Chromatin Ubiquitination Guides DNA Double Strand Break Signaling and Repair
Kolobynina, K. G., Rapp, A. W., & Cardoso, M. C. (2022) · Frontiers in Cell and Developmental Biology · doi:10.3389/fcell.2022.928113 · Cited by 17
Wang, J., Li, D., Yang, J., Lu, C., Zhang, R., & Li, J. (2022) · Biochimie · doi:10.1016/j.biochi.2022.07.013 · Cited by 16
Concurrent genome and epigenome editing by CRISPR-mediated sequence replacement
Alexander, J., Findlay, G. M., Kircher, M., & Shendure, J. (2019) · BMC Biology · doi:10.1186/s12915-019-0711-z · Cited by 16
High-coverage methylation data of a gene model before and after DNA damage and homologous repair
Pezone, A., Russo, G., Tramontano, A., Florio, E., Scala, G., Landi, R., Zuchegna, C., Romano, A., Chiariotti, L., Muller, M. T., et al. (2017) · Scientific Data · doi:10.1038/sdata.2017.43 · Cited by 15
Garner, I., & Brown, R. E. (2022) · Cancers · doi:10.3390/cancers14061533 · Cited by 15
DNA-damaged podocyte-CD8 T cell crosstalk exacerbates kidney injury by altering DNA methylation
Nakamichi, R., Hishikawa, A., Chikuma, S., Yoshimura, A., Sasaki, T., Hashiguchi, A., Abe, T., Tokuhara, T., Yoshimoto, N., Nishimura, E. S., et al. (2023) · Cell Reports · doi:10.1016/j.celrep.2023.112302 · Cited by 14
Harlaar, N., Bryan, A. D., Thayer, R. E., Karoly, H. C., Oien, N., & Hutchison, K. E. (2013) · Alcoholism Clinical and Experimental Research · doi:10.1111/acer.12312 · Cited by 15
Leng, S., Picchi, M. A., Liu, Y., Thomas, C. L., Willis, D., Bernauer, A. M., Carr, T. G., Padilla, M. T., Han, Y., Amos, C. I., et al. (2013) · Carcinogenesis · doi:10.1093/carcin/bgt024 · Cited by 16
Can epigenetic and inflammatory biomarkers identify clinically aggressive prostate cancer?
Santos, P. B., PATEL, H. R. H., Henrique, R., & Félix, A. (2020) · World Journal of Clinical Oncology · doi:10.5306/wjco.v11.i2.43 · Cited by 15
Li, Z., Mon, H., Mitsunobu, H., Zhu, L., Xu, J. C., Lee, J. M., & Kusakabe, T. (2014) · Insect Biochemistry and Molecular Biology · doi:10.1016/j.ibmb.2014.10.001 · Cited by 15
Václavíková, R., Klajic, J., Brynychová, V., Elsnerová, K., Alnæs, G. G., Tost, J., Kristensen, V. N., Rob, L., Kodet, R., Škapa, P., et al. (2019) · Oncology Reports · doi:10.3892/or.2019.7186 · Cited by 15
DNA methylation in necrotizing enterocolitis
Frazer, L. C., Yamaguchi, Y., Singh, D. K., Akopyants, N. S., & Good, M. L. (2024) · Expert Reviews in Molecular Medicine · doi:10.1017/erm.2024.16 · Cited by 14
Linking DNA Damage and Age-Related Promoter DNA Hyper-Methylation in the Intestine
Thalheim, T., Herberg, M., & Galle, J. (2018) · Genes · doi:10.3390/genes9010017 · Cited by 15
Double-strand breaks and the concept of short- and long-term epigenetic memory
Orlowski, C., Mah, L.-J., Vasireddy, R. S., El‐Osta, A., & Karagiannis, T. C. (2010) · Chromosoma · doi:10.1007/s00412-010-0305-6 · Cited by 16
Identification of a methylation hotspot in the death receptor Fas/CD95 in bladder cancer
Williamson, K. (2011) · International Journal of Oncology · doi:10.3892/ijo.2011.1250 · Cited by 14
Sirtuins in Aging and Age-Related Diseases
Haigis, M. C., & Sinclair, D. A. (2010) · Elsevier eBooks · doi:10.1016/b978-0-12-378638-8.00011-7 · Cited by 13
Ten genes associated with MGMT promoter methylation predict the prognosis of patients with glioma
Zhang, Y., & Zhu, J. (2018) · Oncology Reports · doi:10.3892/or.2018.6903 · Cited by 13
Connecting the Dots: Interplay between Ubiquitylation and SUMOylation at DNA Double-Strand Breaks
Tang, J.-B., & Greenberg, R. A. (2010) · Genes & Cancer · doi:10.1177/1947601910382774 · Cited by 12
Olaquindox disrupts tight junction integrity and cytoskeleton architecture in mouse Sertoli cells
Wu, D., Huang, C., Jiao, X., Ding, Z., Zhang, J.-Y., Chen, F., Wang, Y., Li, X. O., & Huo, L. (2017) · Oncotarget · doi:10.18632/oncotarget.20289 · Cited by 12
Leng, S., Picchi, M. A., Kang, H., Wu, G., Filipczak, P. T., Juri, D. E., Zhang, X., Gauderman, W. J., Gilliland, F. D., & Belinsky, S. A. (2017) · Cancer Prevention Research · doi:10.1158/1940-6207.capr-17-0196 · Cited by 12
Ding, N., Miller, S. A., Savant, S. S., & O’Hagan, H. M. (2018) · Environmental and Molecular Mutagenesis · doi:10.1002/em.22269 · Cited by 12
Self-citationPerfecting DNA double-strand break repair on transcribed chromatin
Tan, X. Y., & Huen, M. S. Y. (2020) · Essays in Biochemistry · doi:10.1042/ebc20190094 · Cited by 11
Mukherjee, S., Sarkar, R., Biswas, J., & Roy, M. (2012) · International Journal of Green Nanotechnology · doi:10.1080/19430892.2012.691799 · Cited by 12
On correlative and causal links of replicative epimutations
Zhou, W., & Reizel, Y. (2024) · Trends in Genetics · doi:10.1016/j.tig.2024.08.008 · Cited by 13
Teneng, I., Picchi, M. A., Leng, S., Dagucon, C. P., Ramalingam, S. S., Tellez, C. S., & Belinsky, S. A. (2019) · DNA repair · doi:10.1016/j.dnarep.2019.04.006 · Cited by 11
Grunt, T. W., & Heller, G. (2023) · Progress in Biophysics and Molecular Biology · doi:10.1016/j.pbiomolbio.2023.05.004 · Cited by 11
Tabe-Bordbar, S., & Sinha, S. (2023) · BMC Genomics · doi:10.1186/s12864-023-09498-9 · Cited by 10
Hepatitis viruses exploitation of host DNA methyltransferases functions
Pazienza, V., Panebianco, C., & Andriulli, A. (2015) · Clinical and Experimental Medicine · doi:10.1007/s10238-015-0372-3 · Cited by 10
Caeiro, L. D., Nakata, Y., Borges, R. L., Zha, M., Garcia-Martinez, L., Bañuelos, C. P., Stransky, S., Liu, T., Chan, H. L., Brabson, J., et al. (2024) · Genes & Development · doi:10.1101/gad.351408.123 · Cited by 11
Chen, F., Zhang, Y., Shen, L., & Creighton, C. J. (2024) · Nature Communications · doi:10.1038/s41467-024-51276-y · Cited by 9
Rinaldi, M., Pezone, A., Quadrini, G. I., Abbadessa, G., Laezza, M. P., Passaro, M. L., Porcellini, A., & Costagliola, C. (2024) · Frontiers in Aging Neuroscience · doi:10.3389/fnagi.2024.1371745 · Cited by 9
HIC1 and RassF1A Methylation Attenuates Tubulin Expression and Cell Stiffness in Cancer
Chen, C., He, B.-C., Chen, Y.-L., Lee, K., Tung, C.-H., Hsu, C., Lin, P.-Y., Chu, P., Leu, Y., Fu, W.-E., et al. (2018) · International Journal of Molecular Sciences · doi:10.3390/ijms19102884 · Cited by 10
CRISPR-Cas9-induced double-strand breaks disrupt maintenance of epigenetic information
Wang, M., Zhang, Y., Bi, C., & Li, M. (2025) · Genome biology · doi:10.1186/s13059-025-03851-9 · Cited by 9
The role of the stem cell epigenome in normal aging and rejuvenative therapy
Jayarajan, J., & Milsom, M. D. (2020) · Human Molecular Genetics · doi:10.1093/hmg/ddaa167 · Cited by 8
Neighborly DISCourse: DNA double strand breaks silence transcription
Shanbhag, N. M., & Greenberg, R. A. (2010) · Cell Cycle · doi:10.4161/cc.9.18.13171 · Cited by 8
Krieger, L. M., Mladenov, E., Soni, A., Demond, M., Stuschke, M., & Iliakis, G. E. (2021) · International Journal of Molecular Sciences · doi:10.3390/ijms222010957 · Cited by 7
"Yin-Yang" of PARP1 in genotoxic and inflammatory response
Wang, S., Wu, Y., Zong, W., & Wang, Z. (2025) · DNA repair · doi:10.1016/j.dnarep.2025.103858 · Cited by 7
Feldman, A., Saleh, A., Pnueli, L., Qiao, S., Shlomi, T., Boehm, U., & Melamed, P. (2018) · The FASEB Journal · doi:10.1096/fj.201800943r · Cited by 6
Deciphering the epigenetic network in colorectal cancer
Domínguez, G. (2012) · The Journal of Pathology · doi:10.1002/path.4094 · Cited by 7
Koshiyama, M., Nakagawa, M., & Ono, A. (2019) · Healthcare · doi:10.3390/healthcare7040162 · Cited by 7
Genomic instability and aging: Causes and consequences
Gerasymchuk, M. (2021) · Elsevier eBooks · doi:10.1016/b978-0-323-85679-9.00028-3 · Cited by 7
Walker, D. M., Nicklas, J. A., & Walker, V. E. (2013) · Environmental and Molecular Mutagenesis · doi:10.1002/em.21771 · Cited by 7
CASTILHO, R. M., Castilho, L. S., Palomares, B. H., & SQUARIZE, C. H. (2024) · Genes · doi:10.3390/genes15060710 · Cited by 6
Santos, P. B., Lobo, J., Félix, A., SILVA, F. A. B. N. D., Manso, R. T., Costa, J., Lourenço, B., Sequeira, J. P., Jerónimo, C., PATEL, H. R. H., et al. (2020) · Urologic Oncology Seminars and Original Investigations · doi:10.1016/j.urolonc.2020.03.004 · Cited by 6
Chelomina, G. N., Kukla, S. P., Chelomin, V. P., & Doanh, P. N. (2021) · Biomedicines · doi:10.3390/biomedicines9091180 · Cited by 6
Wang, S., Li, G., Du, H., & Feng, J. (2023) · International Journal of Radiation Biology · doi:10.1080/09553002.2023.2267667 · Cited by 6
Small Changes, Big Effects: Chromatin Goes Aging
Lazarus, A., Banerjee, K. K., & Kolthur‐Seetharam, U. (2012) · Sub-cellular biochemistry/Subcellular biochemistry · doi:10.1007/978-94-007-4525-4_8 · Cited by 6
Metadata
- Authors
- O'Hagan, H. M., Mohammad, H. P., & Baylin, S. B.
- Affiliations
- Johns Hopkins University (US)
- Corresponding author
- Baylin, Stephen B.
- ORCID
- Baylin, Stephen B.
- Venue
- PLoS Genetics
- Publisher
- Public Library of Science (PLoS)
- Published
- 2008-08-15
- Volume
- 4
- Issue
- 8
- Pages
- e1000155
- ISSN
- 1553-7390 (ISSN-L)
- 1553-7404
- PMC
- PMC2491723
- OpenAlex
- W2092761963
- Cited by
- 386
- References
- 86
- Citations by year
- 2026: 5 · 2025: 15 · 2024: 11 · 2023: 22 · 2022: 14 · 2021: 23 · 2020: 21 · 2019: 20 · 2018: 26 · 2017: 23 · 2016: 24 · 2015: 23 · 2014: 23 · 2013: 32 · 2012: 26
- FWCI
- 10.71
- Type
- journal article
- Language
- en
- Open access
- gold
- doi.org
- Locations
- PLoS Genetics (publishedVersion, cc-by)
- PubMed Central (publishedVersion, cc-by)
- PubMed (publishedVersion)
- DOAJ (DOAJ: Directory of Open Access Journals) (submittedVersion)
- Figshare (submittedVersion, cc-by)
- Funders
- National Cancer Institute (R01CA043318, CA 043318)
- Topics
- Life Sciences › Biochemistry, Genetics and Molecular Biology › Molecular Biology › Epigenetics and DNA Methylation
- Life Sciences › Biochemistry, Genetics and Molecular Biology › Molecular Biology › DNA Repair Mechanisms
- Life Sciences › Biochemistry, Genetics and Molecular Biology › Molecular Biology › Genomics and Chromatin Dynamics
- Keywords
- DNA double-strand breaks, DNA damage, epigenetic silencing, SIRT1, DNA methylation, CpG island hypermethylation, E-cadherin promoter, DNA repair, DNMT3B, DNMT1, EZH2, histone modifications, H3K9me3, H3K27me3, transcriptional repression, cancer epigenetics
- MeSH terms
- DNA Methyltransferase 3B, Chromatin, DNA (Cytosine-5-)-Methyltransferases, Humans, Promoter Regions, Genetic, CpG Islands, DNA Methylation, Gene Silencing, Sirtuins, Cell Line, Tumor, DNA Breaks, Double-Stranded, Sirtuin 1
About these checks
Registry, retraction, Cites and statistics results are computed, not judged, with one exception: a printed reference that no index lists is read once by a model before it counts as a citation error. Claims are extracted by a model and kept only when their quote appears verbatim in the text; each cited source is then checked, with a model’s help, for whether it says what the claim relies on. Those verdicts can be wrong — read the claim’s quote and the cited source before relying on one.
Statistics and arithmetic are recomputed, not judged.
Confidence bands are shown only for fields calibrated on our annotated test set. None is calibrated yet, so no band is shown.
What counts as a claim ›How we measure confidence ›How we check this ›
Are you an author, or do you see a problem with this page? Request a review
