

The DOI matches its Crossref record; 74 of the 76 references it cites were found in a registry or an index, and 1 are not checked yet; none of the 93 sources its claims cite is checked for support yet.
Sex-Specific Genetic Structure and Social Organization in Central Asia: Insights from a Multi-Locus Study
Open accessAbstract
In the last two decades, mitochondrial DNA (mtDNA) and the non-recombining portion of the Y chromosome (NRY) have been extensively used in order to measure the maternally and paternally inherited genetic structure of human populations, and to infer sex-specific demography and history. Most studies converge towards the notion that among populations, women are genetically less structured than men. This has been mainly explained by a higher migration rate of women, due to patrilocality, a tendency for men to stay in their birthplace while women move to their husband's house. Yet, since population differentiation depends upon the product of the effective number of individuals within each deme and the migration rate among demes, differences in male and female effective numbers and sex-biased dispersal have confounding effects on the comparison of genetic structure as measured by uniparentally inherited markers. In this study, we develop a new multi-locus approach to analyze jointly autosomal and X-linked markers in order to aid the understanding of sex-specific contributions to population differentiation. We show that in patrilineal herder groups of Central Asia, in contrast to bilineal agriculturalists, the effective number of women is higher than that of men. We interpret this result, which could not be obtained by the analysis of mtDNA and NRY alone, as the consequence of the social organization of patrilineal populations, in which genetically related men (but not women) tend to cluster together. This study suggests that differences in sex-specific migration rates may not be the only cause of contrasting male and female differentiation in humans, and that differences in effective numbers do matter.
Checked 2026-11-12 · 1 reference not checked yet
Overview
CoChat Summary
Written by AI from the paper’s full text.
TL;DR
The paper develops a multi-locus autosomal/X-linked approach to separate sex-biased migration from sex-specific effective numbers in Central Asian populations. It finds that patrilineal herders, unlike bilineal agriculturalists, show a higher effective number of women than men, alongside likely higher female migration.
Key findings
- In 780 adult men from 21 Central Asian populations, NRY differentiation exceeded mtDNA differentiation, giving female-to-male effective migrant ratios of ≈2.1 for bilineal agriculturalists and ≈21.6 for patrilineal herders.
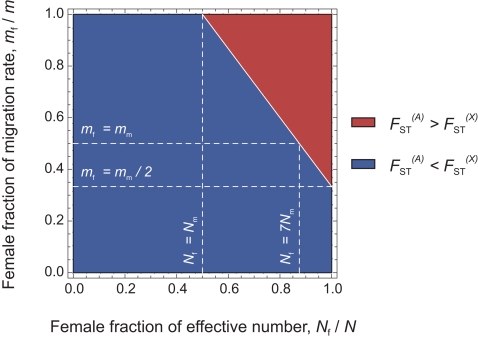
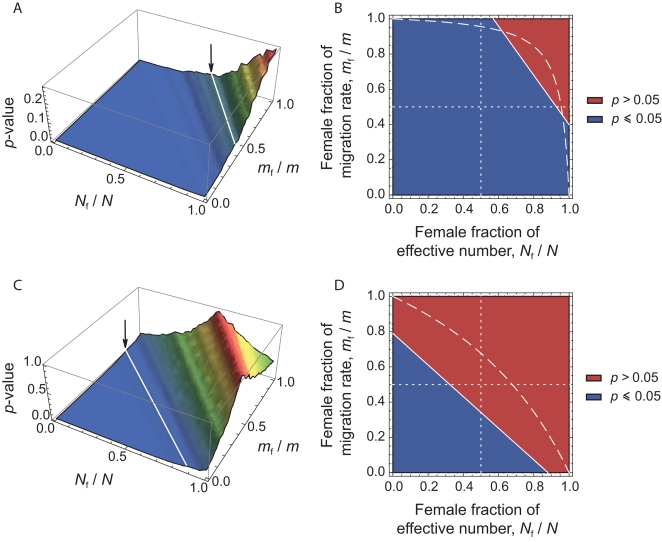
- Among patrilineal herders, autosomal differentiation was significantly higher than X-linked differentiation (one-tailed Wilcoxon; p = 0.02), implying Nf/N > 0.55 (Nf > 1.27Nm) and mf > 0.67mm; among bilineal agriculturalists the same test was not significant (p = 0.36).
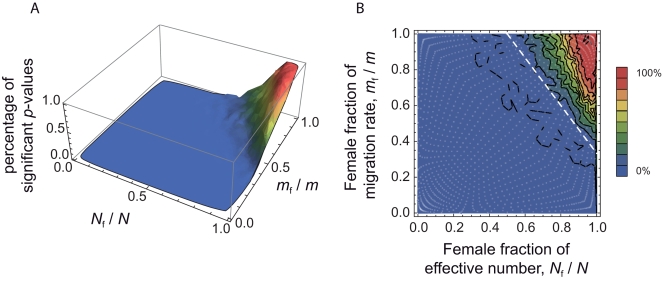
- Jackknife analyses were significant in 8 of 11 patrilineal herder groupings, with multi-locus ratios ranging from 1.7 to 3.5; bilineal agriculturalist groupings were non-significant (p > 0.109), with ratios from 0.9 to 1.2.
- In the HGDP-CEPH worldwide sample, X-linked differentiation was larger than autosomal differentiation, confirming no major male/female demographic difference at that scale; a Pakistani patrilineal subset showed higher autosomal than X-linked differentiation but non-significantly (p = 0.12).
Methods
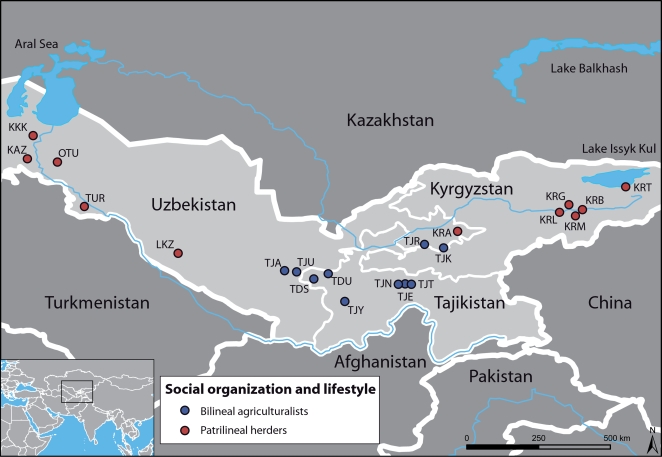
- Sampled 780 healthy adult men from 10 bilineal agriculturalist and 11 patrilineal herder populations, representing Tajiks, Kyrgyz, Karakalpaks, Kazaks, and Turkmen; genotyped mtDNA HVS-I and 11 NRY microsatellites in 18 of 21 populations.
- Genotyped 27 autosomal and 9 X-linked microsatellites in the same individuals, selected using the informativeness for assignment index In.
- Analyzed genetic differentiation with Weir and Cockerham’s FST, compared autosomal and X-linked FST via Wilcoxon tests under an infinite island model, and evaluated power and robustness with coalescent simulations and jackknife resampling.
Limitations
- Stated: the approach assumes Wright’s infinite island model—no selection, negligible mutation, equal population sizes, constant migration, and migration–mutation–drift equilibrium; the authors tested for selection and isolation by distance and argue these limits do not undermine the result.
- Stated: simulations show the method is conservative and likely detects only strong differences in male and female effective numbers for similarly sized datasets.
- Stated/evident: the authors lack ethnological data to determine the extent of past or present polygyny among herders, and the HGDP-CEPH dataset lacks detailed ethnic information, limiting interpretation of global comparisons.
Model-written summary. Check it against the paper before relying on it.
Integrity signals
Registry
Cites
Statistics
Figures
Verification
Claims the paper makes
47 Own interpretation · 26 Check pending · 16 Own result · 13 No full text of the sources · 3 Not checked yet · 3 Own method
A result the paper reports from its own data — it cites no other source for it, so there is none to check. The quote shows it is in the paper.
In the paper
“Among bilineal agriculturalists, the result was not significant: (p = 0.36).”
§ Sex-Specific Genetic Structure and Social Organization in Central Asia: Insights from a Multi-Locus Study > Results/Discussion > A New Multi-Locus Approach
plain- Asserted: passes — The authors put it forward as true.
- Checkable: passes — It can be checked against evidence.
- Load-bearing: passes — The paper’s conclusions depend on it.
- Based: passes — The paper gives a reason why it holds.
A result the paper reports from its own data — it cites no other source for it, so there is none to check. The quote shows it is in the paper.
In the paper
“The ratio in patrilineal populations is thus one order of magnitude higher than in bilineal populations.”
§ Sex-Specific Genetic Structure and Social Organization in Central Asia: Insights from a Multi-Locus Study > Results/Discussion > Uniparentally-Inherited Markers
plainstates an associationn = 780- Asserted: passes — The authors put it forward as true.
- Checkable: passes — It can be checked against evidence.
- Load-bearing: passes — The paper’s conclusions depend on it.
- Based: passes — The paper gives a reason why it holds.
A result the paper reports from its own data — it cites no other source for it, so there is none to check. The quote shows it is in the paper.
In the paper
“For the bilineal agriculturalist populations, we could not reject the hypothesis that the effective numbers and migration rates are equal across males and females or even lower in females (see Figures 3C–3D).”
§ Sex-Specific Genetic Structure and Social Organization in Central Asia: Insights from a Multi-Locus Study > Results/Discussion > A New Multi-Locus Approach
hedged- Asserted: passes — The authors put it forward as true.
- Checkable: passes — It can be checked against evidence.
- Load-bearing: passes — The paper’s conclusions depend on it.
- Based: passes — The paper gives a reason why it holds.
A result the paper reports from its own data — it cites no other source for it, so there is none to check. The quote shows it is in the paper.
In the paper
“For the patrilineal herder populations (Figures 3A–3B), most sets of (N f/N, m f/m) values are rejected, except those corresponding to larger effective numbers for females (from Figures 3A–3B: N f/N>0.55, i.e. N f>1.27N m) and m f>0.67m m.”
§ Sex-Specific Genetic Structure and Social Organization in Central Asia: Insights from a Multi-Locus Study > Results/Discussion > A New Multi-Locus Approach
plain- Asserted: passes — The authors put it forward as true.
- Checkable: passes — It can be checked against evidence.
- Load-bearing: passes — The paper’s conclusions depend on it.
- Based: passes — The paper gives a reason why it holds.
A result the paper reports from its own data — it cites no other source for it, so there is none to check. The quote shows it is in the paper.
In the paper
“The overall population structure was significantly higher for autosomal as compared to X-linked markers among patrilineal herders: (one-tailed Wilcoxon sum rank test; ; p = 0.02).”
§ Sex-Specific Genetic Structure and Social Organization in Central Asia: Insights from a Multi-Locus Study > Results/Discussion > A New Multi-Locus Approach
plainstates an association- Asserted: passes — The authors put it forward as true.
- Checkable: passes — It can be checked against evidence.
- Load-bearing: passes — The paper’s conclusions depend on it.
- Based: passes — The paper gives a reason why it holds.
- It may state two separate claims as one. 26
- Probably not a substantial claim. 31
Create a free account to see these claims.
Create a free account to see these assumptions.
54 more claims
Create a free account to see all 108 claims and to verify the 36 references still open.
Claims other papers make about this one
Each is checked against this paper’s own text: does it say what the citing paper says it does?
In the citing paper
“Thus, these lineages could have spread by social selection [14], [21], [22].”
From Y-Chromosome Variation in Altaian Kazakhs Reveals a Common Paternal Gene Pool for Kazakhs and the Influence of Mongolian Expansions (2011) · cites this paper as [22]
In the citing paper
“These cultural elements also have the ability to affect the effective population sizes of a group [11], [22].”
From Y-Chromosome Variation in Altaian Kazakhs Reveals a Common Paternal Gene Pool for Kazakhs and the Influence of Mongolian Expansions (2011) · cites this paper as [22]
In the citing paper
“The cultural customs of descent lines, marriage and residence patterns significantly affect patterns of maternal and paternal lineage diversity [22].”
From Y-Chromosome Variation in Altaian Kazakhs Reveals a Common Paternal Gene Pool for Kazakhs and the Influence of Mongolian Expansions (2011) · cites this paper as [22]
In the citing paper
“which would homogenize the mitochondrial gene pools of different groups41,42.”
From Cultural hitchhiking and competition between patrilineal kin groups explain the post-Neolithic Y-chromosome bottleneck (2018) · cites this paper as [42]
In the citing paper
“They also have a markedly lower diversity in Y-chromosomal lineages than nearby agriculturalists42,60”
From Cultural hitchhiking and competition between patrilineal kin groups explain the post-Neolithic Y-chromosome bottleneck (2018) · cites this paper as [42]
2 more claims about this paper
Create a free account to see every claim other papers make about this one.
Citations
Cites
R: A Language and Environment for Statistical Computing
R Core Team (2000) · doi:10.32614/r.manuals · Cited by 355,987
Molecular Cloning: A Laboratory Manual
Sambrook, J., Fritsch, E., & Maniatis, T. (1989) · UCLA - Biblioteca de Ciencias de la Salud · Cited by 133,589
Molecular Cloning. A Laboratory Manual
Wood, E. (1983) · Biochemical Education · doi:10.1016/0307-4412(83)90068-7 · Cited by 29,534
Gelman, A., Carlin, J. B., Stern, H. S., & Rubin, D. B. (2003) · doi:10.1201/9780429258480 · Cited by 27,276
ESTIMATING F -STATISTICS FOR THE ANALYSIS OF POPULATION STRUCTURE
Weir, B. S., & Cockerham, C. C. (1984) · Evolution · doi:10.1111/j.1558-5646.1984.tb05657.x · Cited by 18,909
Arlequin (version 3.0): An integrated software package for population genetics data analysis
Excoffier, L., Laval, G., & Schneider, S. (2005) · Evolutionary Bioinformatics · doi:10.1177/117693430500100003 · Cited by 14,265
Excoffier, L., Smouse, P. E., & Quattro, J. M. (1992) · Genetics · doi:10.1093/genetics/131.2.479 · Cited by 13,929
The detection of disease clustering and a generalized regression approach.
Mantel, N. (1967) · PubMed · doi:10.1111/jbi.14281 · Cited by 11,504
ESTIMATION OF AVERAGE HETEROZYGOSITY AND GENETIC DISTANCE FROM A SMALL NUMBER OF INDIVIDUALS
Nei, M. (1978) · Genetics · doi:10.1093/genetics/89.3.583 · Cited by 11,368
Estimating F-Statistics for the Analysis of Population Structure
Weir, B. S., & Cockerham, C. C. (1984) · Evolution · doi:10.2307/2408641 · Cited by 11,023
Research works printed but not linked: 1
- JV Neel, 1970, Lessons from a “primitive” people., Science, 170, 815
Cited by
The evolution of menopause in cetaceans and humans: the role of demography
Johnstone, R. A., & Cant, M. A. (2010) · Proceedings of the Royal Society B Biological Sciences · doi:10.1098/rspb.2010.0988 · Cited by 192
Verdu, P., Becker, N. S., Froment, A., Georges, M., Grugni, V., Quintana‐Murci, L., Hombert, J.-M., Veen, L. J. V. D., Bomin, S. L., Bahuchet, S., et al. (2013) · Molecular Biology and Evolution · doi:10.1093/molbev/mss328 · Cited by 174
Self-citationDeconstructing isolation-by-distance: The genomic consequences of limited dispersal
Aguillon, S. M., Fitzpatrick, J. W., Bowman, R., Schoech, S. J., Clark, A. G., Coop, G., & Chen, N. X. (2017) · PLoS Genetics · doi:10.1371/journal.pgen.1006911 · Cited by 137
Ancient X chromosomes reveal contrasting sex bias in Neolithic and Bronze Age Eurasian migrations
Goldberg, A., Günther, T., Rosenberg, N. A., & Jakobsson, M. (2017) · Proceedings of the National Academy of Sciences · doi:10.1073/pnas.1616392114 · Cited by 136
Nietlisbach, P., Arora, N., Nater, A., Goossens, B., van Schaik, C. P., & Krützen, M. (2012) · Molecular Ecology · doi:10.1111/j.1365-294x.2012.05539.x · Cited by 128
Metadata
- Authors
- Ségurel, L., Martínez-Cruz, B., Quintana-Murci, L., Balaresque, P., Georges, M., Hegay, T., Aldashev, A., Nasyrova, F., Jobling, M. A., Heyer, E., & Vitalis, R.
- Affiliations
- Centre National de la Recherche Scientifique (FR)
- University of Leicester (GB)
- National Center of Cardiology and Internal Medicine (KG)
- Academy of Sciences of the Republic of Tajikistan (TJ)
- Corresponding author
- Ségurel, Laure
- ORCID
- Venue
- PLoS Genetics
- Publisher
- Public Library of Science (PLoS)
- Published
- 2008-09-26
- Volume
- 4
- Issue
- 9
- Pages
- e1000200
- ISSN
- 1553-7390 (ISSN-L)
- 1553-7404
- PMC
- PMC2535577
- OpenAlex
- W2049455202
- Semantic Scholar
- 566e3bf0a229d08da0c47de921c5b378b0a4bbb7
- Cited by
- 95
- References
- 76
- Citations by year
- 2026: 1 · 2025: 2 · 2024: 4 · 2023: 3 · 2022: 1 · 2021: 2 · 2020: 1 · 2019: 3 · 2018: 8 · 2017: 8 · 2016: 2 · 2015: 5 · 2014: 7 · 2013: 7 · 2012: 5
- FWCI
- 5.45
- Type
- journal article
- Language
- en
- Open access
- gold
- doi.org
- Locations
- PLoS Genetics (publishedVersion, cc-by)
- PubMed (publishedVersion)
- PubMed Central (publishedVersion, cc-by)
- HAL (submittedVersion, other-oa)
- DOAJ (DOAJ: Directory of Open Access Journals) (submittedVersion, cc-by-sa)
- Figshare (submittedVersion, cc-by)
- Leicester Research Archive (University of Leicester) (submittedVersion, other-oa)
- Funders
- Wellcome Trust (057559/Z/99/B)
- European Science Foundation
- Ministère de l'Education Nationale, de l'Enseignement Superieur et de la Recherche
- Centre National de la Recherche Scientifique
- Muséum National d'Histoire Naturelle
- European Social Fund
- Topics
- Life Sciences › Biochemistry, Genetics and Molecular Biology › Genetics › Forensic and Genetic Research
- Life Sciences › Biochemistry, Genetics and Molecular Biology › Genetics › Genetic diversity and population structure
- Life Sciences › Biochemistry, Genetics and Molecular Biology › Genetics › Genetic Associations and Epidemiology
- Keywords
- genetic differentiation, Central Asia, sex-biased dispersal, patrilocality, social organization, uniparental markers, multilocus analysis
- MeSH terms
- Adult, Asia, Central, Computer Simulation, DNA, Mitochondrial, Emigration and Immigration, Female, Genetics, Population, Humans, Male, Population Dynamics, Sex Factors, Social Environment, Microsatellite Repeats, Polymorphism, Single Nucleotide, Chromosomes, Human, Y
About these checks
Registry, retraction, Cites and statistics results are computed, not judged, with one exception: a printed reference that no index lists is read once by a model before it counts as a citation error. Claims are extracted by a model and kept only when their quote appears verbatim in the text; each cited source is then checked, with a model’s help, for whether it says what the claim relies on. Those verdicts can be wrong — read the claim’s quote and the cited source before relying on one.
A language model drew the claims from the paper on 2026-11-12, under version 3 of the claim definition (model deepseek-v4.1-flash, prompt extract-v3).
A second model labelled each claim on 2026-11-12 (model jev-1.13-20260917, definition revision gold-guideline-v0.2).
Statistics and arithmetic are recomputed, not judged.
Confidence bands are shown only for fields calibrated on our annotated test set. None is calibrated yet, so no band is shown.
What counts as a claim ›How we measure confidence ›How we check this ›
Are you an author, or do you see a problem with this page? Request a review
How to cite
Cite CoChat for the checks on this page, and the paper for its own findings.
- This page
- CoChat. (2026). Citation check: Sex-Specific Genetic Structure and Social Organization in Central Asia: Insights from a Multi-Locus Study. https://app.cochat.ai/papers/10.1371/journal.pgen.1000200
- The paper
- Ségurel, L., Martínez-Cruz, B., Quintana-Murci, L., Balaresque, P., Georges, M., Hegay, T., Aldashev, A., Nasyrova, F., Jobling, M. A., Heyer, E., & Vitalis, R. (2008). Sex-Specific Genetic Structure and Social Organization in Central Asia: Insights from a Multi-Locus Study. PLoS Genetics. https://doi.org/10.1371/journal.pgen.1000200
