

The DOI matches its Crossref record; 80 of the 80 references it cites were found in a registry or an index.
Widespread Genomic Signatures of Natural Selection in Hominid Evolution
Open accessAbstract
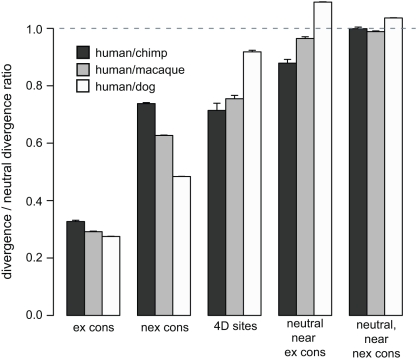
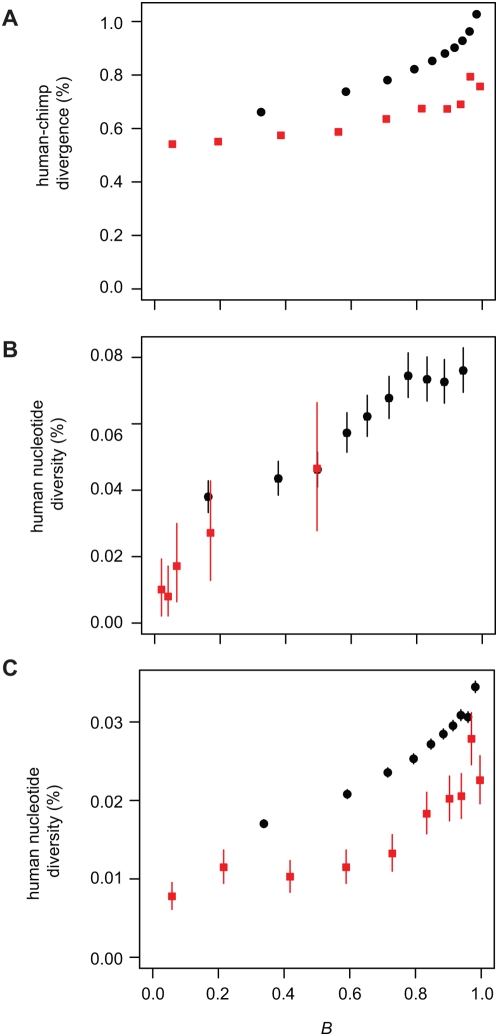
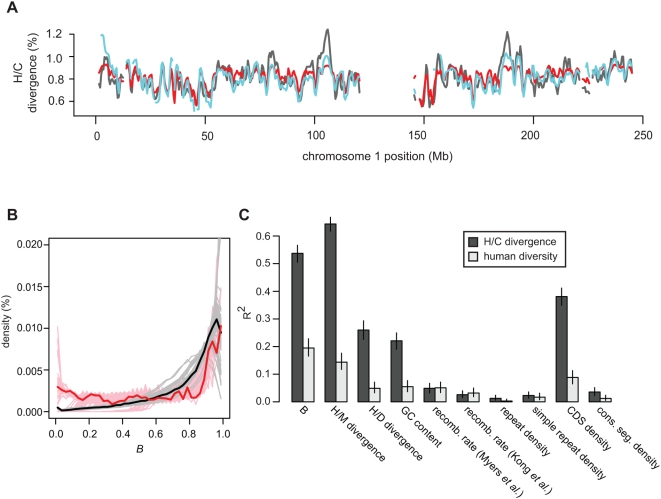
Selection acting on genomic functional elements can be detected by its indirect effects on population diversity at linked neutral sites. To illuminate the selective forces that shaped hominid evolution, we analyzed the genomic distributions of human polymorphisms and sequence differences among five primate species relative to the locations of conserved sequence features. Neutral sequence diversity in human and ancestral hominid populations is substantially reduced near such features, resulting in a surprisingly large genome average diversity reduction due to selection of 19-26% on the autosomes and 12-40% on the X chromosome. The overall trends are broadly consistent with "background selection" or hitchhiking in ancestral populations acting to remove deleterious variants. Average selection is much stronger on exonic (both protein-coding and untranslated) conserved features than non-exonic features. Long term selection, rather than complex speciation scenarios, explains the large intragenomic variation in human/chimpanzee divergence. Our analyses reveal a dominant role for selection in shaping genomic diversity and divergence patterns, clarify hominid evolution, and provide a baseline for investigating specific selective events.
Overview
The claims and statistics of this paper haven’t been checked yet.
Run the check — free, no account needed. It reads the open-access text and checks the sources it cites.
Integrity signals
Registry
Cites
Statistics
Figures
Verification
Claims the paper makes
The claims and statistics of this paper haven’t been checked yet.
Run the check — free, no account needed. It reads the open-access text and checks the sources it cites.
Claims other papers make about this one
Each is checked against this paper’s own text: does it say what the citing paper says it does?
The source backs part of the claim, not all of it — or backs it for a different population, condition or comparison.
In the citing paper
“In particular, background selection (i.e., the selective removal of deleterious alleles across the genome) appears to play a primary role in shaping the highly polygenic architecture of human traits and diseases [1, 7–9].”
From Denisovan and Neanderthal archaic introgression differentially impacted the genetics of complex traits in modern populations (2022) · cites this paper as [1]
Experimental — accuracy not yet measuredThe cited source says what the claim attributes to it.
In the citing paper
“To ensure the observed differences between aSNPs and naSNPs were not caused by different levels of background selection we downloaded from https://github.com/gmcvicker/bkgd the bed file containing the list of pre-computed values for the B-statistic in hg19 coordinates [32].”
From Denisovan introgression has shaped the immune system of present-day Papuans (2022) · cites this paper as [32]
The check wasn’t confident either way, so it gives no verdict — never disputed.
In the citing paper
“Genomic features related to natural selection are enriched for loci associated with complex traits [1, 7–9].”
From Denisovan and Neanderthal archaic introgression differentially impacted the genetics of complex traits in modern populations (2022) · cites this paper as [1]
Experimental — accuracy not yet measured
Self-check
Percentages, sums and reported differences re-computed from the paper’s own numbers.
The self-check needs the paper’s full text.
Citations
Cites
Kimura, M. (1980) · Journal of Molecular Evolution · doi:10.1007/bf01731581 · Cited by 29,778
Initial sequencing and analysis of the human genome
International Human Genome Sequencing Consortium, Whitehead Institute for Biomedical Research, C. F. G. R., Lander, E. S., Linton, L. M., Birren, B., Nusbaum, C., Zody, M. C., Baldwin, J., Devon, K., Dewar, K., et al. (2001) · Nature · doi:10.1038/35057062 · Cited by 24,216
Evolutionary trees from DNA sequences: A maximum likelihood approach.
Felsenstein, J. (1981) · Journal of Molecular Evolution · doi:10.1007/bf01734359 · Cited by 14,571
The Human Genome Browser at UCSC
Kent, W. J., Sugnet, C. W., Furey, T. S., Roskin, K. M., Pringle, T. H., Zahler, A. M., & Haussler, A. D. (2002) · Genome Research · doi:10.1101/gr.229102 · Cited by 10,400
Tandem repeats finder: a program to analyze DNA sequences
Benson, G. (1999) · Nucleic Acids Research · doi:10.1093/nar/27.2.573 · Cited by 9,374
Practical Methods of Optimization
Fletcher, R. (2000) · Wiley eBooks · doi:10.1002/9781118723203 · Cited by 7,649
Base-Calling of Automated Sequencer Traces Using Phred. I. Accuracy AssessmentPreprint
Ewing, B., Hillier, L., Wendl, M. C., & Green, P. (1998) · Genome Research · doi:10.1101/gr.8.3.175 · Cited by 6,993
Self-citationBase-Calling of Automated Sequencer Traces Using Phred. II. Error Probabilities
Ewing, B., & Green, P. (1998) · Genome Research · doi:10.1101/gr.8.3.186 · Cited by 5,439
Self-citationA second generation human haplotype map of over 3.1 million SNPs
The International HapMap Consortium (2007) · Nature · doi:10.1038/nature06258 · Cited by 4,438
Evolutionarily conserved elements in vertebrate, insect, worm, and yeast genomes
Siepel, A., Bejerano, G., Pedersen, J. S., Hinrichs, A. S., Hou, M., Rosenbloom, K., Clawson, H., Spieth, J., Hillier, L. W., Richards, S., et al. (2005) · Genome Research · doi:10.1101/gr.3715005 · Cited by 3,971 · cited 5×
“Gcons extends the two-state phylogenetic Hidden Markov Model (phyloHMM) approach used by phastCons [23] by incorporating alignment gap information.”
BackgroundMethodInfluential
Research works printed but not linked: 1
- M Galassi, 2006, GNU Scientific Library Reference Manual (2nd Ed.).
Cited by
Sorted by citations
A general framework for estimating the relative pathogenicity of human genetic variants
Kircher, M., Witten, D. M., Jain, P., O'Roak, B. J., Cooper, G. M., & Shendure, J. (2014) · Nature Genetics · doi:10.1038/ng.2892 · Cited by 6,183
LD Score regression distinguishes confounding from polygenicity in genome-wide association studies
Schizophrenia Working Group of the Psychiatric Genomics Consortium, Bulik-Sullivan, B. K., Loh, P.-R., Finucane, H. K., Ripke, S., Yang, J., Patterson, N., Daly, M. J., Price, A. L., & Neale, B. M. (2015) · Nature Genetics · doi:10.1038/ng.3211 · Cited by 5,559
A draft sequence of the Neandertal genome
Green, R. E., Krause, J., Briggs, A. W., Maricic, T., Stenzel, U., Kircher, M., Patterson, N., Li, H., Zhai, W., Fritz, M. H.-Y., et al. (2010) · Science · doi:10.1126/science.1188021 · Cited by 4,318
An integrated map of structural variation in 2,504 human genomes
Sudmant, P. H., Rausch, T., Gardner, E. J., Handsaker, R. E., Abyzov, A., Huddleston, J., Zhang, Y., Ye, K., Jun, G., Hsi-Yang Fritz, M., et al. (2015) · Nature · doi:10.1038/nature15394 · Cited by 2,354
Sequencing of 53,831 diverse genomes from the NHLBI TOPMed Program
Taliun, D., Harris, D. N., Kessler, M. D., Carlson, J., Szpiech, Z. A., Torres, R., Taliun, S. A. G., Corvelo, A., Gogarten, S. M., Kang, H. M., et al. (2021) · Nature · doi:10.1038/s41586-021-03205-y · Cited by 2,213
Metadata
- Authors
- McVicker, G., Gordon, D., Davis, C., & Green, P.
- Affiliations
- University of Washington (US)
- Howard Hughes Medical Institute (US)
- Corresponding author
- McVicker, Graham
- Green, Phil
- Venue
- PLoS Genetics
- Publisher
- Public Library of Science (PLoS)
- Published
- 2009-05-08
- Volume
- 5
- Issue
- 5
- Pages
- e1000471
- ISSN
- 1553-7390 (ISSN-L)
- 1553-7404
- PMC
- PMC2669884
- OpenAlex
- W2032311106
- Cited by
- 456
- References
- 80
- Citations by year
- 2026: 24 · 2025: 25 · 2024: 37 · 2023: 34 · 2022: 23 · 2021: 29 · 2020: 38 · 2019: 33 · 2018: 33 · 2017: 23 · 2016: 25 · 2015: 25 · 2014: 30 · 2013: 16 · 2012: 25
- FWCI
- 11.83
- Type
- journal article
- Language
- en
- Open access
- gold
- doi.org
- Locations
- PLoS Genetics (publishedVersion, cc-by)
- PubMed Central (publishedVersion, cc-by)
- PubMed (publishedVersion)
- DOAJ (DOAJ: Directory of Open Access Journals) (submittedVersion, cc-by-sa)
- Figshare (submittedVersion, cc-by)
- Funders
- Howard Hughes Medical Institute
- Natural Sciences and Engineering Research Council of Canada
- Topics
- Life Sciences › Biochemistry, Genetics and Molecular Biology › Genetics › Evolution and Genetic Dynamics
- Life Sciences › Biochemistry, Genetics and Molecular Biology › Genetics › Forensic and Genetic Research
- Life Sciences › Biochemistry, Genetics and Molecular Biology › Genetics › Genetic diversity and population structure
- Keywords
- natural selection, hominid evolution, human polymorphism, background selection, hitchhiking, X chromosome, human-chimpanzee divergence
- MeSH terms
- Animals, Pan troglodytes, Humans, Markov Chains, Models, Genetic, Primates, Recombination, Genetic, Selection, Genetic, X Chromosome, Hominidae, Genome, Human, Confidence Intervals, Likelihood Functions, Conserved Sequence, Evolution, Molecular, Polymorphism, Single Nucleotide, Chromosomes, Human, X
About these checks
Registry, retraction, Cites and statistics results are computed, not judged, with one exception: a printed reference that no index lists is read once by a model before it counts as a citation error. Claims are extracted by a model and kept only when their quote appears verbatim in the text; each cited source is then checked, with a model’s help, for whether it says what the claim relies on. Those verdicts can be wrong — read the claim’s quote and the cited source before relying on one.
Statistics and arithmetic are recomputed, not judged.
Confidence bands are shown only for fields calibrated on our annotated test set. None is calibrated yet, so no band is shown.
What counts as a claim ›How we measure confidence ›How we check this ›
Are you an author, or do you see a problem with this page? Request a review
