Cited by 228Neurogenesis and neuroplasticity mechanismsDevelopmental Biology and Gene RegulationGenomics and Chromatin Dynamics

The DOI matches its Crossref record; 47 of the 47 references it cites were found in a registry or an index.

The Transcription Factors Sox10 and Myrf Define an Essential Regulatory Network Module in Differentiating Oligodendrocytes

Open access
Hornig, Julia, Fröb, Franziska, Vogl, Michael R., Hermans-Borgmeyer, Irm, Tamm, Ernst R., Wegner, Michael·2013·PLoS Genetics

Abstract

Myelin is essential for rapid saltatory conduction and is produced by Schwann cells in the peripheral nervous system and oligodendrocytes in the central nervous system. In both cell types the transcription factor Sox10 is an essential component of the myelin-specific regulatory network. Here we identify Myrf as an oligodendrocyte-specific target of Sox10 and map a Sox10 responsive enhancer to an evolutionarily conserved element in intron 1 of the Myrf gene. Once induced, Myrf cooperates with Sox10 to implement the myelination program as evident from the physical interaction between both proteins and the synergistic activation of several myelin-specific genes. This is strongly reminiscent of the situation in Schwann cells where Sox10 first induces and then cooperates with Krox20 during myelination. Our analyses indicate that the regulatory network for myelination in oligodendrocytes is organized along similar general principles as the one in Schwann cells, but is differentially implemented.

Overview

The claims and statistics of this paper haven’t been checked yet.

Run the check — free, no account needed. It reads the open-access text and checks the sources it cites.

A few free checks a day · papers already verified open instantly · results are public

Integrity signals

Registry

Crossref · 10.1371/journal.pgen.1003907

Cites

47 of 47 references verified0 citation errors · 0 not checkable

Statistics

Figures

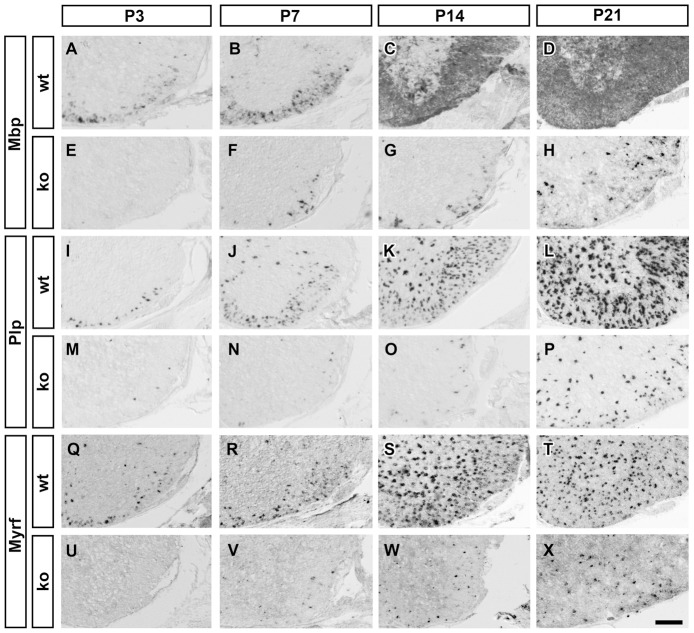
Figure 1 Consequences of CNS-specific Sox10 deletion on the expression of myelination-associated genes in OL. Differentiating OL were visualized by in situ hybridization on transverse spinal cord sections from the forelimb region of wildtype (wt) (A–D,I–L,Q–T) or Sox10ΔCNS (ko) (E–H,M–P,U–X) mice at P3 (A,E,I,M,Q,U), P7 (B,F,J,N,R,V), P14 (C,G,K,O,S,W) and P21 (D,H,L,P,T,X) using antisense probes against Mbp (A–H), Plp (I–P), and Myrf (Q–X). Ventral horn region is shown. Scale bar, 200 µm.
Figure 1 Consequences of CNS-specific Sox10 deletion on the expression of myelination-associated genes in OL. Differentiating OL were visualized by in situ hybridization on transverse spinal cord sections from the forelimb region of wildtype (wt) (A–D,I–L,Q–T) or Sox10ΔCNS (ko) (E–H,M–P,U–X) mice at P3 (A,E,I,M,Q,U), P7 (B,F,J,N,R,V), P14 (C,G,K,O,S,W) and P21 (D,H,L,P,T,X) using antisense probes against Mbp (A–H), Plp (I–P), and Myrf (Q–X). Ventral horn region is shown. Scale bar, 200 µm.CC BY · PubMed Central
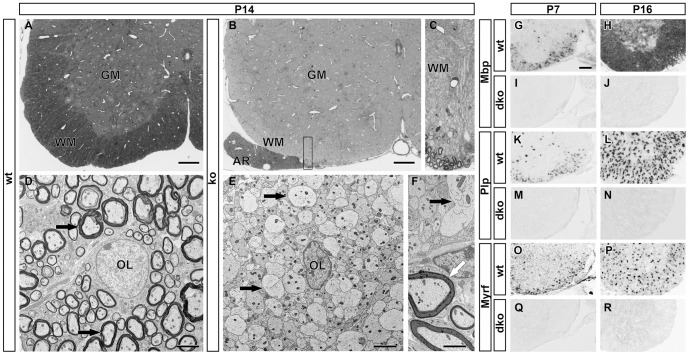
Figure 2 Histological analysis of myelination after CNS-specific Sox10 deletion and consequences of combined deletion of Sox8 and Sox10 on myelin gene expression. (A–C) Light microscopy of 1 µm semi-thin sections of the spinal cord ventral horn in wildtype (wt) (A) and Sox10ΔCNS (ko) mice (B,C) at P14 following Richardson's stain. Myelinated axons are stained in the white matter (WM) of the wildtype, but not the mutant. Sections from Sox10ΔCNS mice contain myelin only in the anterior rootlet (AR) where it is formed by Schwann cells. C represents a higher magnification of the area boxed in B. GM, grey matter. Scale bars, 100 µm. (D–F) Transmission electron microscopy of the wildtype spinal cord ventral horn at P14 shows myelinated axons (D, black arrows) around an OL (OL) in the white matter. In contrast, OL in Sox10ΔCNS mice are surrounded by axons that lack myelin sheaths (E,F, black arrows). In mutant mice only Schwann cells in the anterior rootlet have formed myelin sheaths (F, white arrow). Scale bars, 2.5 µm. (G–R) Differentiating OL were visualized by in situ hybridization on transverse spinal cord sections from the forelimb region of wildtype (wt) (G,H,K,L,O,P) or Sox10ΔCNS Sox8lacZ/lacZ (dko) (I,J,M,N,Q,R) mice at P7 (G,I,K,M,O,Q), and P16 (H,J,L,N,P,R) using antisense probes against Mbp (G–J), Plp (K–N), and Myrf (O–R). Ventral horn region is shown. Scale bar, 200 µm.
Figure 2 Histological analysis of myelination after CNS-specific Sox10 deletion and consequences of combined deletion of Sox8 and Sox10 on myelin gene expression. (A–C) Light microscopy of 1 µm semi-thin sections of the spinal cord ventral horn in wildtype (wt) (A) and Sox10ΔCNS (ko) mice (B,C) at P14 following Richardson's stain. Myelinated axons are stained in the white matter (WM) of the wildtype, but not the mutant. Sections from Sox10ΔCNS mice contain myelin only in the anterior rootlet (AR) where it is formed by Schwann cells. C represents a higher magnification of the area boxed in B. GM, grey matter. Scale bars, 100 µm. (D–F) Transmission electron microscopy of the wildtype spinal cord ventral horn at P14 shows myelinated axons (D, black arrows) around an OL (OL) in the white matter. In contrast, OL in Sox10ΔCNS mice are surrounded by axons that lack myelin sheaths (E,F, black arrows). In mutant mice only Schwann cells in the anterior rootlet have formed myelin sheaths (F, white arrow). Scale bars, 2.5 µm. (G–R) Differentiating OL were visualized by in situ hybridization on transverse spinal cord sections from the forelimb region of wildtype (wt) (G,H,K,L,O,P) or Sox10ΔCNS Sox8lacZ/lacZ (dko) (I,J,M,N,Q,R) mice at P7 (G,I,K,M,O,Q), and P16 (H,J,L,N,P,R) using antisense probes against Mbp (G–J), Plp (K–N), and Myrf (O–R). Ventral horn region is shown. Scale bar, 200 µm.CC BY · PubMed Central
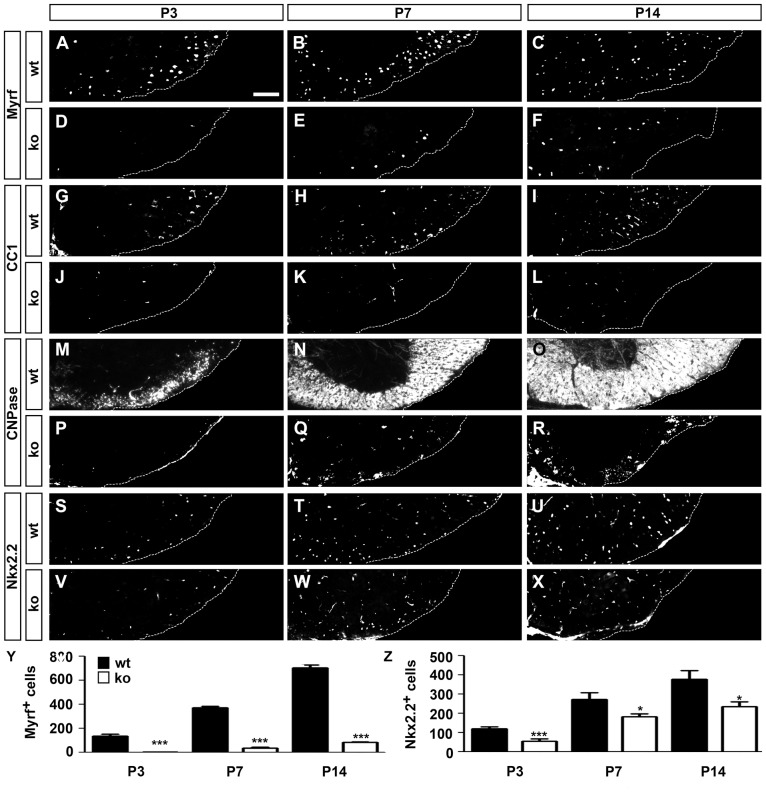
Figure 3 Consequences of CNS-specific Sox10 deletion on the expression of marker proteins of differentiating OL. (A–X) Immunohistochemistry was performed on transverse spinal cord sections from the forelimb region of wildtype (wt) (A–C,G–I,M–O,S–U) or Sox10ΔCNS (ko) (D–F,J–L,P–R,V–X) mice at P3 (A,D,G,J,M,P,S,V), P7 (B,E,H,K,N,Q,T,W) and P14 (C,F,I,L,O,R,U,X) using antibodies directed against Myrf (A–F), CC1 (G–L), CNPase (M–R), and Nkx2.2 (S–X). Ventral horn region is shown. Scale bar, 75 µm. (Y,Z) From these stainings, the total number of Myrf-positive (Y) and Nkx2.2-positive cells in the white matter (Z) was quantified in wildtype (black bars) and Sox10ΔCNS (white bars) mice. At least 9 separate sections from the forelimb region of 3 independent specimens were counted for each age and genotype. Data are presented as mean ± SEM for biological replicates. Differences to the wildtype were statistically significant for oligodendroglial cell numbers between wildtype and mutant from P3 onwards as determined by the Student's t test (*, P≤0.05; ***, P≤0.001).
Figure 3 Consequences of CNS-specific Sox10 deletion on the expression of marker proteins of differentiating OL. (A–X) Immunohistochemistry was performed on transverse spinal cord sections from the forelimb region of wildtype (wt) (A–C,G–I,M–O,S–U) or Sox10ΔCNS (ko) (D–F,J–L,P–R,V–X) mice at P3 (A,D,G,J,M,P,S,V), P7 (B,E,H,K,N,Q,T,W) and P14 (C,F,I,L,O,R,U,X) using antibodies directed against Myrf (A–F), CC1 (G–L), CNPase (M–R), and Nkx2.2 (S–X). Ventral horn region is shown. Scale bar, 75 µm. (Y,Z) From these stainings, the total number of Myrf-positive (Y) and Nkx2.2-positive cells in the white matter (Z) was quantified in wildtype (black bars) and Sox10ΔCNS (white bars) mice. At least 9 separate sections from the forelimb region of 3 independent specimens were counted for each age and genotype. Data are presented as mean ± SEM for biological replicates. Differences to the wildtype were statistically significant for oligodendroglial cell numbers between wildtype and mutant from P3 onwards as determined by the Student's t test (*, P≤0.05; ***, P≤0.001).CC BY · PubMed Central
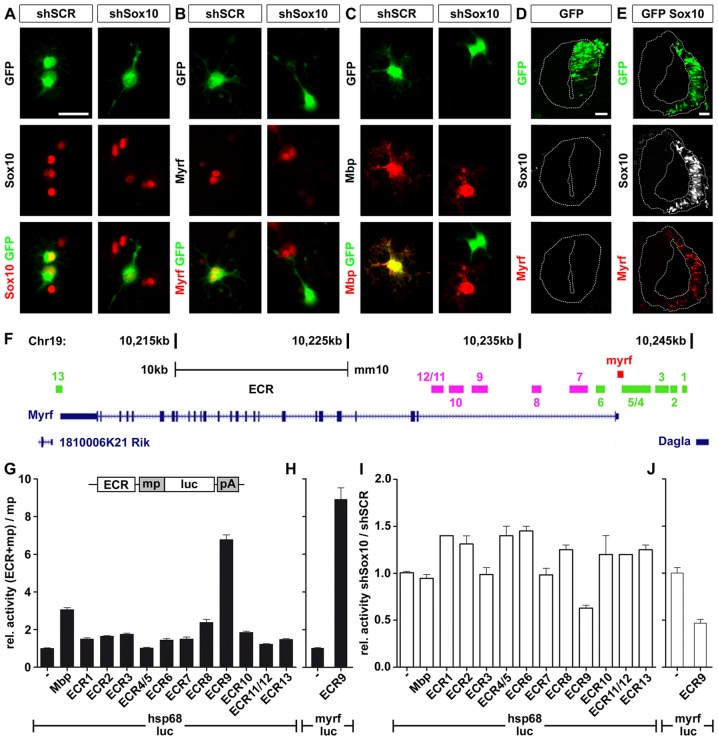
Figure 4 Myrf is a Sox10 target gene in OL. (A–C) Primary rat OPC were transfected with expression vectors for scrambled (shSCR) or Sox10-specific shRNAs (shSox10) and GFP, and replated in differentiation medium. One day later, transfected cells were visualized by GFP expression (green) and analyzed for their expression of Sox10 (A), Myrf (B) and Mbp (C) (all in red) as indicated. The yellow color in the merged pictures indicates co-expression. Scale bar, 25 µm. (D,E) Neural tube electroporations were carried out in HH11-stage chicken embryos using expression vectors for GFP (D) and a combination of Sox10 and GFP (E). Analysis was one day after electroporation and the electroporated right side is visualized by GFP expression (green). Sections were simultaneously probed for the occurrence of Sox10 (white) and Myrf (red). Scale bars, 25 µm. (F) Several ECR (ECR1-ECR13) are localized in the Myrf genomic interval on mouse chromosome 19 between the adjacent Dagla and 1810006K21 Rik genes. ECR locations relative to introns and exons of the Myrf gene are shown. ECR1-ECR6 and ECR13 (marked in green) are conserved among mammals, ECR7-ECR12 (marked in pink) additionally in birds. (G, H) The Myrf ECR were tested in 33B cells after transient transfection for their ability to increase expression of a luciferase reporter under control of a minimal promoter (mp). The minimal promoter was taken from the Hsp68 gene (hsp68-luc) (G) or the Myrf gene (myrf-luc) (H). Luciferase activities in extracts from transfected cells were determined 48 hours post-transfection in three experiments each performed in quadruplicates. The luciferase activity obtained for a reporter plasmid containing only the minimal promoter (−) was arbitrarily set to 1. Activities in the presence of ECRs were calculated relative to minimal promoter activity and are presented as mean ± SEM. A reporter in which the minimal promoter was combined with Mbp regulatory regions served as positive control. (I, J) Transfections of the ECR containing hsp68-luc (I) and myrf-luc (J) reporters were carried out in the presence of Sox10-specific shRNA (shSox10) and scrambled (shSCR) shRNA. Luciferase activities were determined and the ratio of activities in the presence of Sox10-specific shRNA versus scrambled shRNA was calculated. Normalized values are presented as mean ± SEM. Experiments were performed three times in quadruplicates. shSox10-dependent downregulation of the activity of ECR9-containing luciferase reporters was statistically significant (P≤0.05, determined by Student's t test).
Figure 4 Myrf is a Sox10 target gene in OL. (A–C) Primary rat OPC were transfected with expression vectors for scrambled (shSCR) or Sox10-specific shRNAs (shSox10) and GFP, and replated in differentiation medium. One day later, transfected cells were visualized by GFP expression (green) and analyzed for their expression of Sox10 (A), Myrf (B) and Mbp (C) (all in red) as indicated. The yellow color in the merged pictures indicates co-expression. Scale bar, 25 µm. (D,E) Neural tube electroporations were carried out in HH11-stage chicken embryos using expression vectors for GFP (D) and a combination of Sox10 and GFP (E). Analysis was one day after electroporation and the electroporated right side is visualized by GFP expression (green). Sections were simultaneously probed for the occurrence of Sox10 (white) and Myrf (red). Scale bars, 25 µm. (F) Several ECR (ECR1-ECR13) are localized in the Myrf genomic interval on mouse chromosome 19 between the adjacent Dagla and 1810006K21 Rik genes. ECR locations relative to introns and exons of the Myrf gene are shown. ECR1-ECR6 and ECR13 (marked in green) are conserved among mammals, ECR7-ECR12 (marked in pink) additionally in birds. (G, H) The Myrf ECR were tested in 33B cells after transient transfection for their ability to increase expression of a luciferase reporter under control of a minimal promoter (mp). The minimal promoter was taken from the Hsp68 gene (hsp68-luc) (G) or the Myrf gene (myrf-luc) (H). Luciferase activities in extracts from transfected cells were determined 48 hours post-transfection in three experiments each performed in quadruplicates. The luciferase activity obtained for a reporter plasmid containing only the minimal promoter (−) was arbitrarily set to 1. Activities in the presence of ECRs were calculated relative to minimal promoter activity and are presented as mean ± SEM. A reporter in which the minimal promoter was combined with Mbp regulatory regions served as positive control. (I, J) Transfections of the ECR containing hsp68-luc (I) and myrf-luc (J) reporters were carried out in the presence of Sox10-specific shRNA (shSox10) and scrambled (shSCR) shRNA. Luciferase activities were determined and the ratio of activities in the presence of Sox10-specific shRNA versus scrambled shRNA was calculated. Normalized values are presented as mean ± SEM. Experiments were performed three times in quadruplicates. shSox10-dependent downregulation of the activity of ECR9-containing luciferase reporters was statistically significant (P≤0.05, determined by Student's t test).CC BY · PubMed Central
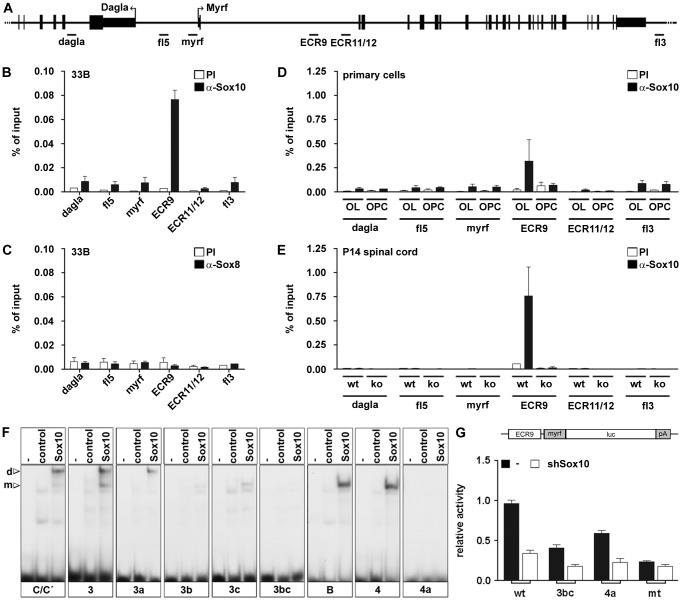
Figure 5 Sox10 binds to intron 1 of the Myrf gene both in vivo and in vitro. (A) Schematic representation of the location of regions from the Myrf locus probed by PCR in ChIP studies including the Myrf minimal promoter (myrf), ECR9, ECR11/12 and additional control regions from the 5′ (fl5) and 3′ (3fl) flanking regions of the Myrf gene and from within the adjacent Dagla gene (dagla). (B–E) ChIP was performed on 33B cells (B,C), rat primary oligodendroglial cells kept in proliferation medium (OPC) or differentiation medium (OL) (D) and P14 spinal cord from wildtype (wt) and Sox10ΔCNS (ko) mice (E) using antibodies directed against Sox10 (α-Sox10) (B,D,E) or Sox8 (α-Sox8) (C) and control preimmune serum (PI). Quantitative PCR was applied on the immunoprecipitate. Values for each fragment correspond to the percentage of material precipitated from the input and represent the mean ± SEM of at least 3 biological replicates. (F) EMSA was performed with radiolabelled double-stranded oligonucleotides 3 and 4 in wildtype (3, 4) and mutant (3a, 3b, 3c, 3bc, 4a) versions as indicated below the gels. Oligonucleotides were incubated in the absence (−), or presence (control, Sox10) of protein extracts before gel electrophoresis as indicated above the lanes. Extracts were from mock-transfected HEK293 cells (control) or HEK293 cells expressing full length Sox10 (Sox10). Oligonucleotides with site B and site C/C′ from the Mpz promoter [29] served as positive control for Sox10 binding and as marker for the mobility of complexes containing either Sox10 monomers (m) or dimers (d). (G) ECR9_myrf-luc reporter plasmids were co-transfected in wildtype (wt) or mutant (3bc, 4a, mt) version in 33B cells with empty shRNA expression vector or vectors coding for Sox10-specific shRNA. The mt version corresponds to a combination of the 3bc and 4a mutations. Luciferase activities were determined and the activity of the wildtype ECR9_myrf-luc reporter in the presence of empty shRNA expression vector was arbitrarily set to 1. All other activities were calculated relative to this value and are presented as mean ± SEM. All experiments were performed three times in quadruplicates.
Figure 5 Sox10 binds to intron 1 of the Myrf gene both in vivo and in vitro. (A) Schematic representation of the location of regions from the Myrf locus probed by PCR in ChIP studies including the Myrf minimal promoter (myrf), ECR9, ECR11/12 and additional control regions from the 5′ (fl5) and 3′ (3fl) flanking regions of the Myrf gene and from within the adjacent Dagla gene (dagla). (B–E) ChIP was performed on 33B cells (B,C), rat primary oligodendroglial cells kept in proliferation medium (OPC) or differentiation medium (OL) (D) and P14 spinal cord from wildtype (wt) and Sox10ΔCNS (ko) mice (E) using antibodies directed against Sox10 (α-Sox10) (B,D,E) or Sox8 (α-Sox8) (C) and control preimmune serum (PI). Quantitative PCR was applied on the immunoprecipitate. Values for each fragment correspond to the percentage of material precipitated from the input and represent the mean ± SEM of at least 3 biological replicates. (F) EMSA was performed with radiolabelled double-stranded oligonucleotides 3 and 4 in wildtype (3, 4) and mutant (3a, 3b, 3c, 3bc, 4a) versions as indicated below the gels. Oligonucleotides were incubated in the absence (−), or presence (control, Sox10) of protein extracts before gel electrophoresis as indicated above the lanes. Extracts were from mock-transfected HEK293 cells (control) or HEK293 cells expressing full length Sox10 (Sox10). Oligonucleotides with site B and site C/C′ from the Mpz promoter [29] served as positive control for Sox10 binding and as marker for the mobility of complexes containing either Sox10 monomers (m) or dimers (d). (G) ECR9_myrf-luc reporter plasmids were co-transfected in wildtype (wt) or mutant (3bc, 4a, mt) version in 33B cells with empty shRNA expression vector or vectors coding for Sox10-specific shRNA. The mt version corresponds to a combination of the 3bc and 4a mutations. Luciferase activities were determined and the activity of the wildtype ECR9_myrf-luc reporter in the presence of empty shRNA expression vector was arbitrarily set to 1. All other activities were calculated relative to this value and are presented as mean ± SEM. All experiments were performed three times in quadruplicates.CC BY · PubMed Central
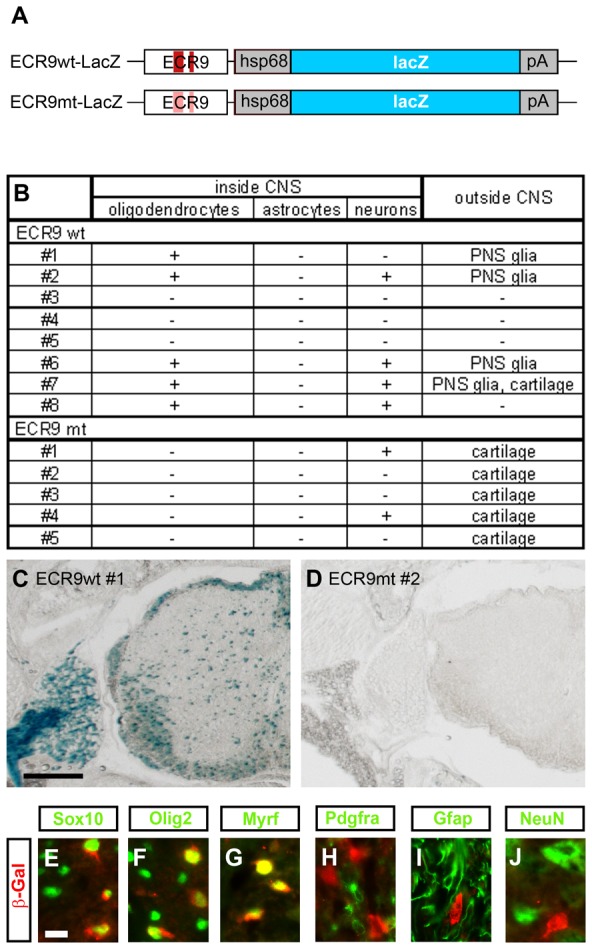
Figure 6 ECR9 is an OL enhancer in vivo. (A) Schematic representation of the transgenic constructs consisting of ECR9 in wildtype (ECR9wt) or mutant (ECR9mt) version, the minimal Hsp68 promoter (hsp68), the lacZ marker gene (lacZ) and a SV40 polyA signal (pA). Original Sox binding sites are marked in dark red, inactivated ones in light red. (B) Summary of lacZ expression patterns in ECR9wt-lacZ and ECR9mt-lacZ transgenic animals as determined by X-gal staining and immunohistochemistry on transverse sections at P7. (C,D) Detection of lacZ expression by X-gal staining of transverse sections from the forelimb level of seven day old pups carrying the ECR9wt-lacZ (animal #1) (C) or the ECR9mt-lacZ (animal #2) (D) transgene. Only spinal cord and adjacent tissues are shown. Size bar, 200 µm. (E–J) Co-immunohistochemistry was performed on transverse sections of ECR9wt-lacZ transgenic animal #1 using antibodies directed against β-galactosidase (in red) in combination with antibodies directed against Sox10 (E), Olig2 (F), Myrf (G), Pdgfra (H), Gfap (I), and NeuN (J) (all in green). Pictures were taken from the dorsal funiculus for E–I and from the ventral grey matter for J. Size bars correspond to 10 µm.
Figure 6 ECR9 is an OL enhancer in vivo. (A) Schematic representation of the transgenic constructs consisting of ECR9 in wildtype (ECR9wt) or mutant (ECR9mt) version, the minimal Hsp68 promoter (hsp68), the lacZ marker gene (lacZ) and a SV40 polyA signal (pA). Original Sox binding sites are marked in dark red, inactivated ones in light red. (B) Summary of lacZ expression patterns in ECR9wt-lacZ and ECR9mt-lacZ transgenic animals as determined by X-gal staining and immunohistochemistry on transverse sections at P7. (C,D) Detection of lacZ expression by X-gal staining of transverse sections from the forelimb level of seven day old pups carrying the ECR9wt-lacZ (animal #1) (C) or the ECR9mt-lacZ (animal #2) (D) transgene. Only spinal cord and adjacent tissues are shown. Size bar, 200 µm. (E–J) Co-immunohistochemistry was performed on transverse sections of ECR9wt-lacZ transgenic animal #1 using antibodies directed against β-galactosidase (in red) in combination with antibodies directed against Sox10 (E), Olig2 (F), Myrf (G), Pdgfra (H), Gfap (I), and NeuN (J) (all in green). Pictures were taken from the dorsal funiculus for E–I and from the ventral grey matter for J. Size bars correspond to 10 µm.CC BY · PubMed Central
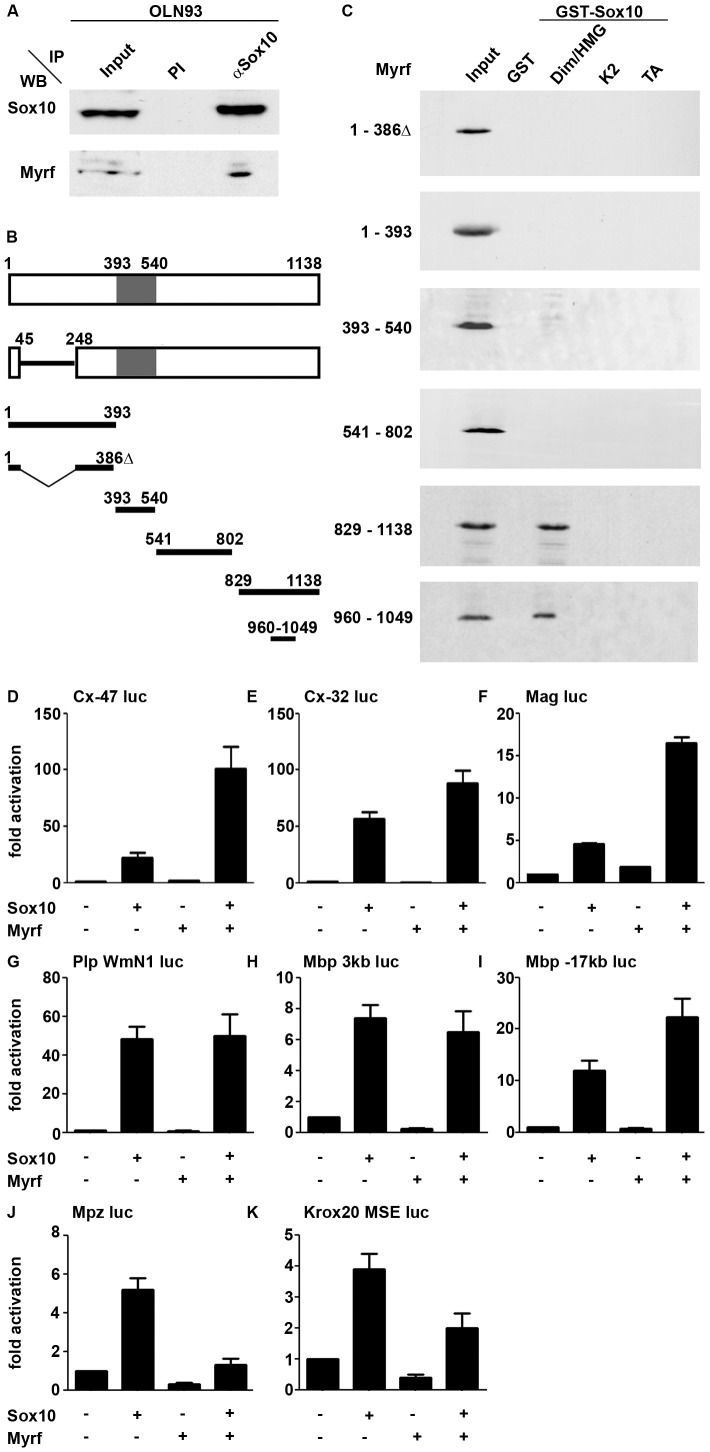
Figure 7 Sox10 and Myrf interact physically and functionally. (A) Co-immunoprecipitation (IP) of endogenous Myrf with anti-Sox10 antiserum (αSox10) or preimmune serum (PI) from OLN93 cell extracts. The upper panel shows western blot (WB) detection of Sox10, while the lower panel probes the presence of Myrf in the precipitate using antibodies specifically directed against the carboxyterminal part of the protein. Input corresponds to one tenth of the amount of the protein used in the assay. (B) Schematic representation of the Myrf isoform identified by [19] (upper bar, NCBI accession number Q3UR85.2), the splice variant used in this study (lower bar, NCBI accession number AAI57943.1) and various fragments used in interaction studies. Numbers represent amino acid positions. The DNA-binding Ntd80 domain is marked in grey. (C) Pulldown assays were performed with Sox10 fragments immobilized as GST-fusions on glutathione sepharose beads and the Myc-tagged Myrf fragments produced in HEK293 cell extracts. Detection of Myrf fragments was by western blot using an antibody directed against the Myc tag. Sox10 regions fused to GST included the dimerization and HMG domains (Dim/HMG), the K2 region and the transactivation domain (TA). (D–K) Transient transfections were performed in N2a cells with a luciferase reporter under control of the 727 bp Cx-47 1b promoter (D), the 416 bp Cx-32 P2 promoter (E), the 626 bp Mag promoter (F), the 1.2 kb WmN1 Plp enhancer (G), the 3 kb upstream region of the Mbp gene (H), a 631 bp conserved region 17 kb upstream of the Mbp gene (I), the 415 bp Mpz promoter (J) and the 1.3 kb MSE Krox20 enhancer (K). Empty pCMV5 expression plasmids (−) or expression plasmids for Sox10 and Myrf were co-transfected as indicated below the bars. Luciferase activities in extracts from transfected cells were determined in at least four experiments each performed in triplicates. The activity obtained for the luciferase reporter in the absence of ectopic transcription factor was arbitrarily set to 1. Fold inductions in the presence of transcription factors were calculated and are presented as mean ± SEM.
Figure 7 Sox10 and Myrf interact physically and functionally. (A) Co-immunoprecipitation (IP) of endogenous Myrf with anti-Sox10 antiserum (αSox10) or preimmune serum (PI) from OLN93 cell extracts. The upper panel shows western blot (WB) detection of Sox10, while the lower panel probes the presence of Myrf in the precipitate using antibodies specifically directed against the carboxyterminal part of the protein. Input corresponds to one tenth of the amount of the protein used in the assay. (B) Schematic representation of the Myrf isoform identified by [19] (upper bar, NCBI accession number Q3UR85.2), the splice variant used in this study (lower bar, NCBI accession number AAI57943.1) and various fragments used in interaction studies. Numbers represent amino acid positions. The DNA-binding Ntd80 domain is marked in grey. (C) Pulldown assays were performed with Sox10 fragments immobilized as GST-fusions on glutathione sepharose beads and the Myc-tagged Myrf fragments produced in HEK293 cell extracts. Detection of Myrf fragments was by western blot using an antibody directed against the Myc tag. Sox10 regions fused to GST included the dimerization and HMG domains (Dim/HMG), the K2 region and the transactivation domain (TA). (D–K) Transient transfections were performed in N2a cells with a luciferase reporter under control of the 727 bp Cx-47 1b promoter (D), the 416 bp Cx-32 P2 promoter (E), the 626 bp Mag promoter (F), the 1.2 kb WmN1 Plp enhancer (G), the 3 kb upstream region of the Mbp gene (H), a 631 bp conserved region 17 kb upstream of the Mbp gene (I), the 415 bp Mpz promoter (J) and the 1.3 kb MSE Krox20 enhancer (K). Empty pCMV5 expression plasmids (−) or expression plasmids for Sox10 and Myrf were co-transfected as indicated below the bars. Luciferase activities in extracts from transfected cells were determined in at least four experiments each performed in triplicates. The activity obtained for the luciferase reporter in the absence of ectopic transcription factor was arbitrarily set to 1. Fold inductions in the presence of transcription factors were calculated and are presented as mean ± SEM.CC BY · PubMed Central

Verification

Claims the paper makes

The claims and statistics of this paper haven’t been checked yet.

Run the check — free, no account needed. It reads the open-access text and checks the sources it cites.

A few free checks a day · papers already verified open instantly · results are public

Claims other papers make about this one

Each is checked against this paper’s own text: does it say what the citing paper says it does?

Self-check

Percentages, sums and reported differences re-computed from the paper’s own numbers.

The self-check needs the paper’s full text.

Citations

Cites

Show all 47 references

Cited by

Sorted by citations

See all 228

Metadata

Authors
Hornig, J., Fröb, F., Vogl, M. R., Hermans-Borgmeyer, I., Tamm, E. R., & Wegner, M.
Affiliations
  • Friedrich-Alexander-Universität Erlangen-Nürnberg (DE)
  • University of Regensburg (DE)
Corresponding author
Wegner, Michael
Venue
PLoS Genetics
Published
2013-10-31
Volume
9
Issue
10
Pages
e1003907
ISSN
  • 1553-7390 (ISSN-L)
  • 1553-7404
OpenAlex
W2083561210
Cited by
228
References
47
Citations by year
2026: 15 · 2025: 22 · 2024: 19 · 2023: 11 · 2022: 24 · 2021: 19 · 2020: 23 · 2019: 24 · 2018: 16 · 2017: 16 · 2016: 17 · 2015: 14 · 2014: 5 · 2013: 3
FWCI
4.83
Type
journal article
Language
en
Open access
Locations
  • PLoS Genetics (publishedVersion, cc-by)
  • Europe PMC (PubMed Central) (publishedVersion, cc-by)
  • PubMed Central (publishedVersion, cc-by)
  • PubMed (publishedVersion)
  • DOAJ (DOAJ: Directory of Open Access Journals) (submittedVersion, cc-by-sa)
  • Figshare (submittedVersion, cc-by)
  • OPUS FAU (Kooperativer Bibliotheksverbund Berlin-Brandenburg (KOBV), on behalf of the Universitätsbibliothek Erlangen-Nürnberg) (submittedVersion)
Funders
Deutsche Forschungsgemeinschaft (We1326/11)
Topics
  • Life Sciences › Neuroscience › Developmental Neuroscience › Neurogenesis and neuroplasticity mechanisms
  • Life Sciences › Biochemistry, Genetics and Molecular Biology › Molecular Biology › Developmental Biology and Gene Regulation
  • Life Sciences › Biochemistry, Genetics and Molecular Biology › Molecular Biology › Genomics and Chromatin Dynamics
Keywords
SOX10, MYRF, oligodendrocyte differentiation, myelination, transcriptional regulatory networks, enhancers, Krox20, Schwann cells, protein-protein interaction, central nervous system myelin
MeSH terms
Animals, Cell Differentiation, Cell Line, Central Nervous System, High Mobility Group Proteins, Humans, Mice, Transgenic, Myelin Sheath, Oligodendroglia, Schwann Cells, Transcription Factors, Gene Expression Regulation, Developmental, Mice, Early Growth Response Protein 2, Gene Regulatory Networks, SOXE Transcription Factors

About these checks

Registry, retraction, Cites and statistics results are computed, not judged, with one exception: a printed reference that no index lists is read once by a model before it counts as a citation error. Claims are extracted by a model and kept only when their quote appears verbatim in the text; each cited source is then checked, with a model’s help, for whether it says what the claim relies on. Those verdicts can be wrong — read the claim’s quote and the cited source before relying on one.

Statistics and arithmetic are recomputed, not judged.

Confidence bands are shown only for fields calibrated on our annotated test set. None is calibrated yet, so no band is shown.

What counts as a claim ›How we measure confidence ›How we check this ›

Are you an author, or do you see a problem with this page? Request a review