

The DOI matches its Crossref record; 37 of the 37 references it cites were found in a registry or an index.
Variable generalization performance of a deep learning model to detect pneumonia in chest radiographs: A cross-sectional study
Open accessAbstract
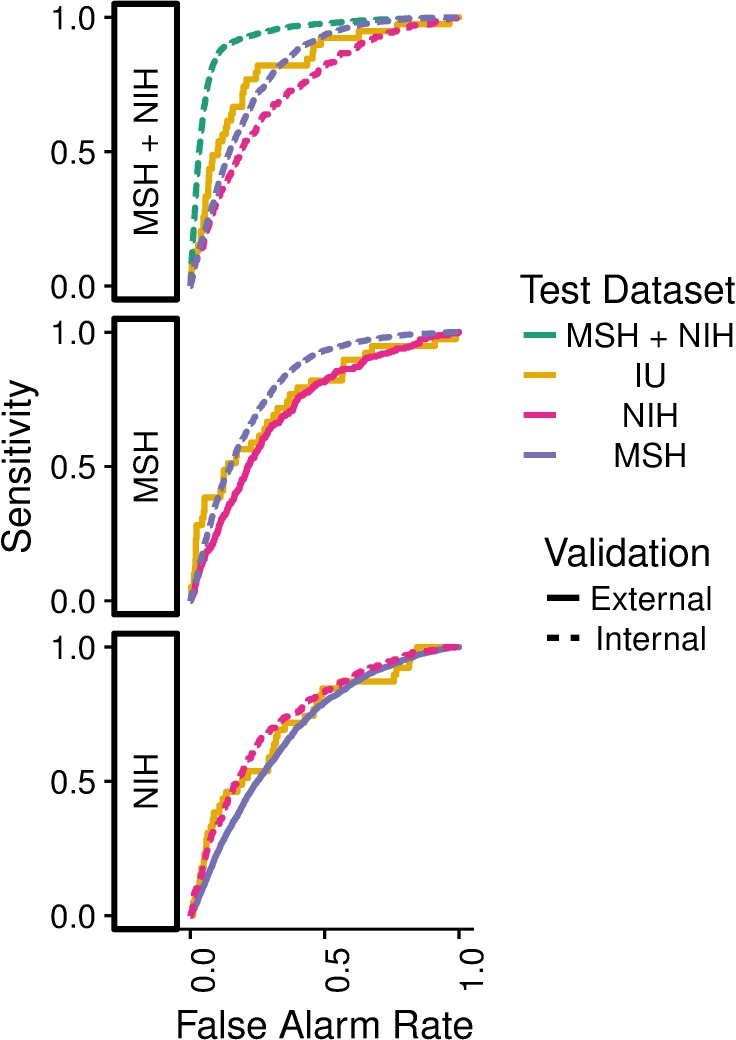
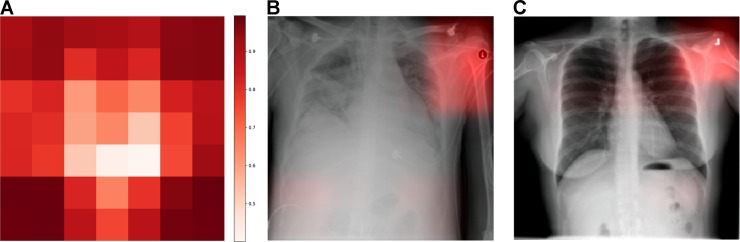
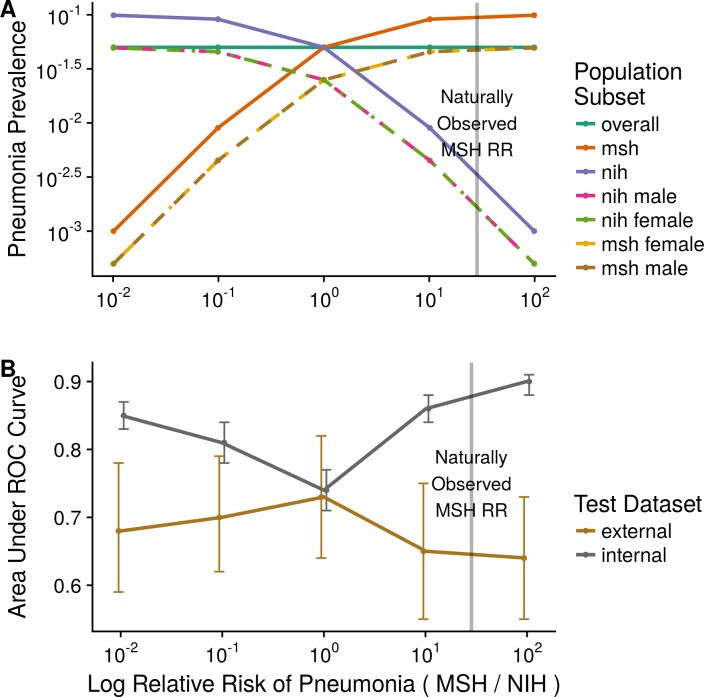
BACKGROUND: There is interest in using convolutional neural networks (CNNs) to analyze medical imaging to provide computer-aided diagnosis (CAD). Recent work has suggested that image classification CNNs may not generalize to new data as well as previously believed. We assessed how well CNNs generalized across three hospital systems for a simulated pneumonia screening task. METHODS AND FINDINGS: A cross-sectional design with multiple model training cohorts was used to evaluate model generalizability to external sites using split-sample validation. A total of 158,323 chest radiographs were drawn from three institutions: National Institutes of Health Clinical Center (NIH; 112,120 from 30,805 patients), Mount Sinai Hospital (MSH; 42,396 from 12,904 patients), and Indiana University Network for Patient Care (IU; 3,807 from 3,683 patients). These patient populations had an age mean (SD) of 46.9 years (16.6), 63.2 years (16.5), and 49.6 years (17) with a female percentage of 43.5%, 44.8%, and 57.3%, respectively. We assessed individual models using the area under the receiver operating characteristic curve (AUC) for radiographic findings consistent with pneumonia and compared performance on different test sets with DeLong's test. The prevalence of pneumonia was high enough at MSH (34.2%) relative to NIH and IU (1.2% and 1.0%) that merely sorting by hospital system achieved an AUC of 0.861 (95% CI 0.855-0.866) on the joint MSH-NIH dataset. Models trained on data from either NIH or MSH had equivalent performance on IU (P values 0.580 and 0.273, respectively) and inferior performance on data from each other relative to an internal test set (i.e., new data from within the hospital system used for training data; P values both <0.001). The highest internal performance was achieved by combining training and test data from MSH and NIH (AUC 0.931, 95% CI 0.927-0.936), but this model demonstrated significantly lower external performance at IU (AUC 0.815, 95% CI 0.745-0.885, P = 0.001). To test the effect of pooling data from sites with disparate pneumonia prevalence, we used stratified subsampling to generate MSH-NIH cohorts that only differed in disease prevalence between training data sites. When both training data sites had the same pneumonia prevalence, the model performed consistently on external IU data (P = 0.88). When a 10-fold difference in pneumonia rate was introduced between sites, internal test performance improved compared to the balanced model (10× MSH risk P < 0.001; 10× NIH P = 0.002), but this outperformance failed to generalize to IU (MSH 10× P < 0.001; NIH 10× P = 0.027). CNNs were able to directly detect hospital system of a radiograph for 99.95% NIH (22,050/22,062) and 99.98% MSH (8,386/8,388) radiographs. The primary limitation of our approach and the available public data is that we cannot fully assess what other factors might be contributing to hospital system-specific biases. CONCLUSION: Pneumonia-screening CNNs achieved better internal than external performance in 3 out of 5 natural comparisons. When models were trained on pooled data from sites with different pneumonia prevalence, they performed better on new pooled data from these sites but not on external data. CNNs robustly identified hospital system and department within a hospital, which can have large differences in disease burden and may confound predictions.
Overview
The claims and statistics of this paper haven’t been checked yet.
Free: it reads the open-access text and checks the first 5 claims that cite a source we can check. Create a free account to check every claim.
Integrity signals
Registry
Cites
Statistics
Figures
Verification
Claims the paper makes
The claims and statistics of this paper haven’t been checked yet.
Free: it reads the open-access text and checks the first 5 claims that cite a source we can check. Create a free account to check every claim.
Claims other papers make about this one
Each is checked against this paper’s own text: does it say what the citing paper says it does?
The source backs part of the claim, not all of it — or backs it for a different population, condition or comparison.
In the citing paper
“Thus, the system was able to distinguish only which machine was used for imaging and not the risk of the patients.”
From Explainability for artificial intelligence in healthcare: a multidisciplinary perspective (2020) · cites this paper as [11]
Experimental — accuracy not yet measuredThe source backs part of the claim, not all of it — or backs it for a different population, condition or comparison.
In the citing paper
“In a study training AI to diagnose pneumonia from chest X-rays, the performance on unseen data from the institution where the training data were collected was significantly higher than its performance on data collected from external hospitals [72].”
From Fairness of artificial intelligence in healthcare: review and recommendations (2024) · cites this paper as [72]
Experimental — accuracy not yet measuredThe source backs part of the claim, not all of it — or backs it for a different population, condition or comparison.
In the citing paper
“Shortcut learning, in which a model latches onto a spurious correlate (eg, the scanner used at a particular site, a hospital-specific text template) rather than the clinical signal of interest, has been repeatedly documented in medical AI and can be difficult to detect without deliberate probing.62”
From Artificial Intelligence in Oncology: Practical Applications Across Clinical Care, Scholarship, and Translation. (2026) · cites this paper as [62]
Experimental — accuracy not yet measuredThe source backs part of the claim, not all of it — or backs it for a different population, condition or comparison.
In the citing paper
“This study hypothesized that multicenter training could enhance the generalizability of AI models, which has previously been demonstrated in other medical imaging scenarios25–27.”
From Federated deep learning for detecting COVID-19 lung abnormalities in CT: a privacy-preserving multinational validation study (2021) · cites this paper as [26]
Experimental — accuracy not yet measuredThe cited source says what the claim attributes to it.
In the citing paper
“However, variations in data collection and processing can degrade model accuracy on data from new hospital deployments (Zech et al., 2018; AlBadawy et al., 2018).”
From WILDS: A Benchmark of in-the-Wild Distribution Shifts (2020) · cites this paper as Zech et al., 2018
12 more claims about this paper
Create a free account to see every claim other papers make about this one.
Self-check
Percentages, sums and reported differences re-computed from the paper’s own numbers.
The self-check needs the paper’s full text.
Citations
Cites
Deep Residual Learning for Image Recognition
He, K., Zhang, X., Ren, S., & Sun, J. (2016) · 2016 IEEE Conference on Computer Vision and Pattern Recognition (CVPR) · doi:10.1109/cvpr.2016.90 · Cited by 235,474 · cited 2×
“Many different CNN architectures have been proposed, including ResNet-50 and DenseNet-121 used in this paper, and improving the performance of these models is an active area of research [14,15].”
MethodLeCun, Y., Bengio, Y., & Hinton, G. (2015) · Nature · doi:10.1038/nature14539 · Cited by 84,126
Scikit-learn: Machine Learning in Python
Pedregosa, F., Varoquaux, G., Gramfort, A., Michel, V., Thirion, B., Grisel, O., Blondel, M., Müller, A., Nothman, J., Louppe, G., et al. (2012) · arXiv · doi:10.48550/arxiv.1201.0490 · Cited by 71,016
Gradient-based learning applied to document recognition
Lecun, Y., Bottou, L., Bengio, Y., & Haffner, P. (1998) · Proceedings of the IEEE · doi:10.1109/5.726791 · Cited by 58,805 · cited 1×
“These studies are generally performed utilizing CNN techniques that were pioneered on well characterized computer vision datasets including the ImageNet Large Scale Visual Recognition Competition (ILSVRC) and the Modified National Institute of Standards and Technology (MNIST) database of hand drawn digits [6, 7].”
MethodDensely Connected Convolutional Networks
Huang, G., Liu, Z., van der Maaten, L., & Weinberger, K. Q. (2016) · arXiv · doi:10.48550/arxiv.1608.06993 · Cited by 48,960
Densely Connected Convolutional Networks
Huang, G., Liu, Z., Van Der Maaten, L., & Weinberger, K. Q. (2017) · 2017 IEEE Conference on Computer Vision and Pattern Recognition (CVPR) · doi:10.1109/cvpr.2017.243 · Cited by 48,566
ImageNet Large Scale Visual Recognition Challenge
Russakovsky, O., Deng, J., Su, H., Krause, J., Satheesh, S., Ma, S., Huang, Z., Karpathy, A., Khosla, A., Bernstein, M., et al. (2015) · International Journal of Computer Vision · doi:10.1007/s11263-015-0816-y · Cited by 39,380 · cited 1×
“These studies are generally performed utilizing CNN techniques that were pioneered on well characterized computer vision datasets including the ImageNet Large Scale Visual Recognition Competition (ILSVRC) and the Modified National Institute of Standards and Technology (MNIST) database of hand drawn digits [6, 7].”
MethodDeLong, E. R., DeLong, D. M., & Clarke-Pearson, D. L. (1988) · Biometrics · doi:10.2307/2531595 · Cited by 22,649
pROC: an open-source package for R and S+ to analyze and compare ROC curves
Robin, X., Turck, N., Hainard, A., Tiberti, N., Lisacek, F., Sanchez, J.-C., & Müller, M. (2011) · BMC Bioinformatics · doi:10.1186/1471-2105-12-77 · Cited by 13,697
(2017) · Cited by 11,625
Research works printed but not linked: 1
- L Oakden-Rayner, 2017, Exploring the ChestXray14 dataset: problems, Exploring the ChestXray14 dataset: problems
Cited by
Rudin, C. (2019) · Nature Machine Intelligence · doi:10.1038/s42256-019-0048-x · Cited by 10,561
“[34], who noticed that their neural network was picking up on the word “portable” within an x-ray image, representing the type of x-ray equipment rather than the medical content of the image.”
BackgroundInternational evaluation of an AI system for breast cancer screening
McKinney, S. M., Sieniek, M., Godbole, V., Godwin, J., Antropova, N., Ashrafian, H., Back, T., Chesus, M., Corrado, G. S., Darzi, A., et al. (2020) · Nature · doi:10.1038/s41586-019-1799-6 · Cited by 3,287
Key challenges for delivering clinical impact with artificial intelligence
Kelly, C. J., Karthikesalingam, A., Suleyman, M., Corrado, G., & King, D. (2019) · BMC Medicine · doi:10.1186/s12916-019-1426-2 · Cited by 3,136
“Another algorithm for detection of pneumonia on chest x-rays was able to accurately identify hospital equipment and department, learning an association between a portable x-ray machine and pneumonia [75].”
BackgroundShortcut learning in deep neural networks
Geirhos, R., Jacobsen, J.-H., Michaelis, C., Zemel, R., Brendel, W., Bethge, M., & Wichmann, F. A. (2020) · Nature Machine Intelligence · doi:10.1038/s42256-020-00257-z · Cited by 2,224
Explainability for artificial intelligence in healthcare: a multidisciplinary perspective
the Precise4Q consortium, Amann, J., Blasimme, A., Vayena, E., Frey, D., & Madai, V. I. (2020) · BMC Medical Informatics and Decision Making · doi:10.1186/s12911-020-01332-6 · Cited by 2,203
Metadata
- Authors
- Zech, J. R., Badgeley, M. A., Liu, M., Costa, A. B., Titano, J. J., & Oermann, E. K.
- Affiliations
- California Pacific Medical Center (US)
- Verily Life Sciences LLC (United States) (US)
- Icahn School of Medicine at Mount Sinai (US)
- Corresponding author
- Oermann, Eric Karl
- ORCID
- Venue
- PLOS Medicine
- Publisher
- Public Library of Science (PLoS)
- Published
- 2018-11-06
- Volume
- 15
- Issue
- 11
- Pages
- e1002683
- ISSN
- 1549-1277 (ISSN-L)
- 1549-1676
- PMC
- PMC6219764
- OpenAlex
- W2811374795
- Cited by
- 1,719
- References
- 34
- Citations by year
- 2026: 412 · 2025: 212 · 2024: 186 · 2023: 190 · 2022: 206 · 2021: 236 · 2020: 173 · 2019: 90 · 2018: 12
- FWCI
- 87.44
- Type
- journal article
- Language
- en
- Open access
- gold
- doi.org
- Licence
- Locations
- PLoS Medicine (publishedVersion, cc-by)
- Europe PMC (PubMed Central) (publishedVersion, cc-by)
- PubMed Central (publishedVersion, cc-by)
- PubMed (publishedVersion)
- arXiv (Cornell University) (submittedVersion)
- DOAJ (DOAJ: Directory of Open Access Journals) (submittedVersion, cc-by-sa)
- Figshare (submittedVersion, cc-by)
- Funders
- Icahn School of Medicine at Mount Sinai
- Topics
- Health Sciences › Medicine › Radiology, Nuclear Medicine and Imaging › COVID-19 diagnosis using AI
- Health Sciences › Medicine › Radiology, Nuclear Medicine and Imaging › Radiomics and Machine Learning in Medical Imaging
- Health Sciences › Medicine › Health Informatics › Artificial Intelligence in Healthcare and Education
- Keywords
- pneumonia detection, chest radiograph, convolutional neural networks, model generalization, external validation, computer-aided diagnosis, pneumonia screening, split-sample validation, radiographic findings, deep learning for medical imaging
- MeSH terms
- Deep Learning, Adult, Aged, Cross-Sectional Studies, Diagnosis, Computer-Assisted, Female, Humans, Male, Middle Aged, Pneumonia, Predictive Value of Tests, Radiographic Image Interpretation, Computer-Assisted, Radiology Information Systems, Retrospective Studies, Radiography, Thoracic, United States, Reproducibility of Results
About these checks
Registry, retraction, Cites and statistics results are computed, not judged, with one exception: a printed reference that no index lists is read once by a model before it counts as a citation error. Claims are extracted by a model and kept only when their quote appears verbatim in the text; each cited source is then checked, with a model’s help, for whether it says what the claim relies on. Those verdicts can be wrong — read the claim’s quote and the cited source before relying on one.
Statistics and arithmetic are recomputed, not judged.
Confidence bands are shown only for fields calibrated on our annotated test set. None is calibrated yet, so no band is shown.
What counts as a claim ›How we measure confidence ›How we check this ›
Are you an author, or do you see a problem with this page? Request a review
How to cite
Cite CoChat for the checks on this page, and the paper for its own findings.
- This page
- CoChat. (2026). Citation check: Variable generalization performance of a deep learning model to detect pneumonia in chest radiographs: A cross-sectional study. https://app.cochat.ai/papers/10.1371/journal.pmed.1002683
- The paper
- Zech, J. R., Badgeley, M. A., Liu, M., Costa, A. B., Titano, J. J., & Oermann, E. K. (2018). Variable generalization performance of a deep learning model to detect pneumonia in chest radiographs: A cross-sectional study. PLOS Medicine. https://doi.org/10.1371/journal.pmed.1002683
Data sources
Bibliographic data: Semantic Scholar, OpenAlex, Crossref.
Contains information from the Semantic Scholar Academic Graph Datasets, made available under the ODC Attribution License (ODC-BY 1.0).
Semantic Scholar’s data is described in: Kinney, R., et al. (2023). The Semantic Scholar Open Data Platform. arXiv:2301.10140.
