

The DOI matches its Crossref record; 52 of the 53 references it cites were found in a registry or an index.
Sales of antibiotics and hydroxychloroquine in India during the COVID-19 epidemic: An interrupted time series analysis
Open accessAbstract
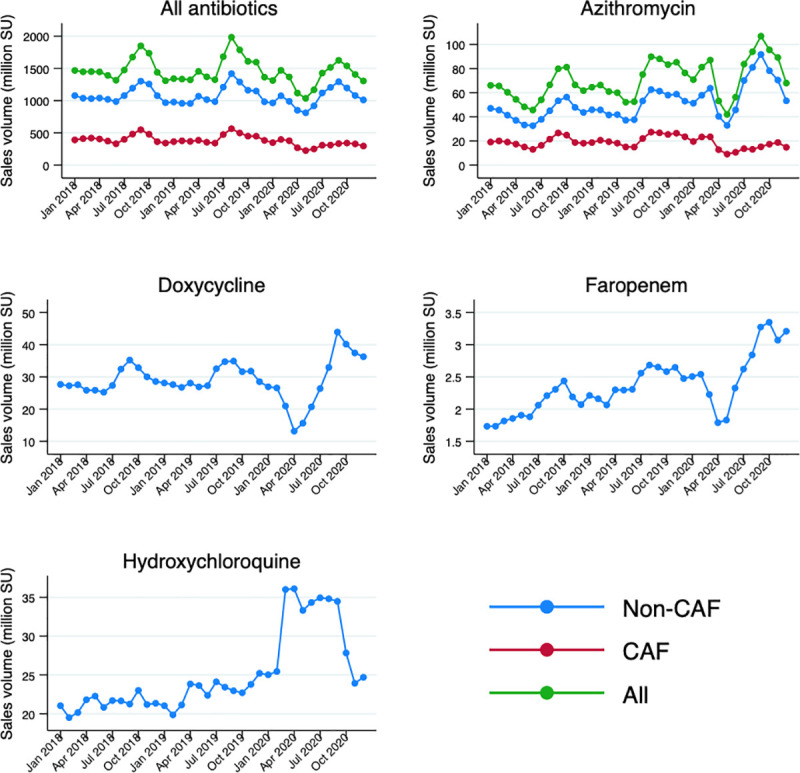
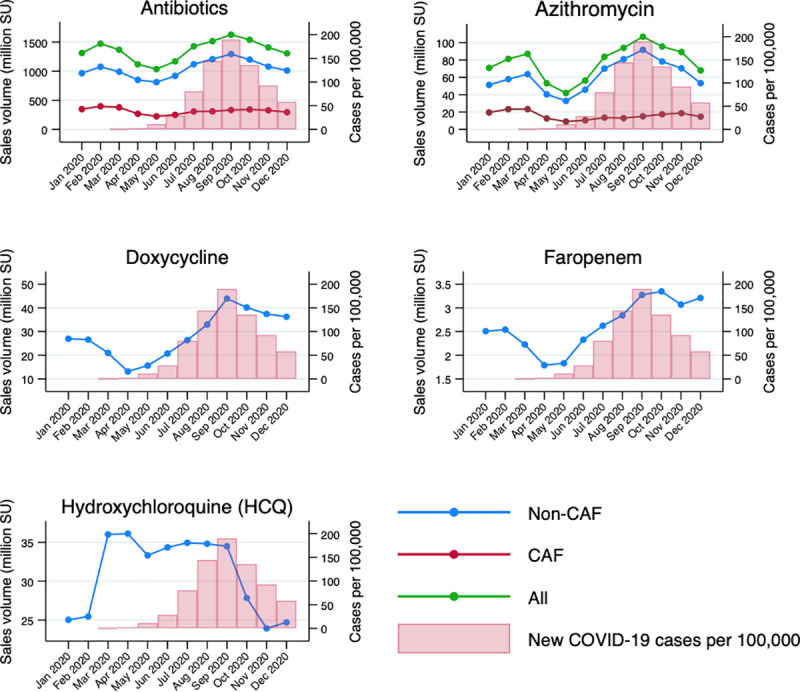
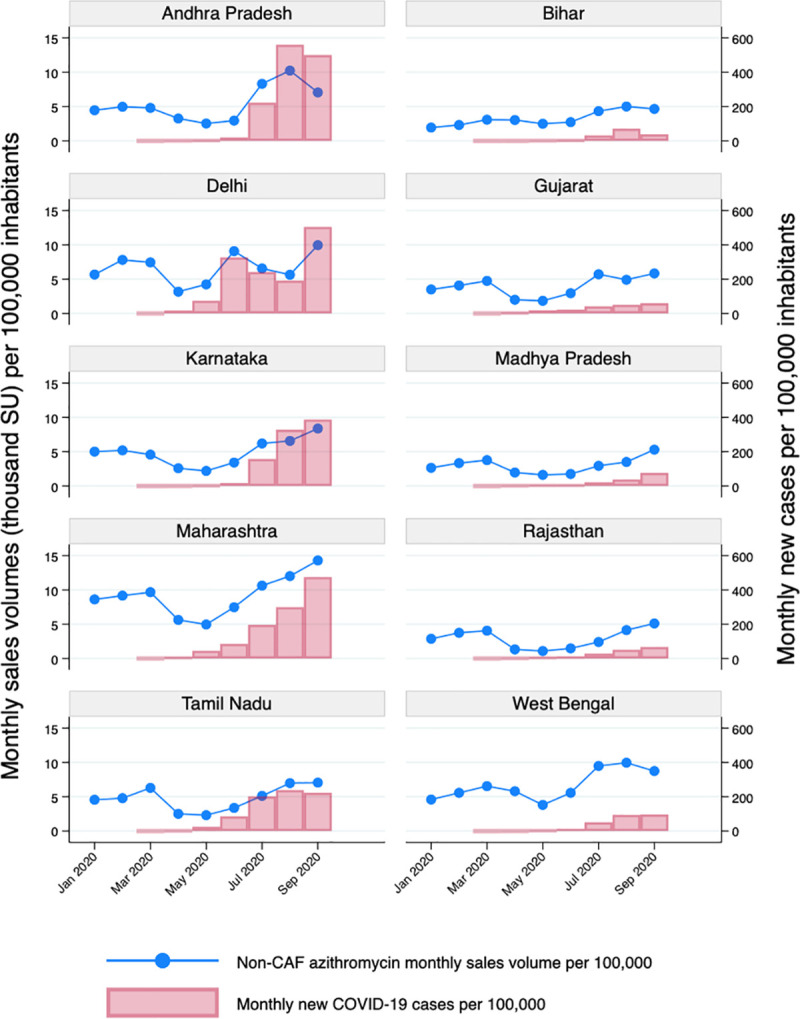
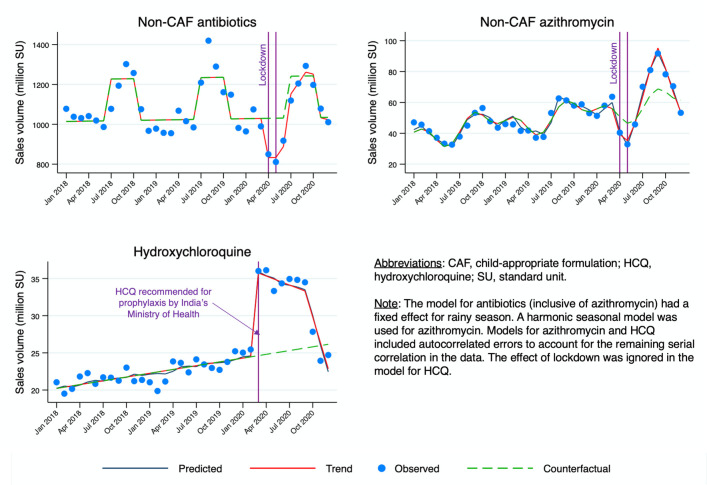
BACKGROUND: We assessed the impact of the coronavirus disease 2019 (COVID-19) epidemic in India on the consumption of antibiotics and hydroxychloroquine (HCQ) in the private sector in 2020 compared to the expected level of use had the epidemic not occurred. METHODS AND FINDINGS: We performed interrupted time series (ITS) analyses of sales volumes reported in standard units (i.e., doses), collected at regular monthly intervals from January 2018 to December 2020 and obtained from IQVIA, India. As children are less prone to develop symptomatic severe acute respiratory syndrome coronavirus 2 (SARS-CoV-2) infection, we hypothesized a predominant increase in non-child-appropriate formulation (non-CAF) sales. COVID-19-attributable changes in the level and trend of monthly sales of total antibiotics, azithromycin, and HCQ were estimated, accounting for seasonality and lockdown period where appropriate. A total of 16,290 million doses of antibiotics were sold in India in 2020, which is slightly less than the amount in 2018 and 2019. However, the proportion of non-CAF antibiotics increased from 72.5% (95% CI: 71.8% to 73.1%) in 2019 to 76.8% (95% CI: 76.2% to 77.5%) in 2020. Our ITS analyses estimated that COVID-19 likely contributed to 216.4 million (95% CI: 68.0 to 364.8 million; P = 0.008) excess doses of non-CAF antibiotics and 38.0 million (95% CI: 26.4 to 49.2 million; P < 0.001) excess doses of non-CAF azithromycin (equivalent to a minimum of 6.2 million azithromycin treatment courses) between June and September 2020, i.e., until the peak of the first epidemic wave, after which a negative change in trend was identified. In March 2020, we estimated a COVID-19-attributable change in level of +11.1 million doses (95% CI: 9.2 to 13.0 million; P < 0.001) for HCQ sales, whereas a weak negative change in monthly trend was found for this drug. Study limitations include the lack of coverage of the public healthcare sector, the inability to distinguish antibiotic and HCQ sales in inpatient versus outpatient care, and the suboptimal number of pre- and post-epidemic data points, which could have prevented an accurate adjustment for seasonal trends despite the robustness of our statistical approaches. CONCLUSIONS: A significant increase in non-CAF antibiotic sales, and particularly azithromycin, occurred during the peak phase of the first COVID-19 epidemic wave in India, indicating the need for urgent antibiotic stewardship measures.
Overview
The claims and statistics of this paper haven’t been checked yet.
Run the check — free, no account needed. It reads the open-access text and checks the sources it cites.
Integrity signals
Registry
Cites
Statistics
Figures
Verification
Claims the paper makes
The claims and statistics of this paper haven’t been checked yet.
Run the check — free, no account needed. It reads the open-access text and checks the sources it cites.
Claims other papers make about this one
Each is checked against this paper’s own text: does it say what the citing paper says it does?
The cited source says what the claim attributes to it.
In the citing paper
“Even though India is the largest antibiotic consumer in absolute volume,3 the country does not have a formal system of antibiotic use surveillance to guide an antimicrobial stewardship program akin to those found in the US and the Europe.”
From Consumption of systemic antibiotics in India in 2019 (2022) · cites this paper as [3]
The check wasn’t confident either way, so it gives no verdict — never disputed.
In the citing paper
“Even though India is the largest antibiotic consumer in absolute volume,3 the country does not have a formal system of antibiotic use surveillance to guide an antimicrobial stewardship program akin to those found in the US and the Europe.”
From Consumption of systemic antibiotics in India in 2019 (2022) · cites this paper as [3]
Experimental — accuracy not yet measured
Self-check
Percentages, sums and reported differences re-computed from the paper’s own numbers.
The self-check needs the paper’s full text.
Citations
Cites
Wang, M., Cao, R., Zhang, L., Yang, X., Liu, J., Xu, M., Shi, Z., Hú, Z., Zhong, W., & Xiao, G. (2020) · Cell Research · doi:10.1038/s41422-020-0282-0 · Cited by 6,994
Global increase and geographic convergence in antibiotic consumption between 2000 and 2015
Klein, E. Y., Van Boeckel, T. P., Martinez, E. M., Pant, S., Gandra, S., Levin, S. A., Goossens, H., & Laxminarayan, R. (2018) · Proceedings of the National Academy of Sciences · doi:10.1073/pnas.1717295115 · Cited by 3,232
Self-citationGlobal antibiotic consumption 2000 to 2010: an analysis of national pharmaceutical sales data
Boeckel, T. P. V., Gandra, S., Ashok, A., Caudron, Q., Grenfell, B. T., Levin, S. A., & Laxminarayan, R. (2014) · The Lancet Infectious Diseases · doi:10.1016/s1473-3099(14)70780-7 · Cited by 2,355
Age-dependent effects in the transmission and control of COVID-19 epidemics
Davies, N. G., Klepac, P., Liu, Y., Prem, K., Jit, M., CMMID COVID-19 working group, Pearson, C. A. B., Quilty, B. J., Kucharski, A. J., Gibbs, H. P., et al. (2020) · Nature Medicine · doi:10.1038/s41591-020-0962-9 · Cited by 1,774
Co-infections in people with COVID-19: a systematic review and meta-analysis.
Lansbury, L., Lim, B., Baskaran, V., & Lim, W. S. (2020) · Journal of Infection · doi:10.1016/j.jinf.2020.05.046 · Cited by 1,619
Langford, B. J., So, M., Raybardhan, S., Leung, V., Westwood, D. J., MacFadden, D. R., Soucy, J.-P. R., & Daneman, N. (2020) · Clinical Microbiology and Infection · doi:10.1016/j.cmi.2020.07.016 · Cited by 1,589
Effect of Hydroxychloroquine in Hospitalized Patients with Covid-19
Horby, P., Mafham, M. M., Linsell, L., Bell, J. L., Staplin, N., Emberson, J., Wiselka, M. J., Ustianowski, A., Elmahi, E., Prudon, B., et al. (2020) · New England Journal of Medicine · doi:10.1056/nejmoa2022926 · Cited by 1,481
A Randomized Trial of Hydroxychloroquine as Postexposure Prophylaxis for Covid-19
Boulware, D. R., Pullen, M. F., Bangdiwala, A. S., Pastick, K. A., Lofgren, S. M., Okafor, E. C., Skipper, C. P., Nascene, A. A., Nicol, M. R., Abassi, M., et al. (2020) · New England Journal of Medicine · doi:10.1056/nejmoa2016638 · Cited by 1,349
Devaux, C. A., Rolain, J., Colson, P., & Raoult, D. (2020) · International Journal of Antimicrobial Agents · doi:10.1016/j.ijantimicag.2020.105938 · Cited by 1,122
Mechanisms of Action and Clinical Application of Macrolides as Immunomodulatory Medications
Kanoh, S., & Rubin, B. K. (2010) · Clinical Microbiology Reviews · doi:10.1128/cmr.00078-09 · Cited by 722
Research works printed but not linked: 10
- R Nieuwlaat, 2021, COVID-19 and antimicrobial resistance: parallel and interacting health emergencies, Clin Infect Dis, 72, 1657
- Indian Council of Medical Research, 2019, Treatment guidelines for antimicrobial use in common syndromes
- Directorate of National Vector Borne Disease Control Programme, 2013, National drug policy on malaria
- World Health Organization, 2020, Clinical management of COVID-19. Interim guidance—27 May 2020
- PRS Legislative Research, 2020, COVID-19: details on cases
- National Commission on Population, 2019, Population projections for India and States, 2011–2036: report of the Technical Group on population projections
- WHO Collaborating Centre for Drug Statistics Methodology, 2021, ATC/DDD index 2021
- Centers for Disease Control and Prevention, 2020, COVID data tracker: demographic trends of COVID-19 cases and deaths in the US reported to CDC
- Directorate General of Health Services, 2020, Clinical management protocol: COVID-19
- Department of Health and Family Welfare, 2020, Notification. The Gazette of India: extraordinary
Cited by
Sorted by citations
Antimicrobial resistance in low- and middle-income countries: current status and future directions
Sulis, G., Sayood, S. J., & Gandra, S. (2021) · Expert Review of Anti-infective Therapy · doi:10.1080/14787210.2021.1951705 · Cited by 414
Nandi, A., Pecetta, S., & Bloom, D. E. (2023) · EClinicalMedicine · doi:10.1016/j.eclinm.2023.101848 · Cited by 238
Antimicrobial Resistance in Rivers: A Review of the Genes Detected and New Challenges
Grenni, P. (2022) · Environmental Toxicology and Chemistry · doi:10.1002/etc.5289 · Cited by 149
Sono, T. M., Yeika, E., Cook, A., Kalungia, A., Opanga, S. A., Acolatse, J. E. E., Sefah, I. A., Jelić, A. G., Campbell, S., Lorenzetti, G., et al. (2023) · Expert Review of Anti-infective Therapy · doi:10.1080/14787210.2023.2259106 · Cited by 95
Consumption of systemic antibiotics in India in 2019
Koya, S. F., Ganesh, S., Selvaraj, S., Wirtz, V. J., Galea, S., & Rockers, P. C. (2022) · The Lancet Regional Health - Southeast Asia · doi:10.1016/j.lansea.2022.100025 · Cited by 102
Antimicrobial consumption in patients with COVID-19: a systematic review and meta-analysis
Khan, S., Hasan, S. S., Bond, S. E., Conway, B. R., & Aldeyab, M. A. (2021) · Expert Review of Anti-infective Therapy · doi:10.1080/14787210.2022.2011719 · Cited by 90
Mucormycosis in COVID-19 pandemic: Risk factors and linkages
Kumar, M., Sarma, D. K., Shubham, S., Kumawat, M., Verma, V., Singh, B., Nagpal, R., & Tiwari, R. (2021) · Current Research in Microbial Sciences · doi:10.1016/j.crmicr.2021.100057 · Cited by 76
Antibiotic consumption in India: geographical variations and temporal changes between 2011 and 2019
Koya, S. F., Ganesh, S., Selvaraj, S., Wirtz, V. J., Galea, S., & Rockers, P. C. (2022) · JAC-Antimicrobial Resistance · doi:10.1093/jacamr/dlac112 · Cited by 65
Yazhini, C., Mathew, G., Anpo, M., Maurin, G., Choi, W., & Neppolian, B. (2023) · Advanced Optical Materials · doi:10.1002/adom.202301625 · Cited by 58
Alshammari, M. K., Ramadan, M., Haif, H., Abdullah, B., Mubarak, J., Ahmad, W., Mari, S., Hassan, S., Eid, R., Hasan, M. Y., et al. (2023) · Antibiotics · doi:10.3390/antibiotics12101504 · Cited by 59
RetractedSchellack, N., Strydom, M. A., Pepper, M. S., Herd, C. L., Hendricks, C. L., Bronkhorst, E., Meyer, J. C., Padayachee, N., Bangalee, V., Truter, I., et al. (2022) · Antibiotics · doi:10.3390/antibiotics11040445 · Cited by 52
Consumption Trends of Antibiotics in Brazil During the COVID-19 Pandemic
Fiol, F. D. S. D., Bergamaschi, C. D. C., Andrade, I. P. D., Lopes, L. C., Silva, M. T., & Barberato-Filho, S. (2022) · Frontiers in Pharmacology · doi:10.3389/fphar.2022.844818 · Cited by 57
Ogunleye, O. O., Godman, B., Fadare, J. O., Mudenda, S., Adeoti, A. O., Yinka-Ogunleye, A. F., Ogundele, S. O., Oyawole, M. R., Schönfeldt, M., Rashed, W. M., et al. (2022) · Vaccines · doi:10.3390/vaccines10091553 · Cited by 51
Daria, S., & Islam, M. R. (2022) · Clinical Pathology · doi:10.1177/2632010x221099889 · Cited by 49
Saleem, Z., Moore, C. E., Kalungia, A. C., Schellack, N., Ogunleye, O. O., Chigome, A., Chowdhury, K., Kitutu, F. E., Massele, A. Y., Ramdas, N., et al. (2025) · JAC-Antimicrobial Resistance · doi:10.1093/jacamr/dlaf033 · Cited by 57
Saleem, Z., Mekonnen, B. A., Orubu, E. S. F., Islam, M. A., Phuong, T. N. T., Ubaka, C. M., Buma, D. C., Do, N. T. T., Sant, Y., Sono, T. M., et al. (2025) · Expert Review of Anti-infective Therapy · doi:10.1080/14787210.2025.2477198 · Cited by 45
Das, M. K., Das, S., & Srivastava, P. K. (2023) · Environmental Monitoring and Assessment · doi:10.1007/s10661-023-11569-z · Cited by 34
Seneghini, M., Rüfenacht, S., Flury, B. B., Flury, D., Schlegel, M., Kuster, S. P., & Kohler, P. P. (2022) · Antimicrobial Stewardship & Healthcare Epidemiology · doi:10.1017/ash.2022.10 · Cited by 31
Phage therapy in the Covid-19 era: Advantages over antibiotics
Khan, A., Rao, T. S., & Joshi, H. (2022) · Current Research in Microbial Sciences · doi:10.1016/j.crmicr.2022.100115 · Cited by 34
Selvarajan, R., Sibanda, T., Pandian, J., & Mearns, K. (2021) · Antibiotics · doi:10.3390/antibiotics10091059 · Cited by 31
Mucormycosis in COVID-19 patients: predisposing factors, prevention and management
Rudrabhatla, P. K., Reghukumar, A., & Thomas, S. V. (2021) · Acta Neurologica Belgica · doi:10.1007/s13760-021-01840-w · Cited by 29
Azithromycin Misuse During the COVID-19 Pandemic: A Cross-Sectional Study from Jordan
Abdelmalek, S. M. A., & Mousa, A. (2022) · Infection and Drug Resistance · doi:10.2147/idr.s351827 · Cited by 25
From hydroxychloroquine to ivermectin: how unproven “cures” can go viral
Taccone, F. S., Hites, M., & Dauby, N. (2022) · Clinical Microbiology and Infection · doi:10.1016/j.cmi.2022.01.008 · Cited by 24
Antimicrobial Resistance: The 'Other' Pandemic!
Singhal, T. (2022) · The Indian Journal of Pediatrics · doi:10.1007/s12098-021-04008-9 · Cited by 23
Gandra, S., Takahashi, S., Mitrani-Gold, F. S., Mulgirigama, A., & Ferrinho, D. (2022) · JAC-Antimicrobial Resistance · doi:10.1093/jacamr/dlac125 · Cited by 20
Epidemiology of COVID-19–Associated Mucormycosis
Tayabali, K., Pothiwalla, H., & Narayanan, S. (2023) · Current Fungal Infection Reports · doi:10.1007/s12281-023-00464-2 · Cited by 21
How can we tackle the overuse of antibiotics in low- and middle-income countries?
Sulis, G., Sayood, S. J., & Gandra, S. (2023) · Expert Review of Anti-infective Therapy · doi:10.1080/14787210.2023.2263643 · Cited by 24
Gnegel, G., Häfele-Abah, C., Neci, R., Difäm-EPN Minilab Network, Alladjaba, M., Lächele, M., Grace, N., Djekadoum, N., Gounouman, J. B., Mpawenimana, S., et al. (2022) · Scientific Reports · doi:10.1038/s41598-022-17123-0 · Cited by 19
India’s ban on antimicrobial fixed-dose combinations: winning the battle, losing the war?
Sulis, G., Pradhan, R., Kotwani, A., & Gandra, S. (2022) · Journal of Pharmaceutical Policy and Practice · doi:10.1186/s40545-022-00428-w · Cited by 19
You, X., You, M., Lyu, Y., Peng, G., & Sun, W. (2022) · Environmental Science Nano · doi:10.1039/d2en00204c · Cited by 18
Singh, R., & Kumari, A. (2021) · ACS Infectious Diseases · doi:10.1021/acsinfecdis.1c00371 · Cited by 17
Diagnostic tests to mitigate the antimicrobial resistance pandemic—Still the problem child
Ferreyra, C., Gleeson, B. M., Kapona, O., & Mendelson, M. (2022) · PLOS Global Public Health · doi:10.1371/journal.pgph.0000710 · Cited by 15
Mustafa, Z. U., Iqbal, S., Asif, H. R., Salman, M., Jabbar, S., Mallhi, T. H., Khan, Y. H., Sono, T. M., Schellack, N., Meyer, J. C., et al. (2023) · Antibiotics · doi:10.3390/antibiotics12030481 · Cited by 24
Baranova, M. N., Babikova, P. A., Kudzhaev, A. M., Mokrushina, Y. A., Belozerova, O. A., Yunin, M. A., Kovalchuk, S. I., Gabibov, A. G., Smirnov, I. V., & Terekhov, S. S. (2021) · Antibiotics · doi:10.3390/antibiotics10101161 · Cited by 16
Kalita, A., Bose, B., Woskie, L., Haakenstad, A., Cooper, J. E., & Yip, W. (2023) · BMJ Global Health · doi:10.1136/bmjgh-2022-008903 · Cited by 19
Malaria Epidemiology and COVID-19 Pandemic: Are They Interrelated?
Prabhu, S. R., Ware, A. P., Saadi, A. V., Brand, A. M., Ghosh, S. K., Kamath, A., & Satyamoorthy, K. (2022) · OMICS A Journal of Integrative Biology · doi:10.1089/omi.2021.0227 · Cited by 14
Khosla, R., Jha, A., Dua, S., Varmani, S. G., Rajput, N., & Pani, B. (2022) · Frontiers in Environmental Science · doi:10.3389/fenvs.2022.1022098 · Cited by 14
Hoxha, I., Godman, B., Malaj, A., & Meyer, J. C. (2023) · Antibiotics · doi:10.3390/antibiotics12050882 · Cited by 16
Gandra, S., Alvarez‐Uria, G., Stwalley, D. L., Nickel, K. B., Reske, K. A., Kwon, J. H., Dubberke, E. R., Olsen, M. A. A., & Burnham, J. P. (2023) · Antibiotics · doi:10.3390/antibiotics12030537 · Cited by 14
Menon, N. D., Somanath, P., Jossart, J. N., Vijayakumar, G., Shetty, K., Baswe, M., Chatterjee, M., Hari, M. B., Nair, S., Kumar, A., et al. (2023) · JAC-Antimicrobial Resistance · doi:10.1093/jacamr/dlae001 · Cited by 13
Antimicrobial resistance surge in the context of pollution, war, and pandemic
Silori, R., Shrivastava, V., Mazumder, P., & Kumar, M. (2023) · Current Opinion in Environmental Science & Health · doi:10.1016/j.coesh.2023.100479 · Cited by 12
Hosseini, M., Hamad, M. A., Mohseni, G., Salamy, S., Tarzjani, S. D., & Moghadam, M. T. (2023) · Journal of Clinical Laboratory Analysis · doi:10.1002/jcla.24959 · Cited by 12
Antimicrobial Dispensing Practice in Community Pharmacies in Russia during the COVID-19 Pandemic
Rachina, S. A., Kozlov, R. S., Kurkova, A. A., Семеновна, П. У., Palyutin, S., Хохлов, А. Л., Reshetko, O. V., Zhuravleva, M. V., Palagin, I. S., & on behalf of Russian Working Group of the Project (2022) · Antibiotics · doi:10.3390/antibiotics11050586 · Cited by 13
Increased antimicrobial resistance against azithromycin during COVID: role of irrational utilization
Tanwir, S., Sabah, A., Khatoon, A., & Afridi, F. I. (2024) · Journal of the Pakistan Medical Association · doi:10.47391/jpma.8446 · Cited by 11
Environmental aspects of antimicrobial resistance in India: Current progress & way forward
Bhatia, R. (2024) · International Journal of Microbiology Research · doi:10.4103/ijmr.ijmr_2104_23 · Cited by 13
Baruah, J., Singh, L. S., Salvia, T., & Sarma, J. (2024) · Journal of Laboratory Physicians · doi:10.25259/jlp_24_2024 · Cited by 13
Kassym, L., Kussainova, A., Semenov, D., Aimurziyeva, A., Uzbekova, S., & Semenova, Y. M. (2025) · Scientific Reports · doi:10.1038/s41598-025-91216-4 · Cited by 11
Kiragga, A. N., Najjemba, L., Galiwango, R. M., Banturaki, G., Munyiwra, G., Iwumbwe, I., Atwine, J., Ssendiwala, C., Natif, A., & Nakanjako, D. (2023) · PLOS Global Public Health · doi:10.1371/journal.pgph.0001579 · Cited by 11
Life-course inequalities in intrinsic capacity and healthy ageing, China
Chen, J., Xie, Y., Sun, Y., Zang, R., Sun, Y., Dan, L., Wang, X., & Hesketh, T. M. (2023) · Bulletin of the World Health Organization · doi:10.2471/blt.22.289435 · Cited by 10
Vâţă, A., Roşu, F. M., Dorneanu, O., Lehaci, A. E., Avadanei-Luca, S., Loghin, I. I., Miftode, D., Luca, C. M., & Miftode, E. G. (2023) · Medicina · doi:10.3390/medicina59040645 · Cited by 11
de Andrade, H. N., de Oliveira, J. F., Siniscalchi, L. A. B., da Costa, J. D., & Fia, R. (2024) · The Science of The Total Environment · doi:10.1016/j.scitotenv.2024.171075 · Cited by 10
Multidrug-Resistant Infections in the Developing World
Singh, P., & Holmen, J. (2021) · Pediatric Clinics of North America · doi:10.1016/j.pcl.2021.09.003 · Cited by 10
Mashuri, Y. A., Wulandari, L. P. L., Khan, M. S., Ferdiana, A., Probandari, A. N., Wibawa, T., Batura, N., Liverani, M., Day, R. O., Jan, S., et al. (2022) · The Lancet Regional Health - Western Pacific · doi:10.1016/j.lanwpc.2022.100420 · Cited by 10
Domingues, M., Torre, C., Guerreiro, J., Barata, P., Correia‐Neves, M., Rocha, J. P., Sepodes, B. M. N., & Rodrigues, A. T. (2023) · International Journal for Quality in Health Care · doi:10.1093/intqhc/mzad014 · Cited by 9
Amato, H. K., Loayza, F., Salinas, L., Paredes, D., García, D., Sarzosa, S., Saraiva-Garcia, C., Johnson, T. J., Pickering, A. J., Riley, L. W., et al. (2023) · Scientific Reports · doi:10.1038/s41598-023-39532-5 · Cited by 9
Svadzian, A., Daniels, B., Sulis, G., Das, J., Daftary, A., Kwan, A. T., Das, V., Das, R., & Pai, M. (2022) · The Lancet Regional Health - Southeast Asia · doi:10.1016/j.lansea.2023.100152 · Cited by 10
Dental antibiotic policies, stewardship, and implementation in India: A policy document analysis
Bhuvaraghan, A., King, R., Walley, J. D., Thiruvenkatachari, B., & Aggarwal, V. R. (2024) · Community Dentistry And Oral Epidemiology · doi:10.1111/cdoe.12989 · Cited by 8
Sahai, N., Jacob, J. J., Arunachalam, D. K., Das, B. K., Kapil, A., Pandey, S., Dutta, S., Chakraborty, D., Gupta, A. S., Gupta, M., et al. (2025) · Scientific Reports · doi:10.1038/s41598-025-93170-7 · Cited by 12
Mucormycosis and Its Upsurge During COVID-19 Epidemic: An Updated Review
Sharma, B., & Nonzom, S. (2023) · Current Microbiology · doi:10.1007/s00284-023-03430-w · Cited by 7
Antibiotic Prescription Patterns for Endodontic Procedures in India: A KAP Survey
Vengidesh, R., Kadandale, S., Ramachandran, A., Srinivasan, S., Parthasarathy, R., Thanikachalam, Y., & Kumar, P. (2023) · Cureus · doi:10.7759/cureus.37804 · Cited by 7
Azithromycin in the Sabarmati River as an indicator of aquatic environment contamination
Kalugendo, E., Singh, P. K., & Agarwal, R. (2025) · Sustainable Chemistry One World · doi:10.1016/j.scowo.2025.100106 · Cited by 6
Antibiotic prescribing trends in the US during the first 11 months of the COVID-19 pandemic
Desai, K. R., Arora, P., Ghanekar, S., Johnson, K. E., & Harris, I. (2022) · Research in Social and Administrative Pharmacy · doi:10.1016/j.sapharm.2022.05.008 · Cited by 6
Khan, S., Bond, S. E., Lee-Milner, J., Conway, B. R., Lattyak, W. J., & Aldeyab, M. A. (2023) · JAC-Antimicrobial Resistance · doi:10.1093/jacamr/dlae013 · Cited by 6
Sulis, G., Pai, M., & Gandra, S. (2022) · Journal of Antimicrobial Chemotherapy · doi:10.1093/jac/dkac180 · Cited by 6
A Silent Pandemic of Antimicrobial Resistance: Challenges and Strategy for Preparedness in India
Gupta, Y. K., & Srinivasan, S. (2022) · Annals of the National Academy of Medical Sciences (India) · doi:10.1055/s-0042-1756285 · Cited by 5
Haseeb, A., Abuhussain, S. S. A., Alghamdi, S., Bahshwan, S. M., Mahrous, A. J., Alzahrani, Y. A., Alzahrani, A. F., AlQarni, A., Algethamy, M., Naji, A. S., et al. (2023) · Antibiotics · doi:10.3390/antibiotics12111609 · Cited by 5
Ho, M. K. H., Tadrous, M., Iacono, A., Suda, K. J., & Gomes, T. (2022) · Journal of Antimicrobial Chemotherapy · doi:10.1093/jac/dkac382 · Cited by 6
Mittal, N., Tayal, A., Kumar, S., Dhawan, R., Goel, N., & Mittal, R. (2024) · Antibiotics · doi:10.3390/antibiotics13070673 · Cited by 7
Yulia, R., Ikasanti, P. A. I., Herawati, F., Hartono, R., Hanum, P. S., Lestiono, Ramdani, D., Jaelani, A. K., Kantono, K., & Wijono, H. (2022) · Pathophysiology · doi:10.3390/pathophysiology29010009 · Cited by 4
Determinants and consequences of sales/production report issuance
Fu, R., Ma, C., Zeng, Y., & Zhang, J. (2023) · The British Accounting Review · doi:10.1016/j.bar.2023.101266 · Cited by 4
Mapping the spread and mobility of antibiotic resistance in wastewater due to COVID-19 surge
Bombaywala, S., & Dafale, N. A. (2023) · Environmental Science and Pollution Research · doi:10.1007/s11356-023-30932-8 · Cited by 4
Alagha, H. Z. (2023) · Bulletin of Pharmaceutical Sciences Assiut · doi:10.21608/bfsa.2023.301131 · Cited by 4
Ortiz‐Prado, E., Izquierdo‐Condoy, J. S., Mora, C., Vásconez-González, J., & Fernández-Naranjo, R. (2023) · Research in Social and Administrative Pharmacy · doi:10.1016/j.sapharm.2023.08.011 · Cited by 6
Debnath, P., Alam, M., Khandait, M., Husain, F. M., Munawar, N., & Mondal, A. H. (2025) · Frontiers in Microbiology · doi:10.3389/fmicb.2025.1585526 · Cited by 3
Luo, C., & Chen, Q. (2024) · Microbial Drug Resistance · doi:10.1089/mdr.2024.0136 · Cited by 3
Pandemic panic and indiscriminate prescriptions drive India’s antimicrobial resistance
Thiagarajan, K. (2022) · BMJ · doi:10.1136/bmj.o596 · Cited by 3
Titanji, B. K., & Pai, M. (2023) · The Lancet Infectious Diseases · doi:10.1016/s1473-3099(23)00354-7 · Cited by 3
Patterns of antimicrobial dispensing in community pharmacies in Russia during the COVID-19 pandemic
Kurkova, A. A., Rachina, S. A., Kozlov, R. S., Portnyagina, U. S., Палютин, Ш. Х., Reshetko, O. V., Zhuravleva, M. V., Karpova, O. Y., Myagkova, O. G., Kuznetsova, E. V., et al. (2023) · Clinical Microbiology and Antimicrobial Chemotherapy · doi:10.36488/cmac.2023.1.84-92 · Cited by 4
Yazhini, C., Siddharthan, E. E., Thapa, R., & Neppolian, B. (2024) · Chemosphere · doi:10.1016/j.chemosphere.2024.141247 · Cited by 3
Balushi, H. A., Kurdi, A. B., Almutairi, N., Baker, K., M-Amen, K., Karwi, H., Seaton, A., & Godman, B. (2024) · Expert Review of Anti-infective Therapy · doi:10.1080/14787210.2024.2363485 · Cited by 3
Potential ways to address antimicrobial resistance across India and wider exacerbated by COVID-19
Haque, M., Meyer, J. C., & Godman, B. (2021) · Journal of Applied Pharmaceutical Science · doi:10.7324/japs.2021.11010ed · Cited by 3
Gupta, H. K. (2022) · Journal of Family Medicine and Primary Care · doi:10.4103/jfmpc.jfmpc_49_22 · Cited by 3
Addressing Antimicrobial Resistance in India: A 2 Stewardship Roadmap
Hegde, M., Raj, S., Tikadar, D., & Nyamagoud, S. B. (2024) · Journal of Health Science and Medical Research · doi:10.31584/jhsmr.20241071 · Cited by 2
Goel, R., Bhattacharjee, A., Sidana, N., Singh, T., & Kaur, M. (2025) · Journal of Applied Economics · doi:10.1080/15140326.2025.2472584 · Cited by 2
The impact of the COVID-19 pandemic on the antibiotic consumption and resistance in Montenegro
Mijović, G., Raičević, M., Lopičić, M., Marković, S., & Jakšić, M. (2025) · European Journal of Public Health · doi:10.1093/eurpub/ckaf167 · Cited by 2
Increase in veterinary prescriptions of azithromycin during the COVID-19 pandemic in Brazil
Fiol, F. D. S. D., Bergamaschi, C. D. C., Andrade, I. P. D., Silva, M. T., Barberato-Filho, S., Belline, B. G., Nakaghi, A. C. H., & Lopes, L. C. (2023) · The Journal of Infection in Developing Countries · doi:10.3855/jidc.17597 · Cited by 2
Alabdullatif, M. (2024) · Journal of Pure and Applied Microbiology · doi:10.22207/jpam.18.4.12 · Cited by 2
Wahlang, J. B., Syiem, R. P., Sarkar, C., Lyngdoh, N. M., Tiewsoh, I., Brahma, D. K., Surong, A., & Langstieh, A. J. (2024) · Journal of Family Medicine and Primary Care · doi:10.4103/jfmpc.jfmpc_952_24 · Cited by 4
Yavuz, T., Clezy, K. R., Skender, K., Goldberg, J., & Vallières, F. (2024) · Infection Prevention in Practice · doi:10.1016/j.infpip.2024.100385 · Cited by 2
Garapati, P., Kumar, M., Dhingra, S., Kumar, N., Ravichandiran, V., & Murti, K. (2024) · Clinical Epidemiology and Global Health · doi:10.1016/j.cegh.2024.101592 · Cited by 1
Ghosh, H., & Gupta, K. (2024) · International Journal of Medical Students · doi:10.5195/ijms.2024.1885 · Cited by 1
Bansal, A., Gupta, M., Shafiq, N., Saroch, A., Muralidharan, J., Arora, N., Kumar, M., & Trikha, S. (2025) · The Indian Journal of Medical Research · doi:10.25259/ijmr_1146_2025 · Cited by 2
Impact of COVID-19 on antibiotic prescriptions for Brazilian children
Fiol, F. D. S. D., & Andrade, I. P. D. (2022) · Scientific Reports · doi:10.1038/s41598-022-27212-9 · Cited by 1
Sample Size Estimation for a Non-inferiority Pain Management Trial
Tripathi, A. P., & Shanker, R. (2023) · The Open Pain Journal · doi:10.2174/18763863-v16-e230202-2022-6 · Cited by 1
Ghosh, H., & Gupta, K. (2023) · International Journal of Medical Students · doi:10.5195/ijms.2023.2345 · Cited by 1
Antibiotics on the rise: Google trends as a monitoring tool in India
Somagutta, M. K. R., Pormento, M. K. L., Hange, N., Iloeje, O. J., Jain, M. S., Ghazarian, K., Sasidharan, N., Sajjanagandla, G., Mahadevaiah, A., Mahmutaj, G., et al. (2021) · International Journal of Community Medicine and Public Health · doi:10.18203/2394-6040.ijcmph20214810 · Cited by 1
Impact Of COVID-19 Pandemic On The Pattern Of Azithromycin Prescribing; A Review
Dar-Odeh, N. S., Abu-Hammad, O. A., Althagafi, N. M., Abu‐Hammad, S., Eshky, R. T., Abdouh, I. M., Aboelnagga, M. M., & Abu-Hammad, A. (2022) · The International Arabic Journal of Antimicrobial Agents · doi:10.3823/866 · Cited by 1
Controversial Use of Antibiotics in Patient with Sars-Cov-2
Pediatrician Specialized in Pediatric Infectology, U. D. B. A., & Lobo, C. M. V. (2021) · International Journal of Pharmaceutical and Bio-Medical Science · doi:10.47191/ijpbms/v1-i6-02
Sankar, K. (2021) · INTERNATIONAL JOURNAL OF SCIENTIFIC RESEARCH · doi:10.36106/ijsr/0707583
Innovations in Ambulatory Stewardship
Chang, M. H., Bao, H., Cowman, K., Golia, A., Guo, Y. M., & Nori, P. (2022) · Springer eBooks · doi:10.1007/978-3-030-98427-4_33
Metadata
- Authors
- Sulis, G., Batomen, B., Kotwani, A., Pai, M., & Gandra, S.
- Affiliations
- McGill University (CA)
- University of Toronto (CA)
- University of Delhi (IN)
- Washington University in St. Louis (US)
- Corresponding author
- Gandra, Sumanth
- Venue
- PLoS Medicine
- Publisher
- Public Library of Science (PLoS)
- Published
- 2021-07-01
- Volume
- 18
- Issue
- 7
- Pages
- e1003682
- ISSN
- 1549-1277 (ISSN-L)
- 1549-1676
- PMC
- PMC8248656
- OpenAlex
- W3175638899
- Cited by
- 117
- References
- 53
- Citations by year
- 2026: 5 · 2025: 11 · 2024: 15 · 2023: 37 · 2022: 37 · 2021: 12
- FWCI
- 14.63
- Type
- journal article
- Language
- en
- Open access
- gold
- doi.org
- Licence
- Locations
- PLoS Medicine (publishedVersion, cc-by)
- PubMed Central (publishedVersion, cc-by)
- PubMed (publishedVersion)
- RePEc: Research Papers in Economics (submittedVersion)
- DOAJ (DOAJ: Directory of Open Access Journals) (submittedVersion, cc-by-sa)
- Funders
- Imperial College London
- University of California, San Francisco
- School of Public Health, Imperial College London
- School of Medicine, University of California, San Francisco
- Topics
- Health Sciences › Medicine › Infectious Diseases › Antibiotic Use and Resistance
- Health Sciences › Medicine › Oncology › COVID-19 and healthcare impacts
- Health Sciences › Medicine › Infectious Diseases › COVID-19 Clinical Research Studies
- Keywords
- COVID-19 pandemic, antibiotic sales, hydroxychloroquine, azithromycin, India, lockdown, inappropriate antibiotic use, SARS-CoV-2
- MeSH terms
- COVID-19, SARS-CoV-2, COVID-19 Drug Treatment, Anti-Bacterial Agents, Commerce, Drug Compounding, Drug Utilization, Humans, Hydroxychloroquine, India, Pandemics, Interrupted Time Series Analysis
About these checks
Registry, retraction, Cites and statistics results are computed, not judged, with one exception: a printed reference that no index lists is read once by a model before it counts as a citation error. Claims are extracted by a model and kept only when their quote appears verbatim in the text; each cited source is then checked, with a model’s help, for whether it says what the claim relies on. Those verdicts can be wrong — read the claim’s quote and the cited source before relying on one.
Statistics and arithmetic are recomputed, not judged.
Confidence bands are shown only for fields calibrated on our annotated test set. None is calibrated yet, so no band is shown.
What counts as a claim ›How we measure confidence ›How we check this ›
Are you an author, or do you see a problem with this page? Request a review
