

The DOI matches its Crossref record; 39 of the 39 references it cites were found in a registry or an index.
In Vivo Hippocampal Measurement and Memory: A Comparison of Manual Tracing and Automated Segmentation in a Large Community-Based Sample
Open accessAbstract
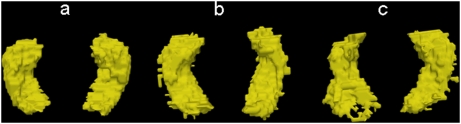
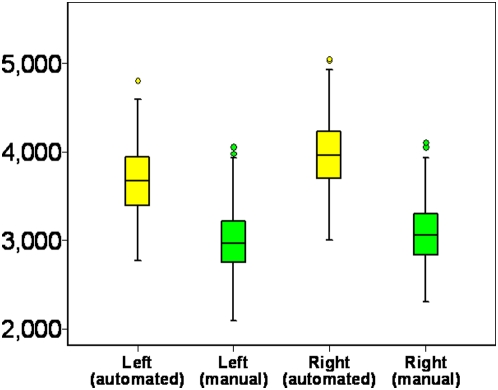
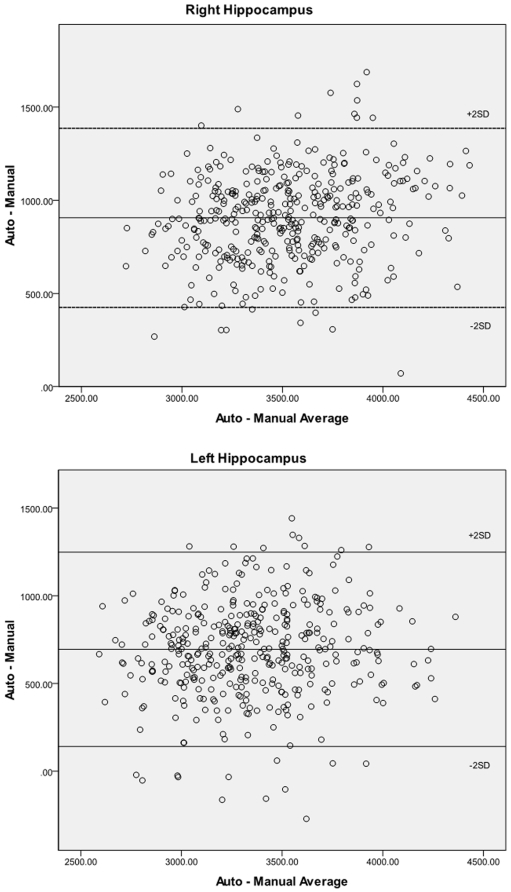
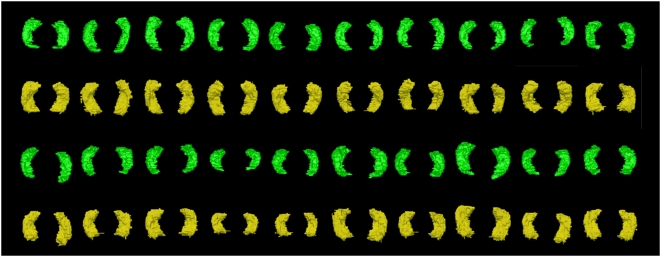
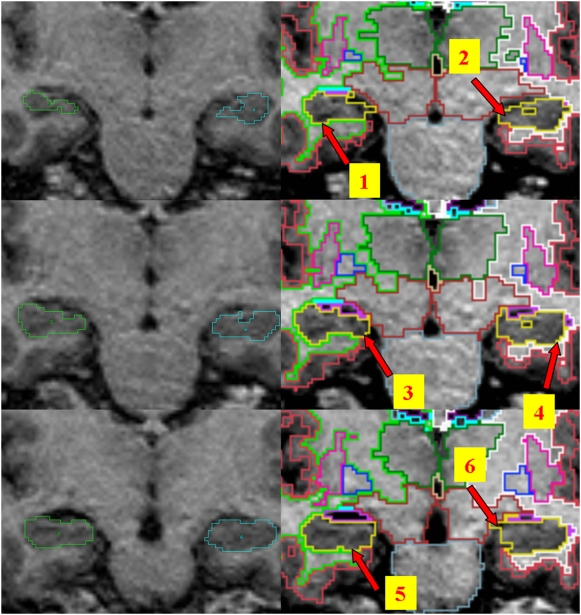
While manual tracing is the method of choice in measuring hippocampal volume, its time intensive nature and proneness to human error make automated methods attractive, especially when applied to large samples. Few studies have systematically compared the performance of the two techniques. In this study, we measured hippocampal volumes in a large (N = 403) population-based sample of individuals aged 44-48 years using manual tracing by a trained researcher and automated procedure using Freesurfer (http://surfer.nmr.mgh.harvard.edu) imaging suite. Results showed that absolute hippocampal volumes assessed with these methods were significantly different, with automated measures using the Freesurfer software suite being significantly larger, by 23% for the left and 29% for the right hippocampus. The correlation between the two methods varied from 0.61 to 0.80, with lower correlations for hippocampi with visible abnormalities. Inspection of 2D and 3D models suggested that this difference was largely due to greater inclusion of boundary voxels by the automated method and variations in subiculum/entorhinal segmentation. The correlation between left and right hippocampal volumes was very similar by the two methods. The relationship of hippocampal volumes to selected sociodemographic and cognitive variables was not affected by the measurement method, with each measure showing an association with memory performance and suggesting that both were equally valid for this purpose. This study supports the use of automated measures, based on Freesurfer in this instance, as being sufficiently reliable and valid particularly in the context of larger sample sizes when the research question does not rely on 'true' hippocampal volumes.
Overview
The claims and statistics of this paper haven’t been checked yet.
Run the check — free, no account needed. It reads the open-access text and checks the sources it cites.
Integrity signals
Registry
Cites
Statistics
Figures
Verification
Claims the paper makes
The claims and statistics of this paper haven’t been checked yet.
Run the check — free, no account needed. It reads the open-access text and checks the sources it cites.
Claims other papers make about this one
Each is checked against this paper’s own text: does it say what the citing paper says it does?
The source backs part of the claim, not all of it — or backs it for a different population, condition or comparison.
In the citing paper
“Although Freesurfer is extensively validated and it has been used in a large number of studies, various studies have also reported high rates of failures resulting in exclusion of large number of scans, inconsistencies in segmentations and age related bias (Wenger et al., 2014; Cherbuin et al., 2009).”
From A comparison of Freesurfer and multi-atlas MUSE for brain anatomy segmentation: Findings about size and age bias, and inter-scanner stability in multi-site aging studies (2020) · cites this paper as Cherbuin et al., 2009
Experimental — accuracy not yet measured
Self-check
Percentages, sums and reported differences re-computed from the paper’s own numbers.
The self-check needs the paper’s full text.
Citations
Cites
Neuropathological stageing of Alzheimer-related changes.
Braak, H., & Braak, E. (1991) · Acta Neuropathologica · doi:10.1007/bf00308809 · Cited by 16,123
Fischl, B., Salat, D. H., Busa, E., Albert, M., Dieterich, M., Haselgrove, C., van der Kouwe, A., Killiany, R., Kennedy, D., Klaveness, S., et al. (2002) · Neuron · doi:10.1016/s0896-6273(02)00569-x · Cited by 8,610
Navigation-related structural change in the hippocampi of taxi drivers
Maguire, E. A., Gadian, D. G., Johnsrude, I. S., Good, C. D., Ashburner, J., Frackowiak, R. S. J., & Frith, C. D. (2000) · Proceedings of the National Academy of Sciences · doi:10.1073/pnas.070039597 · Cited by 3,225
Braak, H., Alafuzoff, I., Arzberger, T., Kretzschmar, H., & Del Tredici, K. (2006) · Acta Neuropathologica · doi:10.1007/s00401-006-0127-z · Cited by 3,172
The human hippocampus and spatial and episodic memory
Burgess, N., Maguire, E. A., & O'Keefe, J. (2002) · Neuron · doi:10.1016/s0896-6273(02)00830-9 · Cited by 2,401
A hybrid approach to the skull stripping problem in MRI
Ségonne, F., Dale, A. M., Busa, E., Glessner, M., Salat, D. H., Hahn, H., & Fischl, B. R. (2004) · NeuroImage · doi:10.1016/j.neuroimage.2004.03.032 · Cited by 2,227
Sequence-independent segmentation of magnetic resonance images
Fischl, B. R., Salat, D. H., van der Kouwe, A. J. W., Makris, N., Ségonne, F., Quinn, B. T., & Dale, A. M. (2004) · NeuroImage · doi:10.1016/j.neuroimage.2004.07.016 · Cited by 2,117
California Verbal Learning Test
Delis, D. C., Freeland, J., Kramer, J. H., & Kaplan, E. (1987) · PsycTESTS Dataset · doi:10.1037/t48844-000 · Cited by 1,450
Morris, R., Schenk, F., Tweedie, F., & Jarrard, L. E. (1990) · European Journal of Neuroscience · doi:10.1111/j.1460-9568.1990.tb00014.x · Cited by 666
Memory and MRI-based hippocampal volumes in aging and AD
Petersen, R. C., Jack, C. R., Xu, Y.-C., Waring, S. C., O’Brien, P. C., Smith, G. E., Ivnik, R. J., Tangalos, E. G., Boeve, B. F., & Kokmen, E. (2000) · Neurology · doi:10.1212/wnl.54.3.581 · Cited by 426
Cited by
Sorted by citations
Neuroanatomical substrates of age-related cognitive decline.
Salthouse, T. A. (2011) · Psychological Bulletin · doi:10.1037/a0023262 · Cited by 410
Sex differences and structural brain maturation from childhood to early adulthood
Koolschijn, P. C. M. P., & Crone, E. A. (2013) · Developmental Cognitive Neuroscience · doi:10.1016/j.dcn.2013.02.003 · Cited by 251
A systematic review and meta-analysis of longitudinal hippocampal atrophy in healthy human ageing
Fraser, M. A., Shaw, M. E., & Cherbuin, N. (2015) · NeuroImage · doi:10.1016/j.neuroimage.2015.03.035 · Cited by 175
Self-citationWang, H., Das, S. R., Suh, J. W., Altinay, M., Pluta, J., Craige, C., Avants, B., & Yushkevich, P. A. (2011) · NeuroImage · doi:10.1016/j.neuroimage.2011.01.006 · Cited by 177
Schoemaker, D., Buß, C., Head, K., Sandman, C. A., Davis, E. P., Chakravarty, M. M., Gauthier, S. G., & Pruessner, J. C. (2016) · NeuroImage · doi:10.1016/j.neuroimage.2016.01.038 · Cited by 161
Wenger, E., Mårtensson, J., Noack, H., Bodammer, N. C., Kühn, S., Schaefer, S., Heinze, H., Düzel, E., Bäckman, L., Lindenberger, U., et al. (2014) · Human Brain Mapping · doi:10.1002/hbm.22473 · Cited by 151
Nardelli, A., Lebel, C. A., Rasmussen, C., Andrew, G., & Beaulieu, C. (2011) · Alcoholism Clinical and Experimental Research · doi:10.1111/j.1530-0277.2011.01476.x · Cited by 160
Effects of age and Alzheimer's disease on hippocampal subfields
de Florès, R., Joie, R. L., Landeau, B., Perrotin, A., Mézenge, F., Sayette, V. D. L., Eustache, F., Desgranges, B., & Chételat, G. (2014) · Human Brain Mapping · doi:10.1002/hbm.22640 · Cited by 149
Cerebral atrophy in mild cognitive impairment: A systematic review with meta‐analysis
Tabatabaei‐Jafari, H., Shaw, M. E., & Cherbuin, N. (2015) · Alzheimer s & Dementia Diagnosis Assessment & Disease Monitoring · doi:10.1016/j.dadm.2015.11.002 · Cited by 128
Self-citationDewey, J. J., Hana, G., Russell, T., Price, J., McCaffrey, D., Harezlak, J., Sem, E., Anyanwu, J. C., Guttmann, C. R. G., NAVIA, B. A., et al. (2010) · NeuroImage · doi:10.1016/j.neuroimage.2010.03.033 · Cited by 133
A comparison of FreeSurfer-generated data with and without manual intervention
McCarthy, C. S., Ramprashad, A., Thompson, C., Botti, J.-A., Coman, I. L., & Kates, W. R. (2015) · Frontiers in Neuroscience · doi:10.3389/fnins.2015.00379 · Cited by 122
Hippocampal Volume Is Decreased in Adults with Hypothyroidism
Cooke, G. E., Mullally, S. L., Correia, N., O’Mara, S. M., & Gibney, J. (2013) · Thyroid · doi:10.1089/thy.2013.0058 · Cited by 124
Global and regional alterations of hippocampal anatomy in long‐term meditation practitioners
Eileen Luders, A., Thompson, P. M., Kurth, F., Hong, J., Phillips, O. R., Wang, Y., Gutman, B. A., Chou, Y., Narr, K. L., & Toga, A. W. (2012) · Human Brain Mapping · doi:10.1002/hbm.22153 · Cited by 116
Butterworth, P., Cherbuin, N., Sachdev, P. S., & Anstey, K. J. (2011) · Social Cognitive and Affective Neuroscience · doi:10.1093/scan/nsr027 · Cited by 113
Self-citationSánchez‐Benavides, G., Gómez‐Ansón, B., Sainz, A., Vives‐Gilabert, Y., Delfino, M., & Peña‐Casanova, J. (2010) · Psychiatry Research Neuroimaging · doi:10.1016/j.pscychresns.2009.10.011 · Cited by 109
Viscoelasticity of subcortical gray matter structures
Johnson, C. L., Schwarb, H. D., McGarry, M., Anderson, A. T., Huesmann, G., Sutton, B. P., & Cohen, N. J. (2016) · Human Brain Mapping · doi:10.1002/hbm.23314 · Cited by 103
Foley, S. F., Tansey, K. E., Caseras, X., Lancaster, T. M., Bracht, T., Parker, G. D., Hall, J., Williams, J. H., & Linden, D. E. J. (2016) · Biological Psychiatry · doi:10.1016/j.biopsych.2016.02.033 · Cited by 98
Schmidt, M. F., Storrs, J. M., Freeman, K. B., Jack, C. R., Turner, S. T., Griswold, M. E., & Mosley, T. H. (2018) · Human Brain Mapping · doi:10.1002/hbm.24017 · Cited by 98
A comparative study of segmentation techniques for the quantification of brain subcortical volume
Akudjedu, T. N., Nabulsi, L., Makelyte, M., Scanlon, C., Hehir, S., Casey, H., Ambati, S., Kenney, J. P. M., O’Donoghue, S., McDermott, E. A., et al. (2018) · Brain Imaging and Behavior · doi:10.1007/s11682-018-9835-y · Cited by 91
Contribution of Brain Size to IQ and Educational Underperformance in Extremely Preterm Adolescents
Cheong, J. L. Y., Anderson, P. J., Roberts, G., Burnett, A., Lee, K. J., Thompson, D. K., Molloy, C. S., Wilson‐Ching, M., Connelly, A., Seal, M. L., et al. (2013) · PLoS ONE · doi:10.1371/journal.pone.0077475 · Cited by 88
Tract-based analysis of white matter degeneration in Alzheimer’s disease
Lee, S., Coutu, J., Wilkens, P. J., Yendiki, A., Rosas, H. D., & Salat, D. H. (2015) · Neuroscience · doi:10.1016/j.neuroscience.2015.05.049 · Cited by 91
Perlaki, G., Horváth, R. A., Nagy, S. A., Bogner, P., Doczi, T. P., Janszky, J., & Orsi, G. (2017) · Scientific Reports · doi:10.1038/s41598-017-02584-5 · Cited by 87
Volume estimation of the thalamus using freesurfer and stereology: consistency between methods
Keller, S. S., Gerdes, J. S., Mohammadi, S., Kellinghaus, C., Kugel, H., Deppe, K., Ringelstein, E. B., Evers, S., Schwindt, W., & Deppe, M. (2012) · Neuroinformatics · doi:10.1007/s12021-012-9147-0 · Cited by 84
Bigler, E. D., Abildskov, T. J., Wilde, E. A., McCauley, S. R., Li, X., Merkley, T. L., Fearing, M. A., Newsome, M. R., Scheibel, R. S., Hunter, J. V., et al. (2010) · NeuroImage · doi:10.1016/j.neuroimage.2010.01.003 · Cited by 76
Singh, M. K., & Singh, D. K. K. (2021) · Annals of Neurosciences · doi:10.1177/0972753121990175 · Cited by 75
Preserved subcortical volumes and cortical thickness in women with sexual abuse-related PTSD
Landré, L., Destrieux, C., Baudry, M., Barantin, L., Cottier, J., Martineau, J., Hommet, C., Isingrini, M. L., Belzung, C., Gaillard, P., et al. (2010) · Psychiatry Research Neuroimaging · doi:10.1016/j.pscychresns.2010.01.015 · Cited by 76
KHAN, A. R., Cherbuin, N., Wen, W. X., Anstey, K. J., Sachdev, P. S., & Beg, M. F. (2011) · NeuroImage · doi:10.1016/j.neuroimage.2011.01.078 · Cited by 67
Self-citationSacco, R., Bisecco, A., Corbo, D., Corte, M. D., d’Ambrosio, A., Docimo, R., Gallo, A., Esposito, F., Esposito, S., Cirillo, M., et al. (2015) · Journal of Neurology · doi:10.1007/s00415-015-7763-y · Cited by 69
Hippocampal volumetrics in treatment‐resistant depression and schizophrenia: The devil's in De‐Tail
Maller, J. J., Daskalakis, Z. J., Thomson, R. H., Daigle, M., Barr, M. S., & Fitzgerald, P. B. (2010) · Hippocampus · doi:10.1002/hipo.20873 · Cited by 67
Diagnostic accuracy of markers for prodromal Alzheimer's disease in independent clinical series
Prestia, A., Caroli, A., Herholz, K., Reiman, E. M., Chen, K., Jagust, W. J., Frisoni, G. B., & Initiative, A. D. N. (2013) · Alzheimer s & Dementia · doi:10.1016/j.jalz.2012.09.016 · Cited by 60
Hippocampal atrophy in relapsing-remitting and primary progressive MS: a comparative study
Anderson, V. M., Fisniku, L. K., Khaleeli, Z., Summers, M., Penny, S., Altmann, D. R., Thompson, A. J., Ron, M. A., & Miller, D. (2010) · Multiple Sclerosis Journal · doi:10.1177/1352458510374893 · Cited by 60
A decade of changes in brain volume and cognition
Aljondi, R., Szoeke, C. E. I., Steward, C., Yates, P. A., & Desmond, P. M. (2018) · Brain Imaging and Behavior · doi:10.1007/s11682-018-9887-z · Cited by 62
Differential brain shrinkage over 6 months shows limited association with cognitive practice
Raz, N., Schmiedek, F., Rodrigue, K. M., Kennedy, K. M., Lindenberger, U., & Lövdén, M. (2013) · Brain and Cognition · doi:10.1016/j.bandc.2013.04.002 · Cited by 56
Hippocampal volume and internalizing behavior problems in adolescence
Koolschijn, P. C. M. P., van IJzendoorn, M. H., Bakermans‐Kranenburg, M. J., & Crone, E. A. (2012) · European Neuropsychopharmacology · doi:10.1016/j.euroneuro.2012.07.001 · Cited by 55
Guzmán-Vélez, E., Warren, D. E., Feinstein, J. S., Bruss, J., & Tranel, D. (2016) · Hippocampus · doi:10.1002/hipo.22554 · Cited by 37
Head, D. M., Singh, T., & Bugg, J. M. (2012) · Neuropsychology · doi:10.1037/a0027108 · Cited by 51
Srinivasan, D., Erus, G., Doshi, J., Wolk, D. A., Shou, H., Habes, M., & Davatzikos, C. (2020) · NeuroImage · doi:10.1016/j.neuroimage.2020.117248 · Cited by 45
“…Freesurfer is extensively validated and it has been used in a large number of studies, various studies have also reported high rates of failures resulting in exclusion of large number of scans, inconsistencies in segmentations and age related bias ( Wenger et al., 2014 ; Cherbuin et al., 2009 ).”
Automated versus manual segmentation of brain region volumes in former football players
Guenette, J. P., Stern, R. A., Tripodis, Y., Chua, A. S., Schultz, V., Sydnor, V. J., Somes, N., Karmacharya, S., Lepage, C., Wróbel, P., et al. (2018) · NeuroImage Clinical · doi:10.1016/j.nicl.2018.03.026 · Cited by 45
A preliminary choroid plexus volumetric study in individuals with psychosis
Şenay, O., Seethaler, M., Makris, N., Yeterian, E. H., Rushmore, J., Cho, K. I. K., Rizzoni, E., Heller, C., Pasternak, O., Szczepankiewicz, F., et al. (2023) · Human Brain Mapping · doi:10.1002/hbm.26224 · Cited by 40
APOE ε2 Allele Is Associated with Larger Regional Cortical Thicknesses and Volumes
Liu, Y., Paajanen, T. I., Westman, E., Zhang, Y., Wahlund, L., Simmons, A., Tunnard, C., Sobów, T., Proitsi, P., Powell, J. F., et al. (2010) · Dementia and Geriatric Cognitive Disorders · doi:10.1159/000320136 · Cited by 42
Hippocampal Volume and Memory and Learning Outcomes at 7 Years in Children Born Very Preterm
Omizzolo, C., Thompson, D. K., Scratch, S. E., Stargatt, R., Lee, K. J., Cheong, J. L. Y., Roberts, G., Doyle, L. W., & Anderson, P. J. (2013) · Journal of the International Neuropsychological Society · doi:10.1017/s1355617713000891 · Cited by 56
Initiative, A. D. N., Kim, A., Fagan, A. M., Goate, A., Benzinger, T. L. S., Morris, J. C., & Head, D. M. (2015) · Cognitive Affective & Behavioral Neuroscience · doi:10.3758/s13415-015-0343-x · Cited by 42
Cortical thickness estimation in longitudinal stroke studies: A comparison of 3 measurement methods
Li, Q., Pardoe, H., Lichter, R., Werden, E., Raffelt, A., Cumming, T. B., & Brodtmann, A. G. (2014) · NeuroImage Clinical · doi:10.1016/j.nicl.2014.08.017 · Cited by 39
Ex vivo MR volumetry of human brain hemispheres
Kotrotsou, A., Bennett, D. A. A., Schneider, J. A., Dawe, R. J., Golak, T., Leurgans, S. E., Yu, L., & Arfanakis, K. (2013) · Magnetic Resonance in Medicine · doi:10.1002/mrm.24661 · Cited by 36
Regional brain volumetric changes despite 2 years of treatment initiated during acute HIV infection
Kallianpur, K. J., Jahanshad, N., Sailasuta, N., Benjapornpong, K., Chan, P., Pothisri, M., Dumrongpisutikul, N., Laws, E. I., Ndhlovu, L. C., Clifford, K. M., et al. (2019) · AIDS · doi:10.1097/qad.0000000000002436 · Cited by 36
Gautam, P., Cherbuin, N., Sachdev, P. S., Wen, W. X., & Anstey, K. J. (2011) · NeuroImage · doi:10.1016/j.neuroimage.2011.01.015 · Cited by 37
Self-citationHayashi, N., Matsumae, M., Yatsushiro, S., Hirayama, A., Abdullah, A., & Kuroda, K. (2015) · Neurologia medico-chirurgica · doi:10.2176/nmc.oa.2014-0339 · Cited by 34
Neuropsychological Correlates of Hippocampal Atrophy in Memory Testing in Nondemented Older Adults
Vyhnálek, M., Nikolai, T., Andel, R., Nedelská, Z., Rubínová, E., Marková, H., Laczó, J., Bezdíček, O., Sheardová, K., & Hort, J. (2014) · Journal of Alzheimer s Disease · doi:10.3233/jad-132642 · Cited by 39
Koran, M. E. I., Hohman, T. J., Edwards, C. M., Vega, J. N., Pryweller, J. R., Slosky, L. E., Crockett, G., de Rey, L. V., Meda, S. A., Dankner, N., et al. (2014) · Journal of Neurodevelopmental Disorders · doi:10.1186/1866-1955-6-8 · Cited by 34
Eckerström, C., Andréasson, U., Olsson, E., Rolstad, S., Blennow, K., Zetterberg, H., Malmgren, H., Edman, Å., & Wallin, A. (2010) · Dementia and Geriatric Cognitive Disorders · doi:10.1159/000289814 · Cited by 32
Guorong Wu, A., Wang, Q., & Shen, D. G. (2011) · NeuroImage · doi:10.1016/j.neuroimage.2011.07.026 · Cited by 33
Pratt, H., Hassanin, K., Troughton, L. D., Czanner, G., Zheng, Y., McCormick, A. G., & Hamill, K. J. (2017) · PLoS ONE · doi:10.1371/journal.pone.0185297 · Cited by 29
Automated MRI parcellation of the frontal lobe
Ranta, M. E., Chen, M., Crocetti, D., Prince, J. L., Subramaniam, K., Fischl, B. R., Kaufmann, W. E., & Mostofsky, S. H. (2013) · Human Brain Mapping · doi:10.1002/hbm.22309 · Cited by 28
Turning bias in virtual spatial navigation: Age-related differences and neuroanatomical correlates
Yuan, P., Daugherty, A. M., & Raz, N. (2013) · Biological Psychology · doi:10.1016/j.biopsycho.2013.10.009 · Cited by 27
Phillips, J. L., Batten, L. A., Tremblay, P., Aldosary, F., Du, L., & Blier, P. (2015) · Acta Neuropsychiatrica · doi:10.1017/neu.2015.25 · Cited by 27
Bunce, D. J., Anstey, K. J., Cherbuin, N., Gautam, P., Sachdev, P. S., & Easteal, S. (2012) · Journal of Alzheimer s Disease · doi:10.3233/jad-2012-112126 · Cited by 26
Self-citationBiffen, S. C., Warton, C. M. R., Dodge, N. C., Molteno, C. D., Jacobson, J. L., Jacobson, S. W., & Meintjes, E. M. (2020) · NeuroImage Clinical · doi:10.1016/j.nicl.2020.102368 · Cited by 25
Lidauer, K., Pulli, E. P., Copeland, A., Silver, E. A., Kumpulainen, V., Hashempour, N., Merisaari, H., Saunavaara, J. P., Parkkola, R. K., Lähdesmäki, T., et al. (2022) · European Journal of Neuroscience · doi:10.1111/ejn.15761 · Cited by 24
Harrison, J. R., Foley, S. F., Baker, E. A., Bracher‐Smith, M., Holmans, P., Stergiakouli, E., Linden, D. E. J., Caseras, X., Jones, D. K., & Escott‐Price, V. (2023) · Brain Communications · doi:10.1093/braincomms/fcad229 · Cited by 23
Diastolic Blood Pressure Variability in Later Life May Be a Key Risk Marker for Cognitive Decline
Peters, R., Xu, Y. H., Eramudugolla, R., Sachdev, P. S., Cherbuin, N., Tully, P. J., Mortby, M. E., & Anstey, K. J. (2022) · Hypertension · doi:10.1161/hypertensionaha.121.18799 · Cited by 22
Self-citationOccipital bending in schizophrenia
Maller, J. J., Anderson, R. J., Thomson, R. H., Daskalakis, Z. J., Rosenfeld, J. V., & Fitzgerald, P. B. (2016) · Australian & New Zealand Journal of Psychiatry · doi:10.1177/0004867416642023 · Cited by 22
Cheung, E. Y., Shea, Y. F., Chiu, P. K. C., Kwan, J. S. K., & Mak, H. K. (2021) · Life · doi:10.3390/life11101108 · Cited by 22
Pintzka, C. W. S., & Haberg, A. K. (2015) · Neurobiology of Aging · doi:10.1016/j.neurobiolaging.2015.05.023 · Cited by 22
Pasquini, L., Scherr, M., Tahmasian, M., Myers, N. E., Ortner, M., Kurz, A., Förstl, H., Zimmer, C., Grimmer, T., Akhrif, A., et al. (2016) · Journal of Alzheimer s Disease · doi:10.3233/jad-150823 · Cited by 20
Accuracy and bias of automatic hippocampal segmentation in children and adolescents
Herten, A., Konrad, K., Krinzinger, H., Seitz, J., & von Polier, G. G. (2018) · Brain Structure and Function · doi:10.1007/s00429-018-1802-2 · Cited by 23
Hippocampal volume asymmetry in Alzheimer disease: A systematic review and meta-analysis
Pusparani, Y., Lin, C., Jan, Y., Lin, F., Liau, B.-Y., Alex, J. S. R., Aparajeeta, J., Chao, W.-H., & Lung, C.-W. (2025) · Medicine · doi:10.1097/md.0000000000041662 · Cited by 18
Cavedo, E., Tran, P., Thoprakarn, U., Martini, J., Movschin, A., Delmaire, C., Gariel, F., Heidelberg, D., Pyatigorskaya, N., Ströer, S., et al. (2022) · European Radiology · doi:10.1007/s00330-021-08385-9 · Cited by 17
Regional Brain Volumes and ADHD Symptoms in Middle-Aged Adults: The PATH Through Life Study
Das, D., Cherbuin, N., Anstey, K. J., Abhayaratna, W. P., & Easteal, S. (2014) · Journal of Attention Disorders · doi:10.1177/1087054714523316 · Cited by 17
Self-citationCheung, E. Y., Chau, A. C. M., Tang, F. H., & Initiative, O. B. O. T. A. D. N. (2022) · Life · doi:10.3390/life12040514 · Cited by 18
Fraser, M. A., Walsh, E., Shaw, M. E., Abhayaratna, W. P., Anstey, K. J., Sachdev, P. S., & Cherbuin, N. (2020) · Neurobiology of Aging · doi:10.1016/j.neurobiolaging.2020.10.011 · Cited by 17
Self-citationHippocampal atrophy rates in Alzheimer's disease: Automated segmentation variability analysis
Mouiha, A., & Duchesne, S. (2011) · Neuroscience Letters · doi:10.1016/j.neulet.2011.02.065 · Cited by 17
Ohtani, T., del Re, E. C., Levitt, J. J., Niznikiewicz, M. A., Konishi, J. S., Asami, T., Kawashima, T., Roppongi, T., Nestor, P. G., Shenton, M. E., et al. (2018) · Brain Structure and Function · doi:10.1007/s00429-018-1634-0 · Cited by 17
Automated segmentation of the human hippocampus along its longitudinal axis
Lerma‐Usabiaga, G., Iglesias, J. E., Insausti, R., Greve, D. N., & Paz‐Alonso, P. M. (2016) · Human Brain Mapping · doi:10.1002/hbm.23245 · Cited by 17
Widjaja, E., Zamyadi, M., Raybaud, C., Snead, O. C., & Smith, M. L. (2014) · Epilepsia · doi:10.1111/epi.12540 · Cited by 15
Regional analysis of volumes and reproducibilities of automatic and manual hippocampal segmentations
Bartel, F., Vrenken, H., Bijma, F., Barkhof, F., van Herk, M., & de Munck, J. C. (2017) · PLoS ONE · doi:10.1371/journal.pone.0166785 · Cited by 15
Fung, Y. L., Ng, K. E. T., Vogrin, S. J., Meade, C. E., Ngo, M. M., Collins, S. J., & Bowden, S. C. (2019) · Journal of Alzheimer s Disease · doi:10.3233/jad-181172 · Cited by 17
Gautam, P., Cherbuin, N., Sachdev, P. S., Wen, W. X., & Anstey, K. J. (2013) · Neuroradiology · doi:10.1007/s00234-013-1144-y · Cited by 15
Self-citationFraser, M. A., Walsh, E., Shaw, M. E., Anstey, K. J., & Cherbuin, N. (2021) · Cerebral Cortex · doi:10.1093/cercor/bhab375 · Cited by 15
Self-citationDuncan, D., Garner, R., Zrantchev, I., Ard, T. D., Newman, B., Saslow, A., Wanserski, E., & Toga, A. W. (2018) · Journal of Imaging Informatics in Medicine · doi:10.1007/s10278-018-0108-5 · Cited by 14
Bartel, F., Vrenken, H., van Herk, M., de Ruiter, M. B., Belderbos, J. S. A., Hulshof, J., & de Munck, J. C. (2019) · PLoS ONE · doi:10.1371/journal.pone.0210641 · Cited by 13
Ghusayni, R., Richardson, J. P., Uchitel, J., Abdelnour, E., McLean, M., Prange, L., Abrahamsen, T., Song, A. W., Petrella, J. R., & Mikati, M. A. (2020) · European Journal of Paediatric Neurology · doi:10.1016/j.ejpn.2020.02.001 · Cited by 12
Huang, S., Tsai, S., Hsu, J., & Huang, Y.-L. (2010) · International Psychogeriatrics · doi:10.1017/s1041610210000633 · Cited by 12
Silva, G., Martins, C., da Silva, N. M., Vieira, D., Costa, D., Rego, R., Fonseca, J., & Cunha, J. P. S. (2017) · The Neuroradiology Journal · doi:10.1177/1971400917709627 · Cited by 12
DBB - A Distorted Brain Benchmark for Automatic Tissue Segmentation in Paediatric Patients
Amorosino, G., Peruzzo, D., Redaelli, D., Olivetti, E., Arrigoni, F., & Avesani, P. (2022) · NeuroImage · doi:10.1016/j.neuroimage.2022.119486 · Cited by 15
Fraser, M. A., Shaw, M. E., Anstey, K. J., & Cherbuin, N. (2018) · Brain Topography · doi:10.1007/s10548-018-0659-2 · Cited by 11
Self-citationMerkel, B., Steward, C. E., Vivash, L. E., Malpas, C. B., Phal, P. M., Moffat, B. A., Cox, K. L., Ellis, K. A., Ames, D. J., Cyarto, E., et al. (2015) · Journal of Magnetic Resonance Imaging · doi:10.1002/jmri.24966 · Cited by 10
Cruz-Gómez, Á. J., Belenguer, A., Martínez-Bronchal, B., Márquez, M. S. F., & Forn, C. (2016) · Revista de Neurología · doi:10.33588/rn.6201.2015216 · Cited by 8
Peruzzolo, T. L., Anés, M., Kohmann, A. M., Souza, A. C. M. L., Rodrigues, R. B., Brun, J. B., Peters, R., de Aguiar, B. W., Kapczinski, F. P., Tramontina, S., et al. (2015) · Neural Plasticity · doi:10.1155/2015/324825 · Cited by 8
Liedlgruber, M., Butz, K. H. G., Höller, Y., Kuchukhidze, G., Taylor, A., Tomasi, O. S., Trinka, E., & Uhl, A. (2016) · Proceedings - IEEE Symposium on Computer-Based Medical Systems · doi:10.1109/cbms.2016.55 · Cited by 8
Cheung, E. Y., Wu, R. W. K., Chu, E. S. M., & Mak, H. K. (2024) · Biomedicines · doi:10.3390/biomedicines12040896 · Cited by 7
Uncal apex position varies with normal aging
Poppenk, J. (2020) · Hippocampus · doi:10.1002/hipo.23196 · Cited by 7
Episodic Memory Performance Modifies the Strength of the Age–Brain Structure Relationship
Richmond, L. L., Brackins, T., & Rajaram, S. (2022) · International Journal of Environmental Research and Public Health · doi:10.3390/ijerph19074364 · Cited by 7
Moon, C., Lee, Y. Y., Hyeong, K.-E., Yoon, W., Baek, B. H., Heo, S., Shin, S. S., & Kim, S. K. (2023) · Frontiers in Neuroscience · doi:10.3389/fnins.2023.1157738 · Cited by 6
Validation of FS+LDDMM by automatic segmentation of caudate nucleus in brain MRI
Ansari, S. U. (2010) · International Conference on Frontiers of Information Technology (FIT) · doi:10.1145/1943628.1943638 · Cited by 5
Cramer, J. A., Baxter, L. C., Lang, H., Parker, J. J., Chen, A. M., Matthees, N. G., Ikuta, I., Wang, Y., & Zhou, Y. (2025) · Bioengineering · doi:10.3390/bioengineering12030258 · Cited by 4
Pathology-Related Automated Hippocampus Segmentation Accuracy
Liedlgruber, M., Butz, K. H. G., Höller, Y., Kuchukhidze, G., Taylor, A., Thomschewski, A. C., Tomasi, O. S., Trinka, E., & Uhl, A. (2017) · Informatik aktuell · doi:10.1007/978-3-662-54345-0_31 · Cited by 4
The Chinese Verbal Learning Test Specifically Assesses Hippocampal State
Tsai, R. M., Leong, J. K., Dutt, S., Chang, C. C., Lee, A. K., Chao, S. Z., Yokoyama, J. S., Tse, M., Kramer, J. H., Miller, B. L., et al. (2014) · American Journal of Alzheimer s Disease & Other Dementias® · doi:10.1177/1533317514552667 · Cited by 4
Martins, C., da Silva, N. M., Silva, G. H. D. O., Rozanski, V. E., & Cunha, J. P. S. (2016) · Annual International Conference of the IEEE Engineering in Medicine and Biology Society (EMBC) · doi:10.1109/embc.2016.7592178 · Cited by 3
Bertoni, M., & Sclavi, N. E. (2010) · The Neuroradiology Journal · doi:10.1177/197140091002300612 · Cited by 3
Assessing Out-of-the-box Software for Automated Hippocampus Segmentation
Gschwandtner, M., Höller, Y., Liedlgruber, M., Trinka, E., & Uhl, A. (2016) · Informatik aktuell · doi:10.1007/978-3-662-49465-3_38 · Cited by 3
Metadata
- Authors
- Cherbuin, N., Anstey, K. J., Réglade-Meslin, C., & Sachdev, P. S.
- Affiliations
- Australian National University (AU)
- UNSW Sydney (AU)
- Corresponding author
- Cherbuin, Nicolas
- Venue
- PLoS ONE
- Publisher
- Public Library of Science (PLoS)
- Published
- 2009-04-16
- Volume
- 4
- Issue
- 4
- Pages
- e5265
- ISSN
- 1932-6203 (ISSN-L)
- PMC
- PMC2667216
- OpenAlex
- W2061639197
- Cited by
- 116
- References
- 39
- Citations by year
- 2026: 1 · 2025: 2 · 2024: 2 · 2023: 5 · 2022: 6 · 2021: 4 · 2020: 5 · 2019: 6 · 2018: 8 · 2017: 6 · 2016: 10 · 2015: 13 · 2014: 9 · 2013: 11 · 2012: 7
- FWCI
- 10.30
- Type
- journal article
- Language
- en
- Open access
- gold
- doi.org
- Locations
- PLoS ONE (publishedVersion, cc-by)
- PubMed Central (publishedVersion, cc-by)
- PubMed (publishedVersion)
- UNSWorks (University of New South Wales, Sydney, Australia) (submittedVersion, cc-by-nc-nd)
- UNSWorks (UNSW Sydney) (submittedVersion, cc-by-nc-nd)
- RePEc: Research Papers in Economics (submittedVersion)
- DOAJ (DOAJ: Directory of Open Access Journals) (submittedVersion, cc-by-sa)
- ANU Open Research (Australian National University) (submittedVersion, cc-by)
- Funders
- Australian Rotary Health
- Medical Research Council
- National Health and Medical Research Council (973302, 366756, 418020, 157125, 179805)
- Topics
- Physical Sciences › Computer Science › Computer Vision and Pattern Recognition › Medical Image Segmentation Techniques
- Health Sciences › Medicine › Psychiatry and Mental health › Dementia and Cognitive Impairment Research
- Life Sciences › Neuroscience › Cognitive Neuroscience › Memory and Neural Mechanisms
- Keywords
- hippocampal volume, FreeSurfer, measurement method comparison, memory performance, community sample
- MeSH terms
- Adult, Female, Hippocampus, Humans, Image Processing, Computer-Assisted, Magnetic Resonance Imaging, Male, Memory, Middle Aged, Organ Size, Pattern Recognition, Automated, Regression Analysis, Socioeconomic Factors, Imaging, Three-Dimensional
About these checks
Registry, retraction, Cites and statistics results are computed, not judged, with one exception: a printed reference that no index lists is read once by a model before it counts as a citation error. Claims are extracted by a model and kept only when their quote appears verbatim in the text; each cited source is then checked, with a model’s help, for whether it says what the claim relies on. Those verdicts can be wrong — read the claim’s quote and the cited source before relying on one.
Statistics and arithmetic are recomputed, not judged.
Confidence bands are shown only for fields calibrated on our annotated test set. None is calibrated yet, so no band is shown.
What counts as a claim ›How we measure confidence ›How we check this ›
Are you an author, or do you see a problem with this page? Request a review
