

The DOI matches its Crossref record; 65 of the 65 references it cites were found in a registry or an index.
A Comprehensive Microarray-Based DNA Methylation Study of 367 Hematological Neoplasms
Open accessAbstract
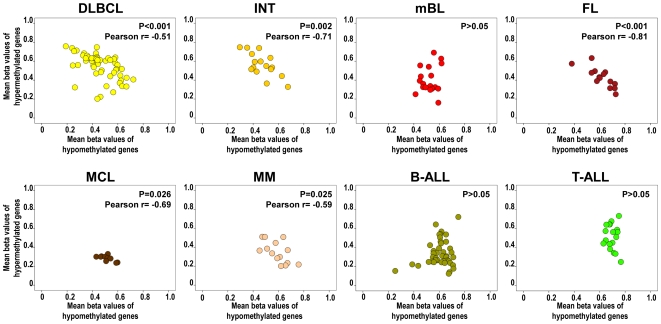
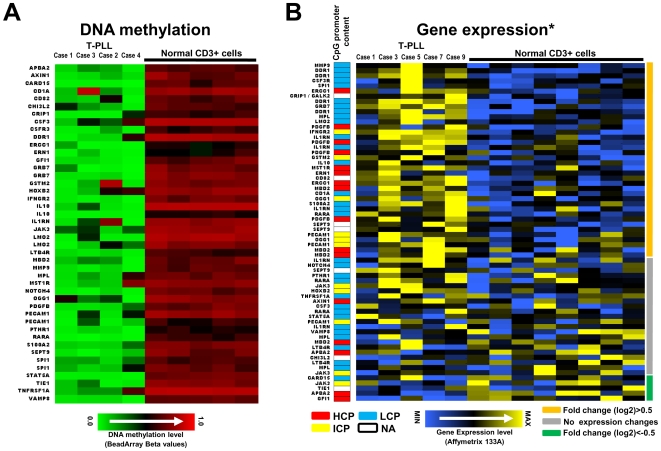
BACKGROUND: Alterations in the DNA methylation pattern are a hallmark of leukemias and lymphomas. However, most epigenetic studies in hematologic neoplasms (HNs) have focused either on the analysis of few candidate genes or many genes and few HN entities, and comprehensive studies are required. METHODOLOGY/PRINCIPAL FINDINGS: Here, we report for the first time a microarray-based DNA methylation study of 767 genes in 367 HNs diagnosed with 16 of the most representative B-cell (n = 203), T-cell (n = 30), and myeloid (n = 134) neoplasias, as well as 37 samples from different cell types of the hematopoietic system. Using appropriate controls of B-, T-, or myeloid cellular origin, we identified a total of 220 genes hypermethylated in at least one HN entity. In general, promoter hypermethylation was more frequent in lymphoid malignancies than in myeloid malignancies, being germinal center mature B-cell lymphomas as well as B and T precursor lymphoid neoplasias those entities with highest frequency of gene-associated DNA hypermethylation. We also observed a significant correlation between the number of hypermethylated and hypomethylated genes in several mature B-cell neoplasias, but not in precursor B- and T-cell leukemias. Most of the genes becoming hypermethylated contained promoters with high CpG content, and a significant fraction of them are targets of the polycomb repressor complex. Interestingly, T-cell prolymphocytic leukemias show low levels of DNA hypermethylation and a comparatively large number of hypomethylated genes, many of them showing an increased gene expression. CONCLUSIONS/SIGNIFICANCE: We have characterized the DNA methylation profile of a wide range of different HNs entities. As well as identifying genes showing aberrant DNA methylation in certain HN subtypes, we also detected six genes--DBC1, DIO3, FZD9, HS3ST2, MOS, and MYOD1--that were significantly hypermethylated in B-cell, T-cell, and myeloid malignancies. These might therefore play an important role in the development of different HNs.
Overview
The claims and statistics of this paper haven’t been checked yet.
Run the check — free, no account needed. It reads the open-access text and checks the sources it cites.
Integrity signals
Registry
Cites
Statistics
Figures
Verification
Claims the paper makes
The claims and statistics of this paper haven’t been checked yet.
Run the check — free, no account needed. It reads the open-access text and checks the sources it cites.
Claims other papers make about this one
Each is checked against this paper’s own text: does it say what the citing paper says it does?
The source backs part of the claim, not all of it — or backs it for a different population, condition or comparison.
In the citing paper
“CpG sites that become more methylated with normal myeloid maturation were not significantly more methylated in independent dataset MDS/myeloproliferative disease (MDS/MPD) (n=13) or AML bone marrow (n=116) (figure S2).”
From CpG methylation patterns and decitabine treatment response in acute myeloid leukemia cells and normal hematopoietic precursors (2012) · cites this paper as [31]
Experimental — accuracy not yet measuredThe check wasn’t confident either way, so it gives no verdict — never disputed.
In the citing paper
“All 6 CpG sites that were >20% less methylated in AML cells than NCD34 were from the category of 157 CpG sites that become less methylated with normal myeloid maturation (figure S3).”
From CpG methylation patterns and decitabine treatment response in acute myeloid leukemia cells and normal hematopoietic precursors (2012) · cites this paper as [31]
Experimental — accuracy not yet measuredIn the citing paper
“In unbiased hierarchical cluster analysis of methylation data from an independent study (31), clusters generated using maturation-responsive CpG discriminated best between NCD34 and NBM, despite 7 to 8-fold more CpG sites in the ‘no methylation change’ category (figure S1).”
From CpG methylation patterns and decitabine treatment response in acute myeloid leukemia cells and normal hematopoietic precursors (2012) · cites this paper as [31]
In the citing paper
“Methylation of maturation-responsive CpG (hypo and hypermethylated in NCD34) changed in the expected directions from independent NCD34 to NBM (figure S2, red and blue box plots).”
From CpG methylation patterns and decitabine treatment response in acute myeloid leukemia cells and normal hematopoietic precursors (2012) · cites this paper as [31]
In the citing paper
“Therefore, maturation-responsive CpG sites were over-represented amongst the most hypermethylated CpG sites in AML bone marrow (p<0.0001, Chi-Square test).”
From CpG methylation patterns and decitabine treatment response in acute myeloid leukemia cells and normal hematopoietic precursors (2012) · cites this paper as [31]
5 more claims about this paper
Create a free account to see every claim other papers make about this one.
Self-check
Percentages, sums and reported differences re-computed from the paper’s own numbers.
The self-check needs the paper’s full text.
Citations
Cites
1 retracted
Epigenetic regulation of Wnt-signaling pathway in acute lymphoblastic leukemia
Román-Gómez, J., Cordeu, L., Agirre, X., Jiménez-Velasco, A., San José-Eneriz, E., Garate, L., Calasanz, M. J., Heiniger, A., Torres, A., & Prosper, F. (2007) · Blood · doi:10.1182/blood-2006-09-047043 · Cited by 168
Self-citationRetractedWHO Classification of Tumours of Haematopoietic and Lymphoid Tissues
Swerdlow, S. H. (2017) · Medical Entomology and Zoology · Cited by 12,933
Jones, P. A., & Baylin, S. B. (2007) · Cell · doi:10.1016/j.cell.2007.01.029 · Cited by 4,515
Esteller, M. (2008) · New England Journal of Medicine · doi:10.1056/nejmra072067 · Cited by 3,662
Fenaux, P., Mufti, G. J., Hellstrom-Lindberg, E., Santini, V., Finelli, C., Giagounidis, A., Schoch, R., Gattermann, N., Sanz, G., List, A., et al. (2009) · The Lancet Oncology · doi:10.1016/s1470-2045(09)70003-8 · Cited by 2,663 · cited 1×
“For instance, results from a phase III study have indicated that treatment of patients with higher risk MDS with 5-azacitidine results in significant improvement in overall survival [65].”
Control of Developmental Regulators by Polycomb in Human Embryonic Stem Cells
Lee, T. I., Jenner, R. G., Boyer, L. A., Guenther, M. G., Levine, S. S., Kumar, R. M., Chevalier, B., Johnstone, S. E., Cole, M. F., Isono, K.-I., et al. (2006) · Cell · doi:10.1016/j.cell.2006.02.043 · Cited by 2,268
Weber, M., Hellmann, I., Stadler, M. B., Ramos, L., Pääbo, S., Rebhan, M., & Schübeler, D. (2007) · Nature Genetics · doi:10.1038/ng1990 · Cited by 2,221
The Polycomb group protein EZH2 directly controls DNA methylation
Viré, E., Brenner, C., Deplus, R., Blanchon, L., Fraga, M., Didelot, C., Morey, L., Van Eynde, A., Bernard, D., Vanderwinden, J.-M., et al. (2006) · Nature · doi:10.1038/nature04431 · Cited by 2,204
Bernstein, B. E., Meissner, A., & Lander, E. S. (2007) · Cell · doi:10.1016/j.cell.2007.01.033 · Cited by 2,086
DNA methylation in cancer: too much, but also too little
Ehrlich, M. (2002) · Oncogene · doi:10.1038/sj.onc.1205651 · Cited by 1,538
Cited by
Volkmar, M., Dedeurwaerder, S., Cunha, D. A., Ndlovu, M. N., Defrance, M., Deplus, R., Calonne, E., Volkmar, U., Igoillo‐Esteve, M., Naamane, N., et al. (2012) · The EMBO Journal · doi:10.1038/emboj.2011.503 · Cited by 420
“DNA damage/oxidative stress ALDH3B1 encodes an aldehyde dehydrogenase that can protect cells from lipid peroxidation-induced cytotoxicity (Marchitti et al , 2007).”
Heparan sulfate 3-O-sulfation: A rare modification in search of a function
Thacker, B. E., Xu, D., Lawrence, R., & Esko, J. D. (2014) · Matrix Biology · doi:10.1016/j.matbio.2013.12.001 · Cited by 234
TET1 is a tumor suppressor of hematopoietic malignancy
Cimmino, L., Dawlaty, M. M., Ndiaye-Lobry, D., Yap, Y. S., Bakogianni, S., Yu, Y., Bhattacharyya, S., Shaknovich, R., Geng, H., Lobry, C., et al. (2015) · Nature Immunology · doi:10.1038/ni.3148 · Cited by 229
Epigenetics: molecular mechanisms and implications for disease
Handel, A. E., Ebers, G. C., & Ramagopalan, S. V. (2010) · Trends in Molecular Medicine · doi:10.1016/j.molmed.2009.11.003 · Cited by 222
Wermann, H., Stoop, H., Gillis, A. J., Honecker, F., van Gurp, R. J., Ammerpohl, O., Richter, J., Oosterhuis, J. W., Bokemeyer, C., & Looijenga, L. H. (2010) · The Journal of Pathology · doi:10.1002/path.2725 · Cited by 182
Self-citation
Metadata
- Authors
- Martin-Subero, J. I., Ammerpohl, O., Bibikova, M., Wickham-Garcia, E., Agirre, X., Alvarez, S., Brüggemann, M., Bug, S., Calasanz, M. J., Deckert, M., Dreyling, M., Du, M. Q., Dürig, J., Dyer, M. J. S., Fan, J.-B., Gesk, S., Hansmann, M.-L., Harder, L., Hartmann, S., Klapper, W., Küppers, R., Montesinos-Rongen, M., Nagel, I., Pott, C., Richter, J., Román-Gómez, J., Seifert, M., Stein, H., Suela, J., Trümper, L., Vater, I., Prosper, F., Haferlach, C., Cigudosa, J. C., & Siebert, R.
- Affiliations
- Christian-Albrechts-Universität zu Kiel (DE)
- Illumina (United States) (US)
- Universidad de Navarra (ES)
- University Hospital Cologne (DE)
- Ludwig-Maximilians-Universität München (DE)
- University of Cambridge (GB)
- University of Duisburg-Essen (DE)
- University of Leicester (GB)
- University Hospital Frankfurt (DE)
- Spanish National Cancer Research Centre (ES)
- University of Göttingen (DE)
- Munich Leukemia Laboratory (Germany) (DE)
- Corresponding author
- Siebert, Reiner
- ORCID
- Ammerpohl, Ole
- Agirre, Xabier
- Brüggemann, Monika
- Deckert, Martina
- Dreyling, Martin
- Du, Ming Q.
- Dürig, Jan
- Dyer, Martin J. S.
- Fan, Jian-Bing
- Harder, Lana
- Hartmann, Sylvia
- Klapper, Wolfram
- Küppers, Ralf
- Nagel, Inga
- Pott, Christiane
- Richter, Julia
- Seifert, Marc
- Suela, Javier
- Haferlach, Claudia
- Cigudosa, Juan Cruz
- Siebert, Reiner
- Venue
- PLoS ONE
- Publisher
- Public Library of Science (PLoS)
- Published
- 2009-09-11
- Volume
- 4
- Issue
- 9
- Pages
- e6986
- ISSN
- 1932-6203 (ISSN-L)
- PMC
- PMC2737286
- OpenAlex
- W2145166916
- Cited by
- 134
- References
- 65
- Citations by year
- 2024: 1 · 2023: 1 · 2022: 3 · 2021: 9 · 2020: 3 · 2019: 5 · 2018: 6 · 2017: 2 · 2016: 11 · 2015: 13 · 2014: 11 · 2013: 10 · 2012: 18
- FWCI
- 7.93
- Type
- journal article
- Language
- en
- Open access
- gold
- doi.org
- Locations
- PLoS ONE (publishedVersion, cc-by)
- PubMed Central (publishedVersion, cc-by)
- PubMed (publishedVersion)
- RECERCAT (Consorci de Serveis Universitaris de Catalunya) (publishedVersion, other-oa)
- RePEc: Research Papers in Economics (submittedVersion)
- Deposito Adademico Digital Universidad De Navarra (University of Navarra) (submittedVersion, other-oa)
- Dipòsit Digital de la Universitat de Barcelona (Universitat de Barcelona) (submittedVersion, cc-by)
- DOAJ (DOAJ: Directory of Open Access Journals) (submittedVersion)
- Figshare (submittedVersion, cc-by)
- GoeScholar The Publication Server of the Georg-August-Universität Göttingen (Georg-August-Universität Göttingen) (submittedVersion, cc-by)
- Leicester Research Archive (University of Leicester) (submittedVersion, cc-by)
- Publication Server of Goethe University Frankfurt am Main (Goethe University Frankfurt) (submittedVersion, cc-by)
- Funders
- Wilhelm Sander-Stiftung
- Deutsche Krebshilfe (70‐3173‐Tr3)
- Topics
- Life Sciences › Biochemistry, Genetics and Molecular Biology › Molecular Biology › Epigenetics and DNA Methylation
- Health Sciences › Medicine › Hematology › Acute Myeloid Leukemia Research
- Life Sciences › Biochemistry, Genetics and Molecular Biology › Molecular Biology › Genomics and Chromatin Dynamics
- Keywords
- DNA methylation, hematologic malignancies, promoter hypermethylation, promoter hypomethylation, B-cell lymphoma, T-cell lymphoma, myeloid neoplasms, T-cell prolymphocytic leukemia, CpG content, DBC1, DIO3, FZD9, HS3ST2, MOS, MyoD, epigenetics
- MeSH terms
- B-Lymphocytes, Humans, Promoter Regions, Genetic, T-Lymphocytes, Cluster Analysis, CpG Islands, DNA Methylation, Hematologic Neoplasms, Oligonucleotide Array Sequence Analysis, Gene Expression Profiling
About these checks
Registry, retraction, Cites and statistics results are computed, not judged, with one exception: a printed reference that no index lists is read once by a model before it counts as a citation error. Claims are extracted by a model and kept only when their quote appears verbatim in the text; each cited source is then checked, with a model’s help, for whether it says what the claim relies on. Those verdicts can be wrong — read the claim’s quote and the cited source before relying on one.
Statistics and arithmetic are recomputed, not judged.
Confidence bands are shown only for fields calibrated on our annotated test set. None is calibrated yet, so no band is shown.
What counts as a claim ›How we measure confidence ›How we check this ›
Are you an author, or do you see a problem with this page? Request a review
How to cite
Cite CoChat for the checks on this page, and the paper for its own findings.
- This page
- CoChat. (2026). Citation check: A Comprehensive Microarray-Based DNA Methylation Study of 367 Hematological Neoplasms. https://app.cochat.ai/papers/10.1371/journal.pone.0006986
- The paper
- Martin-Subero, J. I., Ammerpohl, O., Bibikova, M., Wickham-Garcia, E., Agirre, X., Alvarez, S., Brüggemann, M., Bug, S., Calasanz, M. J., Deckert, M., Dreyling, M., Du, M. Q., Dürig, J., Dyer, M. J. S., Fan, J.-B., Gesk, S., Hansmann, M.-L., Harder, L., Hartmann, S., . . . Siebert, R. (2009). A Comprehensive Microarray-Based DNA Methylation Study of 367 Hematological Neoplasms. PLoS ONE. https://doi.org/10.1371/journal.pone.0006986
Data sources
Bibliographic data: Semantic Scholar, OpenAlex, Crossref.
Contains information from the Semantic Scholar Academic Graph Datasets, made available under the ODC Attribution License (ODC-BY 1.0).
Semantic Scholar’s data is described in: Kinney, R., et al. (2023). The Semantic Scholar Open Data Platform. arXiv:2301.10140.
