

The DOI matches its Crossref record; 47 of the 47 references it cites were found in a registry or an index.
Anti-Inflammatory Pharmacotherapy with Ketoprofen Ameliorates Experimental Lymphatic Vascular Insufficiency in Mice
Open accessAbstract
BACKGROUND: Disruption of the lymphatic vasculature causes edema, inflammation, and end-tissue destruction. To assess the therapeutic efficacy of systemic anti-inflammatory therapy in this disease, we examined the impact of a nonsteroidal anti-inflammatory drug (NSAID), ketoprofen, and of a soluble TNF-alpha receptor (sTNF-R1) upon tumor necrosis factor (TNF)-alpha activity in a mouse model of acquired lymphedema. METHODS AND FINDINGS: Lymphedema was induced by microsurgical ablation of major lymphatic conduits in the murine tail. Untreated control mice with lymphedema developed significant edema and extensive histopathological inflammation compared to sham surgical controls. Short-term ketoprofen treatment reduced tail edema and normalized the histopathology while paradoxically increasing TNF-alpha gene expression and cytokine levels. Conversely, sTNF-R1 treatment increased tail volume, exacerbated the histopathology, and decreased TNF-alpha gene expression. Expression of vascular endothelial growth factor-C (VEGF-C), which stimulates lymphangiogenesis, closely correlated with TNF-alpha expression. CONCLUSIONS: Ketoprofen therapy reduces experimental post-surgical lymphedema, yet direct TNF-alpha inhibition does not. Reducing inflammation while preserving TNF-alpha activity appears to optimize the repair response. It is possible that the observed favorable responses, at least in part, are mediated through enhanced VEGF-C signaling.
Overview
The claims and statistics of this paper haven’t been checked yet.
Run the check — free, no account needed. It reads the open-access text and checks the sources it cites.
Integrity signals
Registry
Cites
Statistics
Figures
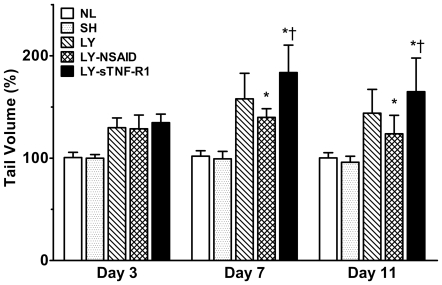
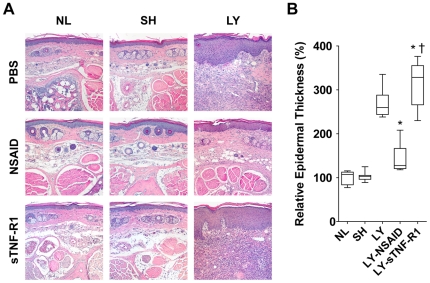
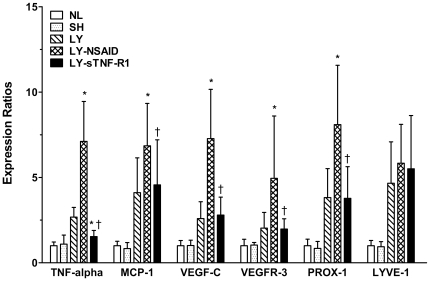
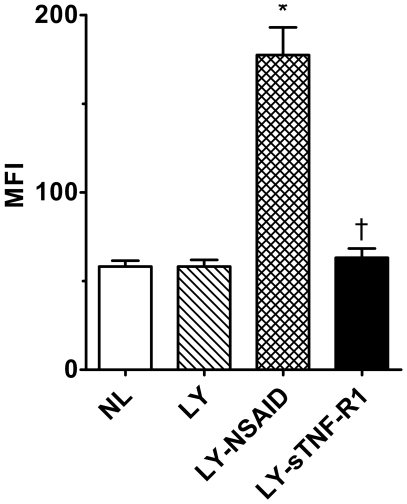
Verification
Claims the paper makes
The claims and statistics of this paper haven’t been checked yet.
Run the check — free, no account needed. It reads the open-access text and checks the sources it cites.
Claims other papers make about this one
Each is checked against this paper’s own text: does it say what the citing paper says it does?
The cited source says what the claim attributes to it.
In the citing paper
“The nonsteroidal anti-inflammatory drug ketoprofen (148) and the leukotriene B4 (LTB4) inhibitor bestatin (44) showed promise in their respective mouse studies, but neither clinical trial produced limb volume reduction in lymphedema patients (trial identifiers NCT02257970, NCT02700529).”
From Transport and Immune Functions of the Lymphatic System. (2025) · cites this paper as [148]
Self-check
Percentages, sums and reported differences re-computed from the paper’s own numbers.
The self-check needs the paper’s full text.
Citations
Cites
Identifying biological themes within lists of genes with EASE
Hosack, D. A., Dennis, G., Sherman, B. T., Lane, H. C., & Lempicki, R. A. (2003) · Genome biology · doi:10.1186/gb-2003-4-10-r70 · Cited by 1,961
VEGF-D promotes the metastatic spread of tumor cells via the lymphatics
Stacker, S. A., Caesar, C., Baldwin, M. E., Thornton, G. E., Williams, R. A., Prevo, R., Jackson, D. G., Nishikawa, S., Kubo, H., & Achen, M. G. (2001) · Nature Medicine · doi:10.1038/84635 · Cited by 1,249
Vascular endothelial growth factor‐C‐mediated lymphangiogenesis promotes tumour metastasis
Mandriota, S. J., Jussila, L., Jeltsch, M., Compagni, A., Baetens, D., Prevo, R., Banerji, S., Huarte, J., Montesano, R., Jackson, D. G., et al. (2001) · The EMBO Journal · doi:10.1093/emboj/20.4.672 · Cited by 983
Rockson, S. G. (2001) · The American Journal of Medicine · doi:10.1016/s0002-9343(00)00727-0 · Cited by 472
Self-citationRistimaki, A. P., Narko, K., Enholm, B., Joukov, V., & Alitalo, K. K. (1998) · Journal of Biological Chemistry · doi:10.1074/jbc.273.14.8413 · Cited by 404
Skobe, M., Hamberg, L. M., Hawighorst, T., Schirner, M., Wolf, G. L., Alitalo, K. K., & Detmar, M. J. (2001) · American Journal Of Pathology · doi:10.1016/s0002-9440(10)61765-8 · Cited by 396
Renz, H., Gong, J., Schmidt, A. S., Nain, M., & Gemsa, D. (1988) · The Journal of Immunology · doi:10.4049/jimmunol.141.7.2388 · Cited by 391
Anti-Cytokine Therapy for Rheumatoid Arthritis
Maini, R. N., & Taylor, P. C. (2000) · Annual Review of Medicine · doi:10.1146/annurev.med.51.1.207 · Cited by 375
Novel Role for the Potent Endogenous Inotrope Apelin in Human Cardiac Dysfunction
Chen, M. M., Ashley, E. A., Deng, D. X.-F., Tsalenko, A., Deng, A. C., Tabibiazar, R., Ben‐Dor, A., Fenster, B. E., Yang, E., King, J. Y., et al. (2003) · Circulation · doi:10.1161/01.cir.0000091235.94914.75 · Cited by 352
Identifying biological themes within lists of genes with EASE
Hosack, D. A., Dennis, G., Sherman, B. T., Lane, H. C., & Lempicki, R. A. (2003) · Genome biology · doi:10.1186/gb-2003-4-6-p4 · Cited by 272
Cited by
Sorted by citations
New developments in clinical aspects of lymphatic disease
Mortimer, P. S., & Rockson, S. G. (2014) · Journal of Clinical Investigation · doi:10.1172/jci71608 · Cited by 356
Self-citationLymphatic Vessel Network Structure and Physiology
Breslin, J. W., Yang, Y., Scallan, J. P., Sweat, R. S., Adderley, S., & Murfee, W. L. (2018) · Comprehensive physiology · doi:10.1002/cphy.c180015 · Cited by 420
Avraham, T., Zampell, J. C., Yan, A., Elhadad, S., Weitman, E. S., Rockson, S. G., Bromberg, J., & Mehrara, B. J. (2013) · The FASEB Journal · doi:10.1096/fj.12-222695 · Cited by 241
Self-citationCD4+ cells regulate fibrosis and lymphangiogenesis in response to lymphatic fluid stasis
Zampell, J. C., Yan, A., Elhadad, S., Avraham, T., Weitman, E., & Mehrara, B. J. (2012) · PLoS ONE · doi:10.1371/journal.pone.0049940 · Cited by 235
Cancer-associated secondary lymphoedema
Rockson, S. G., Keeley, V. L., Kilbreath, S. L., Szuba, A., & Towers, A. (2019) · Nature Reviews Disease Primers · doi:10.1038/s41572-019-0072-5 · Cited by 230
Self-citationSurgical Treatment of Lymphedema
Schaverien, M. V., & Coroneos, C. J. (2019) · Plastic & Reconstructive Surgery · doi:10.1097/prs.0000000000005993 · Cited by 208
Lymphedema: Surgical and Medical Therapy
Chang, D. W., Masià, J., Garza, R., Skoracki, R. J., & Neligan, P. C. (2016) · Plastic & Reconstructive Surgery · doi:10.1097/prs.0000000000002683 · Cited by 205
Leukotriene B 4 antagonism ameliorates experimental lymphedema
Tian, W., Rockson, S. G., Jiang, X., Kim, J., Begaye, A., Shuffle, E. M., Tu, A. B., Cribb, M., Nepiyushchikh, Z., Feroze, A. H., et al. (2017) · Science Translational Medicine · doi:10.1126/scitranslmed.aal3920 · Cited by 173
Self-citationThe Unresolved Pathophysiology of Lymphedema
Azhar, S. H., Lim, H. Y., Tan, B., & Angeli, V. (2020) · Frontiers in Physiology · doi:10.3389/fphys.2020.00137 · Cited by 186
Pilot studies demonstrate the potential benefits of antiinflammatory therapy in human lymphedema
Rockson, S. G., Tian, W., Jiang, X., Kuznetsova, T., Haddad, F., Zampell, J. C., Mehrara, B. J., Sampson, J. P., Roche, L., Kim, J., et al. (2018) · JCI Insight · doi:10.1172/jci.insight.123775 · Cited by 140
Self-citationMcLaughlin, S. A., Staley, A. C., Vicini, F. A., Thiruchelvam, P. T. R., Hutchison, N. A., Mendez, J. E., MacNeill, F. A., Rockson, S. G., DeSnyder, S. M., Klimberg, S., et al. (2017) · Annals of Surgical Oncology · doi:10.1245/s10434-017-5982-4 · Cited by 134
Self-citationLymphatic Dysfunction, Leukotrienes, and Lymphedema
Jiang, X., Nicolls, M. R., Tian, W., & Rockson, S. G. (2017) · Annual Review of Physiology · doi:10.1146/annurev-physiol-022516-034008 · Cited by 133
Self-citationRockson, S. G. (2021) · Circulation Research · doi:10.1161/circresaha.121.318307 · Cited by 130
Self-citationOgata, F., Fujiu, K., Matsumoto, S., Nakayama, Y., Shibata, M., Oike, Y., Koshima, I., Watabe, T., Nagai, R., & Manabe, I. (2015) · Journal of Investigative Dermatology · doi:10.1016/j.jid.2015.12.001 · Cited by 119
Regulatory T cell transfer ameliorates lymphedema and promotes lymphatic vessel function
Gousopoulos, E., Proulx, S. T., Bachmann, S. B., Scholl, J., Dionyssiou, D. D., Demiri, E. C., Halin, C., Dieterich, L. C., & Detmar, M. J. (2016) · JCI Insight · doi:10.1172/jci.insight.89081 · Cited by 97
The vicious circle of stasis, inflammation, and fibrosis in lymphedema
Brown, S., Dayan, J. H., Kataru, R. P., & Mehrara, B. J. (2023) · Plastic & Reconstructive Surgery · doi:10.1097/prs.0000000000009866 · Cited by 93
Fibrosis and secondary lymphedema: chicken or egg?
Kataru, R. P., Wiser, I., Baik, J. E., Park, H. J., Rehal, S., Shin, J. Y., & Mehrara, B. J. (2019) · Translational research · doi:10.1016/j.trsl.2019.04.001 · Cited by 91
Histopathologic Features of Lymphedema: A Molecular Review
Li, C. Y., Kataru, R. P., & Mehrara, B. J. (2020) · International Journal of Molecular Sciences · doi:10.3390/ijms21072546 · Cited by 89
Bowman, C., & Rockson, S. G. (2024) · International Journal of Molecular Sciences · doi:10.3390/ijms25073907 · Cited by 77
Self-citationChen, Y., Rehal, S., Roizes, S., Zhu, H., Cole, W. C., & von der Weid, P. (2017) · Microcirculation · doi:10.1111/micc.12364 · Cited by 59
Current concepts and future directions in the diagnosis and management of lymphatic vascular disease
Rockson, S. G. (2010) · Vascular Medicine · doi:10.1177/1358863x10364553 · Cited by 58
Self-citationMehrara, B. J., Park, H. J., Kataru, R. P., Bromberg, J., Coriddi, M. R., Baik, J. E., Shin, J., Li, C., Cavalli, M. R., Encarnacion, E. M., et al. (2021) · Biology · doi:10.3390/biology10090934 · Cited by 55
Brix, B., Šerý, O., Onorato, A., Ure, C., Roessler, A., & Goswami, N. (2021) · Biology · doi:10.3390/biology10040261 · Cited by 55
Role of COX-2 in lymphangiogenesis and restoration of lymphatic flow in secondary lymphedema
Kashiwagi, S., Hosono, K., Suzuki, T., Takeda, A., Uchinuma, E., & Majima, M. (2011) · Laboratory Investigation · doi:10.1038/labinvest.2011.84 · Cited by 54
Deng, J. F., Ridner, S. H., Murphy, B. A., & Dietrich, M. S. (2011) · Supportive Care in Cancer · doi:10.1007/s00520-011-1294-6 · Cited by 54
Liao, J., Zhang, M., Shi, Z., Lu, H., Wang, L., Fan, W., Tong, X., & Yan, H. (2022) · Journal of Neurotrauma · doi:10.1089/neu.2022.0150 · Cited by 53
Lin, S., Kim, J., Lee, M., Roche, L., Yang, N. L., Tsao, P. S., & Rockson, S. G. (2012) · PLoS ONE · doi:10.1371/journal.pone.0052021 · Cited by 52
Self-citationBreslin, J. W. (2011) · Lymphatic Research and Biology · doi:10.1089/lrb.2010.0016 · Cited by 47
Current Understanding of Pathological Mechanisms of Lymphedema
Sung, C., Wang, S., Hsu, J. F., Yu, R. P., & Wong, A. K. (2021) · Advances in Wound Care · doi:10.1089/wound.2021.0041 · Cited by 52
Molecular pathophysiology of secondary lymphedema
Lee, S., & Kim, I. (2024) · Frontiers in Cell and Developmental Biology · doi:10.3389/fcell.2024.1363811 · Cited by 48
Pharmacological Treatment of Secondary Lymphedema
Brown, S., Dayan, J. H., Coriddi, M. R., Campbell, A.-C., Kuonqui, K. G., Shin, J., Park, H. J., Mehrara, B. J., & Kataru, R. P. (2022) · Frontiers in Pharmacology · doi:10.3389/fphar.2022.828513 · Cited by 44
Lymphatic Valves and Lymph Flow in Cancer-Related Lymphedema
Iyer, D., Jannaway, M., Yang, Y., & Scallan, J. P. (2020) · Cancers · doi:10.3390/cancers12082297 · Cited by 43
Transport and Immune Functions of the Lymphatic System.
Davis, M. J., Zawieja, S. D., & King, P. D. (2025) · Annual Review of Physiology · doi:10.1146/annurev-physiol-022724-104908 · Cited by 42
Harding, J. S., Ritter, A., Rayasam, A., Fábry, Z., & Sándor, M. (2015) · American Journal Of Pathology · doi:10.1016/j.ajpath.2014.09.020 · Cited by 42
Kwon, S., Agollah, G. D., Wu, G., & Sevick-Muraca, E. M. (2014) · PLoS ONE · doi:10.1371/journal.pone.0106034 · Cited by 39
Animal Models of Secondary Lymphedema: New Approaches in the Search for Therapeutic Options
Hadrian, R., & Palmes, D. (2017) · Lymphatic Research and Biology · doi:10.1089/lrb.2016.0015 · Cited by 40
Lymphedema: Diagnosis and Treatment
Neligan, P. C. (2022) · Springer eBooks · doi:10.1007/978-3-030-82335-1_27 · Cited by 40
DeMarco, G. J., & Nunamaker, E. A. (2019) · Comparative Medicine · doi:10.30802/aalas-cm-19-000041 · Cited by 39
The Future of Lymphedema: Potential Therapeutic Targets for Treatment
Brown, S., Campbell, A.-C., Kuonqui, K. G., Sarker, A., Park, H. J., Shin, J., Kataru, R. P., Coriddi, M. R., Dayan, J. H., & Mehrara, B. J. (2023) · Current Breast Cancer Reports · doi:10.1007/s12609-023-00491-5 · Cited by 39
Cromer, W. E., Wang, W. J., Zawieja, S. D., von der Weid, P., Newell‐Rogers, M. K., & Zawieja, D. C. (2015) · Inflammatory Bowel Diseases · doi:10.1097/mib.0000000000000402 · Cited by 37
Drug-Related Lymphedema: Mysteries, Mechanisms, and Potential Therapies
Pal, S., Rahman, J., Mu, S., Rusch, N. J., & Stolarz, A. J. (2022) · Frontiers in Pharmacology · doi:10.3389/fphar.2022.850586 · Cited by 32
Nelson, T. S., Akin, R. E., Weiler, M. J., Kassis, T., Kornuta, J. A., & Dixon, J. B. (2014) · American Journal of Physiology-Regulatory, Integrative and Comparative Physiology · doi:10.1152/ajpregu.00369.2013 · Cited by 31
Therapeutic Lymphangiogenesis Is a Promising Strategy for Secondary Lymphedema
Shimizu, Y., Che, Y., & Murohara, T. (2023) · International Journal of Molecular Sciences · doi:10.3390/ijms24097774 · Cited by 30
Surgical Treatment of Primary Lymphedema
Lee, J. H., & Chang, D. W. (2017) · Lymphatic Research and Biology · doi:10.1089/lrb.2017.0007 · Cited by 28
Kotańska, M., Szafarz, M., Mika, K., Dziubina, A., Bednarski, M., Müller, C. E., Sapa, J., & Kieć‐Kononowicz, K. (2020) · Biomedicine & Pharmacotherapy · doi:10.1016/j.biopha.2020.111164 · Cited by 28
Emerging Anti-Inflammatory Pharmacotherapy and Cell-Based Therapy for Lymphedema
Ogino, R., Yokooji, T., Hayashida, M., Suda, S., Yamakawa, S., & Hayashida, K. (2022) · International Journal of Molecular Sciences · doi:10.3390/ijms23147614 · Cited by 28
Pivetta, E., Wassermann, B., Belluz, L. D. B., Danussi, C., Modica, T. M. E., Maiorani, O., Bosisio, G., Boccardo, F. M., Canzonieri, V., Colombatti, A., et al. (2016) · Clinical Science · doi:10.1042/cs20160064 · Cited by 26
Lee, Y., Zawieja, S. D., & Muthuchamy, M. (2022) · Frontiers in Pharmacology · doi:10.3389/fphar.2022.848088 · Cited by 24
Adrenomedullin Haploinsufficiency Predisposes to Secondary Lymphedema
Nikitenko, L. L., Shimosawa, T., Henderson, S. R., Mäkinen, T., Shimosawa, H., Qureshi, U., Pedley, R. B., REES, M. C. P., Fujita, T., & Boshoff, C. (2013) · Journal of Investigative Dermatology · doi:10.1038/jid.2013.47 · Cited by 24
Topical captopril: a promising treatment for secondary lymphedema
Brown, S., Nores, G. D. G., Sarker, A., Ly, C. L., Li, C., Park, H. J., Hespe, G. E., Gardenier, J. C., Kuonqui, K. G., Campbell, A.-C., et al. (2023) · Translational research · doi:10.1016/j.trsl.2023.01.005 · Cited by 23
Mendez, U., Stroup, E. M., Lynch, L. L., Waller, A. B., & Goldman, J. (2012) · American Journal of Physiology-Heart and Circulatory Physiology · doi:10.1152/ajpheart.00522.2012 · Cited by 23
Brown, S., Tadros, A. B., Montagna, G., Bell, T., Crowley, F., Gallagher, E. J., & Dayan, J. H. (2024) · Frontiers in Pharmacology · doi:10.3389/fphar.2024.1457363 · Cited by 23
Cribb, M. T., Sestito, L. F., Rockson, S. G., Nicolls, M. R., Thomas, S. N., & Dixon, J. B. (2021) · International Journal of Molecular Sciences · doi:10.3390/ijms22094455 · Cited by 19
Self-citationSestito, L. F., To, K., Cribb, M. T., Archer, P. A., Thomas, S. N., & Dixon, J. B. (2023) · Science Advances · doi:10.1126/sciadv.abq0435 · Cited by 20
Pharmacotherapy Agents in Lymphedema Treatment: A Systematic Review
Forte, A. J., Boczar, D., Huayllani, M. T., Lu, X., & McLaughlin, S. A. (2019) · Cureus · doi:10.7759/cureus.6300 · Cited by 17
The microenvironment of secondary lymphedema. The key to finding effective treatments?
Hossain, L., Gomes, K. P., Safarpour, S., & Gibson, S. B. (2025) · Biochimica et Biophysica Acta (BBA) - Molecular Basis of Disease · doi:10.1016/j.bbadis.2025.167677 · Cited by 17
Si, H., Wang, J., Meininger, C. J., Peng, X., Zawieja, D. C., & Zhang, S. L. (2020) · American Journal of Physiology-Heart and Circulatory Physiology · doi:10.1152/ajpheart.00544.2019 · Cited by 16
Walker, J., Tanna, S., Roake, J., & Lyons, O. (2021) · Journal of Vascular Surgery Venous and Lymphatic Disorders · doi:10.1016/j.jvsv.2021.09.004 · Cited by 15
Intestinal Lymphatic Dysfunction in Kidney Disease
Zhong, J., Kirabo, A., Yang, H., Fogo, A. B., Shelton, E. L., & Kon, V. (2023) · Circulation Research · doi:10.1161/circresaha.122.321671 · Cited by 15
Chen, Z., Ghavimi, S. A. A., Wu, M., McNamara, J., Barreiro, O., Maridas, D. E., Kratchmarov, R., Siegel, A., Djeddi, S., Gutiérrez‐Arcelus, M., et al. (2023) · JCI Insight · doi:10.1172/jci.insight.165324 · Cited by 15
New and Emerging Treatments for Lymphedema
Aldrich, M. B., & Schaverien, M. V. (2018) · Seminars in Plastic Surgery · doi:10.1055/s-0038-1632403 · Cited by 15
Wei, M., Wang, L., Liu, X., Deng, Y., Yang, S., Pan, W., Zhang, X., Xu, G., Xiao, S., & Deng, C. (2024) · Plastic & Reconstructive Surgery · doi:10.1097/prs.0000000000011363 · Cited by 17
Yiannakopoulou, E. C. (2011) · The Journal of Clinical Pharmacology · doi:10.1177/0091270011431066 · Cited by 14
Bertelli, M., Kiani, A. K., Paolacci, S., Manara, E., Dautaj, A., Beccari, T., & Michelini, S. (2019) · Journal of Biotechnology · doi:10.1016/j.jbiotec.2019.11.017 · Cited by 14
Therapeutic Potential of Mesenchymal Stem Cells for Postmastectomy Lymphedema: A Literature Review
Chen, K., Sinelnikov, M. Y., Reshetov, I. V., Timashev, P. S., Gu, Y., Mu, L., Lu, P., & Zhang, Y. (2020) · Clinical and Translational Science · doi:10.1111/cts.12864 · Cited by 15
Real‐time in vivo imaging collagen in lymphedematous skin using multiphoton microscopy
Wu, X., Zhuo, S., Chen, J., & Liu, N. (2011) · Scanning · doi:10.1002/sca.20266 · Cited by 12
Hyaluronidase treatment of acute lymphedema in a mouse tail model.
Jeong, H. J., Roh, K., Kim, G. C., Kim, Y. O., Lee, J. H., Lee, M. J., & Sim, Y.-J. (2013) · PubMed · Cited by 12
Nakagawa, A., Fujimoto, H., Nagashima, T., Sangai, T., Takada, M., Masuda, T., Teranaka, R., Ota, S., Matsushima, J., Akita, S., et al. (2019) · Breast Cancer · doi:10.1007/s12282-019-00996-x · Cited by 11
Lee, S., Lee, B., Kim, Y.-H., Min, S., Yang, E. J., & Lee, S.-M. (2021) · Nutrients · doi:10.3390/nu13093253 · Cited by 11
Mechanics of Lymphatic Pumping and Lymphatic FunctionPreprint
Razavi, M. S., Munn, L. L., & Padera, T. P. (2024) · Cold Spring Harbor Perspectives in Medicine · doi:10.1101/cshperspect.a041171 · Cited by 11
Biologically active lipids in the regulation of lymphangiogenesis in disease states
Majima, M., Hosono, K., Ito, Y., & Amano, H. (2021) · Pharmacology & Therapeutics · doi:10.1016/j.pharmthera.2021.108011 · Cited by 11
Spörlein, A., Hirche, C. R., Berner, J. E., Kneser, U., & Will, P. A. (2024) · Plastic & Reconstructive Surgery Global Open · doi:10.1097/gox.0000000000005906 · Cited by 8
Dietary supplements in lymphedema
Bonetti, G., Dhuli, K., Michelini, S., Michelini, S., Michelini, S., Ricci, M., Cestari, M., & Bertelli, M. (2022) · Journal of preventive medicine and hygiene · doi:10.15167/2421-4248/jpmh2022.63.2s3.2761 · Cited by 8
Clinical Relevance of Animal Models of Lymphatic Dysfunction and Lymphedema
Podder, P. S., Bhadra, D., Pal, S., Klimberg, V. S., & Stolarz, A. J. (2025) · Microcirculation · doi:10.1111/micc.70009 · Cited by 10
Frontiers in Oncologic Reconstruction
Samra, F., Sobti, N., Nelson, J. A., Allen, R. J., Mehrara, B. J., & Dayan, J. H. (2019) · Plastic & Reconstructive Surgery Global Open · doi:10.1097/gox.0000000000002181 · Cited by 8
Park, H. S., Song, Y., Lee, J., Oh, K.-R., Park, H., & Kang, H. G. (2024) · Molecular Biology Reports · doi:10.1007/s11033-024-10149-9 · Cited by 6
Metformin Use and Risk of Breast Cancer-Related Lymphedema: A Retrospective Analysis
Rubin, J., Pollack, B. L., Coleman-Belin, J. C., Campbell, A.-C., Roberts, A., Wagner, B. D., Kataru, R. P., Boe, L. A., Barrio, A. V., & Mehrara, B. J. (2025) · Journal of the American College of Surgeons · doi:10.1097/xcs.0000000000001434 · Cited by 6
Lymphedema and Lymphatic-dependent Immune Dysfunction
Tian, W., & Jiang, X. (2014) · Journal of Clinical & Cellular Immunology · doi:10.4172/2155-9899.1000249 · Cited by 4
Proteomic profiling of lymphedema development in mouse model
Lee, J., Song, H., Roh, K., Cho, S., Lee, S., Yeom, C., & Park, S. (2016) · Cell Biochemistry and Function · doi:10.1002/cbf.3192 · Cited by 4
Mehrara, B. J., Coriddi, M. R., Dayan, J. H., & Kataru, R. P. (2021) · Elsevier eBooks · doi:10.1016/b978-0-323-65381-7.00044-7 · Cited by 4
Pathophysiology and Molecular Research in Lymphedema
Kiwanuka, E., & Mehrara, B. J. (2022) · Springer eBooks · doi:10.1007/978-3-030-93039-4_3 · Cited by 5
Subcutaneous administration of ketoprofen delays Ehrlich solid tumor growth in mice
de Souza, C. M., Auler, P. A., dos Reis, D. C., Lavalle, G. E., Ferreira, E. F., & Cassali, G. D. (2014) · Arquivo Brasileiro de Medicina Veterinária e Zootecnia · doi:10.1590/1678-6729 · Cited by 4
Lymphatic pumping and pathological consequences of its dysfunction
Stephens, M., & von der Weid, P. (2019) · Elsevier eBooks · doi:10.1016/b978-0-12-815645-2.00003-4 · Cited by 4
Genetics and lymphoedema: a future yet to be fully discovered
Cooper, G. (2016) · British Journal of Community Nursing · doi:10.12968/bjcn.2017.22.1.646 · Cited by 4
Chen, Z., Yao, Z. Q., Wu, M., Wu, Y., Zhang, J., Liao, Z., Qian, J., Wei, J., Song, L., Yu, L., et al. (2025) · Journal of Orthopaedic Translation · doi:10.1016/j.jot.2025.08.014 · Cited by 3
Zhang, Y., Qiu, T., Yang, C., Zhou, J., Yang, M. J., Gong, X., Zhang, Z., Lan, Y., Zhang, X., Chen, S., et al. (2025) · Frontiers in Pediatrics · doi:10.3389/fped.2025.1480213 · Cited by 2
Therapeutic Management of Breast Cancer Related Upper Limb Lymphedema
Grosu-Bularda, A., Flavia Francesca, L. I. T. A., SERBAN, A., HODEA, F. V., Stoian, A., Lascăr, I., & Teodoreanu, R. N. (2021) · Medicina Moderna - Modern Medicine · doi:10.31689/rmm.2021.28.4.367 · Cited by 2
Lymphatic biology and medicine
Jiang, X., Tian, W., Nicolls, M. R., & Rockson, S. G. (2022) · Elsevier eBooks · doi:10.1016/b978-0-12-822546-2.00009-5 · Cited by 2
Self-citationKeratinocytes coordinate inflammatory responses and regulate development of secondary lymphedemaPreprint
Park, H. J., Kataru, R. P., Shin, J., Nores, G. D. G., Encarnacion, E. M., Klang, M. G., Riedel, E., Coriddi, M. R., Dayan, J. H., & Mehrara, B. J. (2023) · bioRxiv (Cold Spring Harbor Laboratory) · doi:10.1101/2023.01.20.524936 · Cited by 3
Breast Cancer-Related Lymphedema: A Review of Management and Innovative Surgical Techniques
Newsom, K. D., Xiang, D. H., Yang, A., Copeland‐Halperin, L. R., Weiss, A. C., & Broyles, J. M. (2022) · Medical Research Archives · doi:10.18103/mra.v10i10.3245 · Cited by 1
Hansen, F. G., Jørgensen, M. G., Ingwersen, K. G., Kjær, C., Carstensen, L. F., Tambour, M., Gram, B., Thomsen, J. B., & Sørensen, J. A. (2025) · Cancers · doi:10.3390/cancers17233753 · Cited by 2
Lommer, C., Schroeder, L., Amato, C., Dhakal, K., Kotian, C., Quiroga, D. M., Paskett, E. D., Fu, M. R., McAlearney, A. S., Collins, S., et al. (2026) · Frontiers in Oncology · doi:10.3389/fonc.2026.1751628 · Cited by 1
Critical role of keratinocytes and protease‐activated receptor 2 in secondary lymphedema development
Park, H. J., Pal, S., Chen, X., Shin, J., Nores, G. D. G., Baik, J. E., Stull-Lane, A. R., Book, A. J., Clement, C. C., Encarnacion, E. M., et al. (2026) · Clinical and Translational Medicine · doi:10.1002/ctm2.70682 · Cited by 1
Pathophysiology and Molecular Research in Lymphedema
Mehrara, B. J., Dayan, J. H., Coriddi, M. R., & Kataru, R. P. (2021) · Elsevier eBooks · doi:10.1016/b978-0-323-69418-6.00004-4 · Cited by 1
Effect of Goreisan, a Traditional Japanese Medicine, on Rat Hindlimb Lymphedema
Kawakami, Z., Matsubara, Y., Ogura, K., Imamura, S., Iizuka, S., Zhang, N., Matsumoto, C., & Fujitsuka, N. (2024) · Biological and Pharmaceutical Bulletin · doi:10.1248/bpb.b23-00829 · Cited by 1
Investigative strategies on lymphatic vessel modulation for treating lymphedema in future medicine
Kataru, R. P., Mehrara, B. J., & Kim, H. (2018) · Precision and Future Medicine · doi:10.23838/pfm.2018.00142 · Cited by 1
New and Emerging Therapies for Lymphedema: Part I
Wong, A. K., & Raghuram, A. C. (2022) · Springer eBooks · doi:10.1007/978-3-030-93039-4_26 · Cited by 1
Correction: CD4+ Cells Regulate Fibrosis and Lymphangiogenesis in Response to Lymphatic Fluid Stasis
Zampell, J. C., Yan, A., Elhadad, S., Avraham, T., Weitman, E. S., & Mehrara, B. J. (2013) · PLoS ONE · doi:10.1371/annotation/158f757f-7d51-40b8-a3a4-550811bf0267 · Cited by 1
Cyperus rotundus root extract inhibits progress of lymphedema in mouse tail modelPreprint
Pandey, N., Mishra, P., & Tripathi, Y. B. (2021) · bioRxiv (Cold Spring Harbor Laboratory) · doi:10.1101/2021.10.15.464519 · Cited by 1
Strategies in Modulating Lymphedema
Chang, J., Joshua, H., Jain, S. K., & Dimitri, T. (2012) · InTech eBooks · doi:10.5772/35799
Metadata
- Authors
- Nakamura, K., Radhakrishnan, K., Wong, Y. M., & Rockson, S. G.
- Affiliations
- Stanford Medicine (US)
- Corresponding author
- Rockson, Stanley G.
- Venue
- PLoS ONE
- Publisher
- Public Library of Science (PLoS)
- Published
- 2009-12-21
- Volume
- 4
- Issue
- 12
- Pages
- e8380
- ISSN
- 1932-6203 (ISSN-L)
- PMC
- PMC2791214
- OpenAlex
- W1988070199
- Cited by
- 118
- References
- 47
- Citations by year
- 2026: 6 · 2025: 9 · 2024: 9 · 2023: 7 · 2022: 15 · 2021: 12 · 2020: 6 · 2019: 10 · 2018: 4 · 2017: 9 · 2016: 5 · 2015: 4 · 2014: 6 · 2013: 3 · 2012: 5
- FWCI
- 2.00
- Type
- journal article
- Language
- en
- Open access
- gold
- doi.org
- Locations
- PLoS ONE (publishedVersion, cc-by)
- PubMed Central (publishedVersion, cc-by)
- PubMed (publishedVersion)
- DOAJ (DOAJ: Directory of Open Access Journals) (submittedVersion)
- Funders
- Susan G. Komen for the Cure
- American Heart Association
- Amgen
- Topics
- Health Sciences › Medicine › Oncology › Lymphatic System and Diseases
- Health Sciences › Medicine › Surgery › Lymphatic Disorders and Treatments
- Health Sciences › Medicine › Infectious Diseases › Parasitic Diseases Research and Treatment
- Keywords
- ketoprofen, lymphedema, nonsteroidal anti-inflammatory drugs, TNF-α, VEGF-C, lymphangiogenesis, inflammation
- MeSH terms
- Animals, Anti-Inflammatory Agents, Anti-Inflammatory Agents, Non-Steroidal, Gene Expression Regulation, Ketoprofen, Lymphedema, Organ Specificity, Solubility, Cytokines, Models, Immunological, Inflammation Mediators, Reverse Transcriptase Polymerase Chain Reaction, Lymphatic Vessels, Receptors, Tumor Necrosis Factor, Type I, Mice
About these checks
Registry, retraction, Cites and statistics results are computed, not judged, with one exception: a printed reference that no index lists is read once by a model before it counts as a citation error. Claims are extracted by a model and kept only when their quote appears verbatim in the text; each cited source is then checked, with a model’s help, for whether it says what the claim relies on. Those verdicts can be wrong — read the claim’s quote and the cited source before relying on one.
Statistics and arithmetic are recomputed, not judged.
Confidence bands are shown only for fields calibrated on our annotated test set. None is calibrated yet, so no band is shown.
What counts as a claim ›How we measure confidence ›How we check this ›
Are you an author, or do you see a problem with this page? Request a review
