

The DOI matches its Crossref record; 58 of the 58 references it cites were found in a registry or an index.
Notch and Wnt Signaling Mediated Rod Photoreceptor Regeneration by Müller Cells in Adult Mammalian Retina
Open accessAbstract
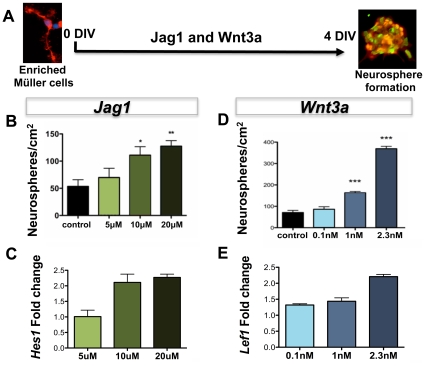
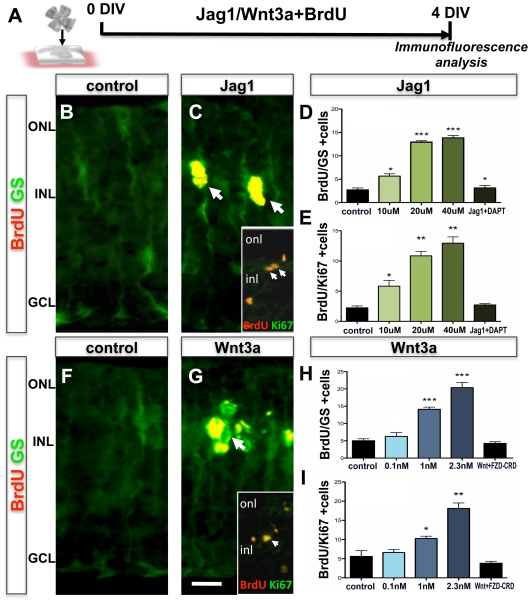
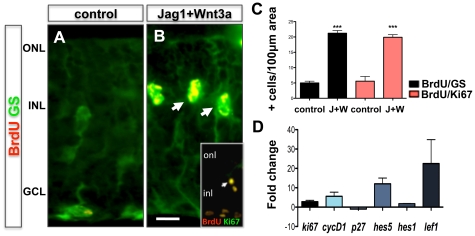
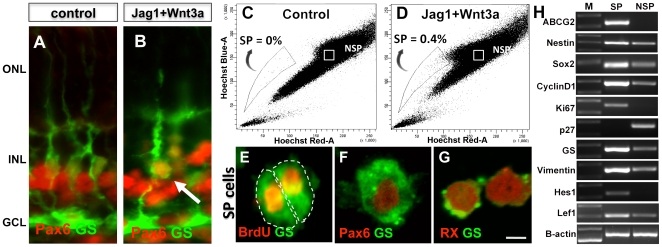
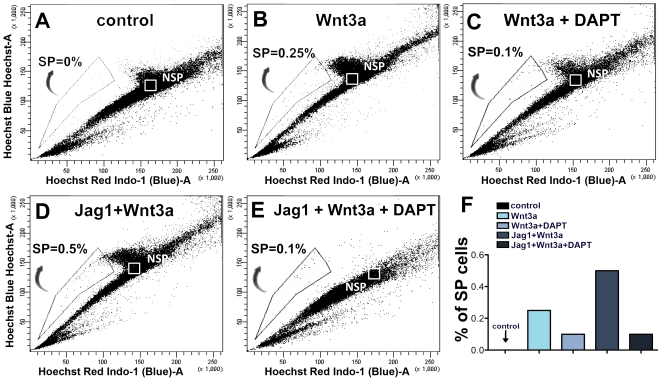
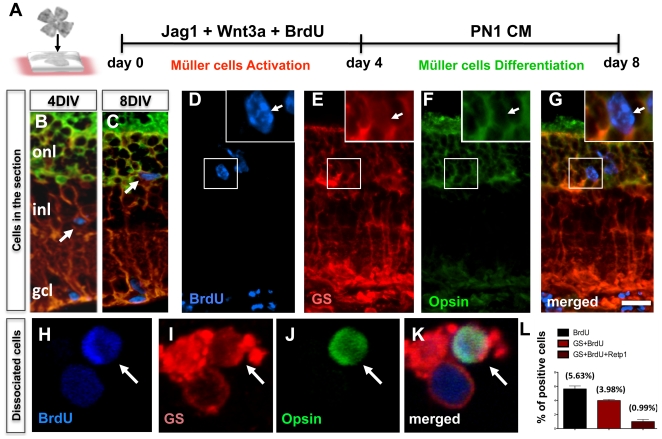
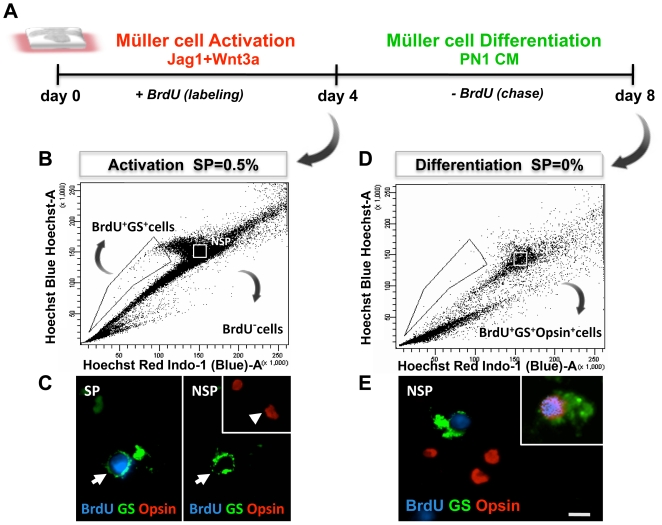
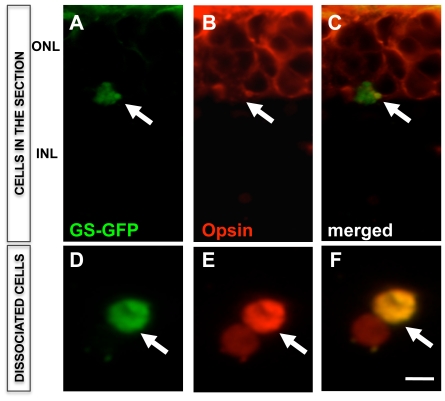
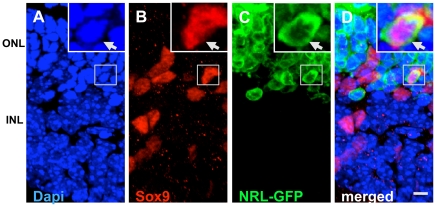
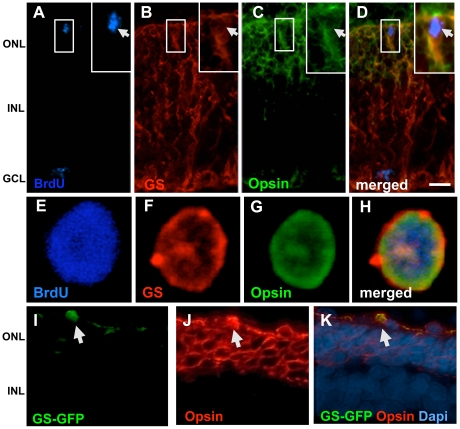
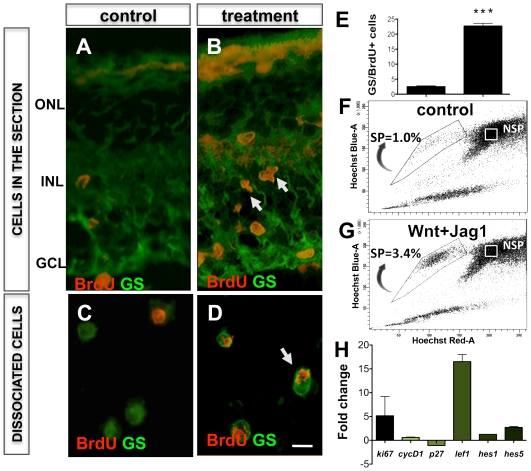
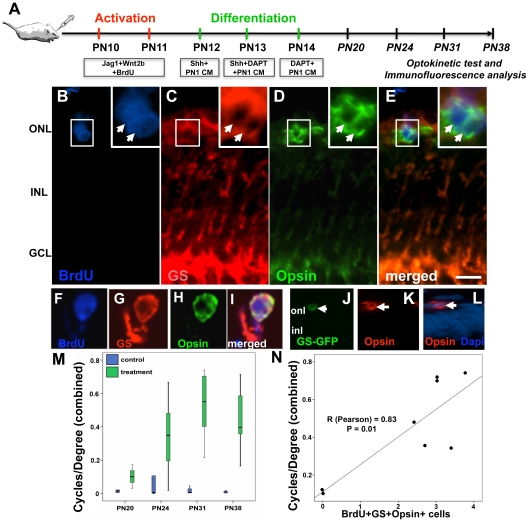
BACKGROUND: Evidence emerging from a variety of approaches used in different species suggests that Müller cell function may extend beyond its role of maintaining retinal homeostasis to that of progenitors in the adult retina. Enriched Müller cells in vitro or those that re-enter cell cycle in response to neurotoxin-damage to retina in vivo display multipotential and self-renewing capacities, the cardinal features of stem cells. METHODOLOGY/PRINCIPAL FINDINGS: We demonstrate that Notch and Wnt signaling activate Müller cells through their canonical pathways and that a rare subset of activated Müller cells differentiates along rod photoreceptor lineage in the outer nuclear layer. The differentiation of activated Müller cells along photoreceptor lineage is confirmed by multiple approaches that included Hoechst dye efflux analysis, genetic analysis using retina from Nrl-GFP mice, and lineage tracing using GS-GFP lentivirus in wild type and rd mice in vitro and S334ter rats in vivo. Examination of S334ter rats for head-neck tracking of visual stimuli, a behavioral measure of light perception, demonstrates a significant improvement in light perception in animals treated to activate Müller cells. The number of activated Müller cells with rod photoreceptor phenotype in treated animals correlates with the improvement in their light perception. CONCLUSION/SIGNIFICANCE: In summary, our results provide a proof of principle for non-neurotoxin-mediated activation of Müller cells through Notch and Wnt signaling toward the regeneration of rod photoreceptors.
Overview
The claims and statistics of this paper haven’t been checked yet.
Run the check — free, no account needed. It reads the open-access text and checks the sources it cites.
Integrity signals
Registry
Cites
Statistics
Figures
Verification
Claims the paper makes
The claims and statistics of this paper haven’t been checked yet.
Run the check — free, no account needed. It reads the open-access text and checks the sources it cites.
Claims other papers make about this one
Each is checked against this paper’s own text: does it say what the citing paper says it does?
In the citing paper
“Notch signaling stimulated proliferation of MG-derived progenitors in birds and mammals”
From HB-EGF is Necessary and Sufficient for Müller Glia Dedifferentiation and Retina Regeneration (2012) · cites this paper as Del Debbio et al., 2010
Self-check
Percentages, sums and reported differences re-computed from the paper’s own numbers.
The self-check needs the paper’s full text.
Citations
Cites
Álvarez-Buylla, A., & Lim, D. A. (2004) · Neuron · doi:10.1016/s0896-6273(04)00111-4 · Cited by 1,348
SOX2 Functions to Maintain Neural Progenitor Identity
Graham, V., Khudyakov, J. I., Ellis, P., & Pevny, L. (2003) · Neuron · doi:10.1016/s0896-6273(03)00497-5 · Cited by 1,344
Retinal repair by transplantation of photoreceptor precursors
MacLaren, R. E., Pearson, R. A., MacNeil, A., Douglas, R. H., Salt, T. E., Akimoto, M., Swaroop, A., Sowden, J. C., & Ali, R. R. (2006) · Nature · doi:10.1038/nature05161 · Cited by 1,108
Goodell, M. A., Rosenzweig, M., Kim, H. L., Marks, D. F., DeMaria, M., Paradis, G. A., Grupp, S. A., Sieff, C. A., Mulligan, R. C., & Johnson, R. P. (1997) · Nature Medicine · doi:10.1038/nm1297-1337 · Cited by 1,086
Nrl is required for rod photoreceptor development
Mears, A. J., Kondo, M., Swain, P. K., Takada, Y., Bush, R. A., Saunders, T. L., Sieving, P. A., & Swaroop, A. (2001) · Nature Genetics · doi:10.1038/ng774 · Cited by 912
Glial cells generate neurons: the role of the transcription factor Pax6
Heins, N., Malatesta, P., Cecconi, F., Nakafuku, M., Tucker, K. L., Hack, M. A., Chapouton, P., Barde, Y.-A., & Götz, M. (2002) · Nature Neuroscience · doi:10.1038/nn828 · Cited by 775
Bernardos, R. L., Barthel, L. K., Meyers, J. R., & Raymond, P. A. (2007) · Journal of Neuroscience · doi:10.1523/jneurosci.1624-07.2007 · Cited by 647
rax, Hes1, and notch1 promote the formation of Müller glia by postnatal retinal progenitor cells.
Furukawa, T., Mukherjee, S., Bao, Z., Morrow, E. M., & Cepko, C. (2000) · Neuron · doi:10.1016/s0896-6273(00)81171-x · Cited by 545
A side order of stem cells: the SP phenotype
Challen, G. A., & Little, M. H. (2006) · Stem Cells · doi:10.1634/stemcells.2005-0116 · Cited by 475
Potential for neural regeneration after neurotoxic injury in the adult mammalian retina
Ooto, S., Akagi, T., Kageyama, R., Akita, J., Mandai, M., Honda, Y., & Takahashi, M. (2004) · Proceedings of the National Academy of Sciences · doi:10.1073/pnas.0402129101 · Cited by 454
Research works printed but not linked: 1
- S Kamakura, 2004, Hes binding to STAT3 mediates crosstalk., betBiol, 6, 547
Cited by
Sorted by citations
Müller glial cell reprogramming and retina regeneration
Goldman, D. J. (2014) · Nature reviews. Neuroscience · doi:10.1038/nrn3723 · Cited by 652
The zebrafish as a model for complex tissue regeneration
Gemberling, M. P., Bailey, T. J., Hyde, D. R., & Poss, K. D. (2013) · Trends in Genetics · doi:10.1016/j.tig.2013.07.003 · Cited by 596
Müller glia: Stem cells for generation and regeneration of retinal neurons in teleost fish
Lenkowski, J. R., & Raymond, P. A. (2014) · Progress in Retinal and Eye Research · doi:10.1016/j.preteyeres.2013.12.007 · Cited by 333
HB-EGF is Necessary and Sufficient for Müller Glia Dedifferentiation and Retina Regeneration
Wan, J., Ramachandran, R., & Goldman, D. (2012) · Developmental Cell · doi:10.1016/j.devcel.2011.11.020 · Cited by 262
“[PubMed: 16949068] Del Debbio CB, Balasubramanian S, Parameswaran S, Chaudhuri A, Qiu F, Ahmad I. Notch and Wnt signaling mediated rod photoreceptor regeneration by Muller cells in adult mammalian retina.”
BackgroundInfluentialASCL1 reprograms mouse Müller glia into neurogenic retinal progenitors
Pollak, J., Wilken, M. S., Ueki, Y., Cox, K. E., Sullivan, J., Taylor, R. J., Levine, E. M., & Reh, T. A. (2013) · Development · doi:10.1242/dev.091355 · Cited by 253
Age‐Related Macular Degeneration: New Paradigms for Treatment and Management of AMD
Hernández-Zimbrón, L. F., Zamora-Alvarado, R., la Paz, L. D. O.-D., Vélez-Montoya, R., Zenteno, E., Gulías-Cañizo, R., Quiroz–Mercado, H., & González-Salinas, R. (2018) · Oxidative Medicine and Cellular Longevity · doi:10.1155/2018/8374647 · Cited by 247
A comparative view of regenerative neurogenesis in vertebrates
Alunni, A., & Bally‐Cuif, L. (2016) · Development · doi:10.1242/dev.122796 · Cited by 189
Reprogramming Müller Glia to Regenerate Retinal Neurons
Lahne, M., Nagashima, M., Hyde, D. R., & Hitchcock, P. F. (2020) · Annual Review of Vision Science · doi:10.1146/annurev-vision-121219-081808 · Cited by 160
β-catenin/Wnt signaling controls progenitor fate in the developing and regenerating zebrafish retina
Meyers, J. R., Hu, L., Moses, A., Kaboli, K., Papandrea, A., & Raymond, P. A. (2012) · Neural Development · doi:10.1186/1749-8104-7-30 · Cited by 144
Cell-Based Therapy for Degenerative Retinal Disease
Zarbin, M. A. (2016) · Trends in Molecular Medicine · doi:10.1016/j.molmed.2015.12.007 · Cited by 154
Conner, C., Ackerman, K. M., Lahne, M., Hobgood, J. S., & Hyde, D. R. (2014) · Journal of Neuroscience · doi:10.1523/jneurosci.0498-14.2014 · Cited by 149
Hamon, A., Roger, J. E., Yang, X.-J., & Perron, M. (2015) · Developmental Dynamics · doi:10.1002/dvdy.24375 · Cited by 139
Cellular strategies for retinal repair by photoreceptor replacement
Jayakody, S. A., Gonzalez-Cordero, A., Ali, R. R., & Pearson, R. A. (2015) · Progress in Retinal and Eye Research · doi:10.1016/j.preteyeres.2015.01.003 · Cited by 133
SOX2 maintains the quiescent progenitor cell state of postnatal retinal Müller glia
Surzenko, N., Crowl, T., Bachleda, A., Langer, L., & Pevny, L. (2013) · Development · doi:10.1242/dev.071878 · Cited by 118
Cell-Based Therapy for Degenerative Retinal Disease
Zarbin, M. A. (2019) · Stem cell biology and regenerative medicine · doi:10.1007/978-3-030-05222-5 · Cited by 106
Jayaram, H., Jones, M. F., Eastlake, K., Cottrill, P. B., Becker, S., Wiseman, J., Khaw, P. T., & Limb, G. A. (2014) · Stem Cells Translational Medicine · doi:10.5966/sctm.2013-0112 · Cited by 106
Miyake, M., Yamashiro, K., Tabara, Y., Suda, K., Morooka, S., Nakanishi, H., Khor, C. C., Chen, P., Qiao, F., Nakata, I., et al. (2015) · Nature Communications · doi:10.1038/ncomms7689 · Cited by 94
Wnt Signaling Promotes Müller Cell Proliferation and Survival after Injury
Liu, B., Hunter, D. J., Rooker, S. M., Chan, A. Y., Paulus, Y. M., Leucht, P., Nusse, Y. M., Nomoto, H., & Helms, J. A. (2012) · Investigative Ophthalmology & Visual Science · doi:10.1167/iovs.12-10774 · Cited by 92
Müller cells as a target for retinal therapy
Devoldere, J., Peynshaert, K., Smedt, S. C. D., & Remaut, K. (2019) · Drug Discovery Today · doi:10.1016/j.drudis.2019.01.023 · Cited by 89
Müller Glia-Mediated Retinal Regeneration
Gao, H., Luodan, A., Huang, X., Chen, X., & Xu, H. (2021) · Molecular Neurobiology · doi:10.1007/s12035-020-02274-w · Cited by 84
Joly, S., Pernet, V., Samardzija, M., & Grimm, C. (2011) · Glia · doi:10.1002/glia.21174 · Cited by 81
Age-dependent Müller glia neurogenic competence in the mouse retina
Loeffler, K., Schäfer, P., Völkner, M., Holdt, T., & Karl, M. (2015) · Glia · doi:10.1002/glia.22846 · Cited by 78
Prospects for the application of Müller glia and their derivatives in retinal regenerative therapies
Eastlake, K., Lamb, W. D. B., Luis, J., Khaw, P. T., Jayaram, H., & Limb, G. A. (2021) · Progress in Retinal and Eye Research · doi:10.1016/j.preteyeres.2021.100970 · Cited by 75
Concise Review: Toward Stem Cell-Based Therapies for Retinal Neurodegenerative Diseases
Bull, N. D., & Martin, K. R. G. (2011) · Stem Cells · doi:10.1002/stem.676 · Cited by 69
Retinal regeneration in birds and mice
Wilken, M. S., & Reh, T. A. (2016) · Current Opinion in Genetics & Development · doi:10.1016/j.gde.2016.05.028 · Cited by 60
The Regulation of Notch Signaling in Retinal Development and Regeneration
Mills, E. A., & Goldman, D. J. (2017) · Current Pathobiology Reports · doi:10.1007/s40139-017-0153-7 · Cited by 57
Müller Glia: A Promising Target for Therapeutic Regeneration
Ahmad, I., Debbio, C. B. D., Das, A. V., & Parameswaran, S. (2011) · Investigative Ophthalmology & Visual Science · doi:10.1167/iovs.11-7308 · Cited by 57
Self-citationRetinal regeneration requires dynamic Notch signaling
Hyde, D. R., Campbell, L. J., Levendusky, J., & Steines, S. (2021) · Neural Regeneration Research · doi:10.4103/1673-5374.327326 · Cited by 49
Insights on the Regeneration Potential of Müller Glia in the Mammalian Retina
Salman, A. M., McClements, M. E., & MacLaren, R. E. (2021) · Cells · doi:10.3390/cells10081957 · Cited by 46
Proliferation Potential of Müller Glia after Retinal Damage Varies between Mouse Strains
Suga, A., Sadamoto, K., Fujii, M., Mandai, M., & Takahashi, M. (2014) · PLoS ONE · doi:10.1371/journal.pone.0094556 · Cited by 45
Multiple intrinsic factors act in concert with Lhx2 to direct retinal gliogenesis
de Melo, J., Clark, B. S., & Blackshaw, S. (2016) · Scientific Reports · doi:10.1038/srep32757 · Cited by 42
Ferretti, P. (2011) · European Journal of Neuroscience · doi:10.1111/j.1460-9568.2011.07833.x · Cited by 45
Lecca, D., Ceruti, S., Fumagalli, M., & Abbracchio, M. P. (2012) · Purinergic Signalling · doi:10.1007/s11302-012-9310-y · Cited by 44
Beyond Genetics: The Role of Metabolism in Photoreceptor Survival, Development and Repair
Hanna, J., David, L. A., Touahri, Y., Fleming, T., Screaton, R. A., & Schuurmans, C. (2022) · Frontiers in Cell and Developmental Biology · doi:10.3389/fcell.2022.887764 · Cited by 45
Rat BMSCs initiate retinal endogenous repair through NGF/TrkA signaling
Jian, Q., Li, Y., & Yin, Z. Q. (2015) · Experimental Eye Research · doi:10.1016/j.exer.2015.01.008 · Cited by 40
Recapitulating developmental mechanisms for retinal regeneration
Ahmad, I., Teotia, P., Erickson, H. E., & Xia, X. (2019) · Progress in Retinal and Eye Research · doi:10.1016/j.preteyeres.2019.100824 · Cited by 42
Self-citationHmga2 regulates self-renewal of retinal progenitors
Parameswaran, S., Xia, X., Hegde, G., & Ahmad, I. (2014) · Development · doi:10.1242/dev.107326 · Cited by 40
Self-citationGene-agnostic therapeutic approaches for inherited retinal degenerations
John, M. C., Quinn, J., Hu, M. L., Cehajic‐Kapetanovic, J., & Xue, K. (2023) · Frontiers in Molecular Neuroscience · doi:10.3389/fnmol.2022.1068185 · Cited by 39
Han, J. W., Lyu, J., Park, Y. J., Jang, S. Y., & Park, T. K. (2015) · Investigative Ophthalmology & Visual Science · doi:10.1167/iovs.15-18359 · Cited by 39
Patel, A. K., Surapaneni, K. R., Yi, H., Nakamura, R. E. I., Karli, S. Z., Syeda, S., Lee, T., & Hackam, A. S. (2014) · Neuropharmacology · doi:10.1016/j.neuropharm.2014.11.015 · Cited by 37
Yu, H., Enayati, S., Chang, K., Cho, K., Lee, S. W., Talib, M., Enayati, K. Z., Xie, J., Achour, H., Fried, S. I., et al. (2020) · Investigative Ophthalmology & Visual Science · doi:10.1167/iovs.61.4.5 · Cited by 36
TNFα activates MAPK and Jak-Stat pathways to promote mouse Müller cell proliferation.
Niu, L., Fang, Y., Yao, X., Zhang, Y., Wu, J., Chen, D. F., & Sun, X. (2021) · Experimental Eye Research · doi:10.1016/j.exer.2020.108353 · Cited by 32
Debbio, C. B. D., Xu, P., Xiong, H., & Ahmad, I. (2013) · BMC Neuroscience · doi:10.1186/1471-2202-14-130 · Cited by 31
Self-citationMobilizing endogenous stem cells for retinal repair
Yu, H., Vu, T. H. K., Cho, K., Guo, C., & Chen, D. F. (2013) · Translational research · doi:10.1016/j.trsl.2013.11.011 · Cited by 31
Angbohang, A., Wu, N., Charalambous, T., Eastlake, K., Lei, Y., Kim, Y. S., Sun, X., & Limb, G. A. (2015) · Stem Cells and Development · doi:10.1089/scd.2015.0262 · Cited by 31
Besser, M., Jagatheaswaran, M., Reinhard, J., Schaffelke, P., & Faissner, A. (2012) · Developmental Biology · doi:10.1016/j.ydbio.2012.05.020 · Cited by 28
Debbio, C. B. D., Mir, Q. A., Parameswaran, S., Mathews, S., Xia, X., Zheng, L. H., Neville, A. J., & Ahmad, I. (2016) · PLoS ONE · doi:10.1371/journal.pone.0152025 · Cited by 28
Self-citationDNA damage response in proliferating Müller glia in the mammalian retina
Nomura-Komoike, K., Saitoh, F., Komoike, Y., & Fujieda, H. (2016) · Investigative Opthalmology & Visual Science · doi:10.1167/iovs.15-18101 · Cited by 25
Zhang, J., Yan, R., Tang, Y.-S., Guo, Y., Chang, Y., Li, J., Wang, Y., & Zhang, J.-Z. (2017) · International Journal of Immunopathology and Pharmacology · doi:10.1177/0394632017740061 · Cited by 25
Spectral domain optical coherence tomography imaging of mucopolysaccharidoses I, II, and VI A
Seok, S., Lyu, I. J., Park, K. A., & Oh, S. Y. (2015) · Graefe s Archive for Clinical and Experimental Ophthalmology · doi:10.1007/s00417-015-2953-y · Cited by 25
Müller cells trophism and pathology as the next therapeutic targets for retinal diseases
Arrigo, A., Cremona, O., Aragona, E., Casoni, F., Consalez, G., Dogru, R. M., Hauck, S. M., Antropoli, A., Bianco, L., Parodi, M. B., et al. (2025) · Progress in Retinal and Eye Research · doi:10.1016/j.preteyeres.2025.101357 · Cited by 27
Jian, Q., Tao, Z., Li, Y., & Yin, Z. Q. (2015) · Vision Research · doi:10.1016/j.visres.2015.01.030 · Cited by 24
Müller glia express rhodopsin in a mouse model of inherited retinal degeneration
Goel, M., & Dhingra, N. K. (2012) · Neuroscience · doi:10.1016/j.neuroscience.2012.08.066 · Cited by 23
De novo neurogenesis by targeted expression of Atoh7 to Müller glia cells
Lust, K., Sinn, R., Saturnino, A. P., Centanin, L., & Wittbrodt, J. (2016) · Development · doi:10.1242/dev.135905 · Cited by 21
Gu, D., Wang, S., Zhang, S., Zhang, P., & Zhou, G. (2017) · Molecular Medicine Reports · doi:10.3892/mmr.2017.7652 · Cited by 21
Unlocking the Neurogenic Potential of Mammalian Müller Glia
Xia, X., & Ahmad, I. (2016) · International Journal of Stem Cells · doi:10.15283/ijsc16020 · Cited by 20
Self-citationAdvances in the study of Müller glia reprogramming in mammals
Guo, Y.-M., Jiang, X., Min, J., Huang, J., Huang, X., & Lu, Y. (2023) · Frontiers in Cellular Neuroscience · doi:10.3389/fncel.2023.1305896 · Cited by 18
Zhu, L., Shen, W., Zhang, T., Wang, Y., Bahrami, B., Zhou, F., & Gillies, M. C. (2018) · Experimental Eye Research · doi:10.1016/j.exer.2018.06.016 · Cited by 18
Prospective purification and characterization of Müller glia in the mouse retina regeneration assay
Schäfer, P., & Karl, M. (2017) · Glia · doi:10.1002/glia.23130 · Cited by 18
Emerging pharmacological approaches to promote neurogenesis from endogenous glial cells
Boda, E., Nato, G., & Buffo, A. (2017) · Biochemical Pharmacology · doi:10.1016/j.bcp.2017.06.129 · Cited by 16
Grigoryan, E. N. (2018) · Biochemistry (Moscow) · doi:10.1134/s0006297918110032 · Cited by 14
Cell-Based Therapies for Ocular Disease
Eveleth, D. D. (2013) · Journal of Ocular Pharmacology and Therapeutics · doi:10.1089/jop.2013.0028 · Cited by 13
Sherpa, R. D., & Hui, S. P. (2021) · Animal Models and Experimental Medicine · doi:10.1002/ame2.12177 · Cited by 12
Grigoryan, E. N. (2020) · Biomedicines · doi:10.3390/biomedicines8070208 · Cited by 12
Cell Sources for Retinal Regeneration: Implication for Data Translation in Biomedicine of the Eye
Grigoryan, E. N. (2022) · Cells · doi:10.3390/cells11233755 · Cited by 12
Endogenous Cell Sources for Eye Retina Regeneration in Vertebrate Animals and Humans
Grigoryan, E. N. (2018) · Russian Journal of Developmental Biology · doi:10.1134/s106236041901003x · Cited by 10
Challenges in Retinal Circuit Regeneration
Osakada, F., & Takahashi, M. (2015) · Biological and Pharmaceutical Bulletin · doi:10.1248/bpb.b14-00771 · Cited by 9
Wood, E. H., Korot, E., Storey, P. P., Muscat, S. P., Williams, G. A., & Drenser, K. A. (2020) · Current Opinion in Ophthalmology · doi:10.1097/icu.0000000000000656 · Cited by 9
Zhang, J., Ma, Y., Li, J., Wang, Y., & Zhang, J.-Z. (2020) · Pathology - Research and Practice · doi:10.1016/j.prp.2020.152953 · Cited by 9
Zarbin, M. A. (2012) · Drug Discovery Today Therapeutic Strategies · doi:10.1016/j.ddstr.2012.08.001 · Cited by 8
Interneuron regeneration after ouabain treatment in the adult mammalian retina
Li, Y., & Zhou, G. (2015) · Neuroreport · doi:10.1097/wnr.0000000000000414 · Cited by 6
The Regenerative Potential of the Vertebrate Retina: Lessons from the Zebrafish
Jeremy, N., Currie, P. D., & Jusuf, P. R. (2014) · Stem cell biology and regenerative medicine · doi:10.1007/978-1-4939-0787-8_3 · Cited by 7
Wang, Y., Li, J., Zhang, J., Pang, B., Zhao, Q., Chang, Y., & Jiang, Y. (2017) · Neural Regeneration Research · doi:10.4103/1673-5374.220779 · Cited by 6
Gullapalli, V. K., Khodair, M. A., Wang, H., Sugino, I. K., Madreperla, S. A., & Zarbin, M. A. (2012) · Elsevier eBooks · doi:10.1016/b978-1-4557-0737-9.00125-9 · Cited by 6
Notch Is Required for Neural Progenitor Proliferation During Embryonic Eye Regrowth
Guerin, D. J., Gutierrez, B., Zhang, B., & Tseng, K. A.-S. (2025) · International Journal of Molecular Sciences · doi:10.3390/ijms26062637 · Cited by 4
Debbio, C. B. D., Parameswaran, S., Das, A. V., & Ahmad, I. (2012) · Springer eBooks · doi:10.1007/978-1-4614-3801-4_9 · Cited by 5
Self-citationCell-based therapy for retinal degenerative disease
Sharma, Y. R., & Kapoor, M. (2016) · The Indian Journal of Medical Research · doi:10.4103/0971-5916.178628 · Cited by 3
Photoreceptor Transplantation and Regeneration
Marigo, V., & Casarosa, S. (2014) · Springer eBooks · doi:10.1007/978-4-431-54880-5_12 · Cited by 2
Plagl1 regulates the retinal progenitor cell to Müller glial cell transition
Touahri, Y., Pak, A., David, L. A., Hanna, J., Liu, H., Xiao, Y., Belfiore, L., Ilnytskyy, Y., van Oosten, E., 橘, 信., et al. (2026) · PLoS Genetics · doi:10.1371/journal.pgen.1012020 · Cited by 1
Stem Cells in the Developing and Adult Nervous System
Osakada, F., & Takahashi, M. (2010) · Springer eBooks · doi:10.1007/978-90-481-9075-1_5 · Cited by 1
Sobacı, G., & Gökçe, G. (2013) · Niche Journal · doi:10.5152/niche.2012.08 · Cited by 1
Mobilizing Endogenous Stem Cells for Retinal Repair
Yu, H., Talib, M., Vu, T. H. K., Cho, K., Guo, C., & Chen, D. F. (2015) · Elsevier eBooks · doi:10.1016/b978-0-12-800548-4.00020-6 · Cited by 1
Touahri, Y., David, L. A., Ilnytskyy, Y., van Oosten, E., Hanna, J., Tachibana, N., Adnani, L., Zhao, J., Hoffman, M., Dixit, R., et al. (2021) · bioRxiv (Cold Spring Harbor Laboratory) · doi:10.1101/2021.04.12.439550 · Cited by 1
Stem Cells and Ocular Disorders: Basic Science to Clinical Applications
(2012) · BENTHAM SCIENCE PUBLISHERS eBooks · doi:10.2174/978160805289911201010168
Baker, R., & Sharp, M. (2012)
Retinal Repair Using Stem Cells
Gutierrez, M. A., & Lamba, D. A. (2015) · Springer eBooks · doi:10.1007/978-3-7091-1232-8_15
Regenerative Therapies for Retinopathy
Periasamy, R., & Gangaraju, R. (2016) · Springer eBooks · doi:10.1007/978-3-319-28293-0_9
Johnson, T. V., & Martin, K. R. G. (2014) · Elsevier eBooks · doi:10.1016/b978-0-7020-5193-7.00063-7
Hope or Hype: Stem Cells as Therapeutics in Retinal Degenerative Diseases
Parameswaran, S. (2018) · Springer eBooks · doi:10.1007/978-981-13-0481-1_8
Self-citationStem Cells in the Developing and Adult Nervous System
Osakada, F., & Takahashi, M. (2016) · Springer eBooks · doi:10.1007/978-3-319-27583-3_4
Stem Cells in the Developing and Adult Nervous System
Osakada, F., & Takahashi, M. (2013) · Springer eBooks · doi:10.1007/978-94-007-5690-8_5
Cell-Based Therapy for Retinal Degenerative Disease
Zarbin, M. A. (2018) · Springer eBooks · doi:10.1007/978-3-319-90695-9_5
Cellular and molecular mechanisms of retinal regeneration in the axolotl salamander
Yandulskaya, A. S. (2022) · Digital Repository Service (Northeastern University) · doi:10.17760/d20439213
A Literary Pediatric Retina Fellowship With Michael T. Trese, MD
Wood, E. H., Moshfeghi, D. M., Capone, A., Williams, G. A., Blumenkranz, M. S., Sieving, P. A., Harper, C. A., Hartnett, M. E., & Drenser, K. A. (2023) · Ophthalmic surgery, lasers & imaging retina · doi:10.3928/23258160-20231020-01
Retinal microstructual and microvascular changes in mucopolysaccharidoses
Wipprecht, L., Borchers, A. J., Stingl, J. V., Schmitz, L. S., von Plettenberg, K., Hennermann, J. B., Hopf, S., Pitz, S., & Matlach, J. (2025) · Graefe s Archive for Clinical and Experimental Ophthalmology · doi:10.1007/s00417-025-06954-y
Yakoubi, W. E. (2012) · theses.fr (ABES) · doi:10.70675/c7f12aa8zb750z4a9ez8b33za3e1f7ab1093
Retinal ciliopathies in Huntington's and SCA7 disorders
Karam, A. (2013) · theses.fr (ABES) · doi:10.70675/05655d6fz83e2z48dbz908cz299f8b8b30e6
Metadata
- Authors
- Del Debbio, C. B., Balasubramanian, S., Parameswaran, S., Chaudhuri, A., Qiu, F., & Ahmad, I.
- Affiliations
- University of Nebraska Medical Center (US)
- Corresponding author
- Ahmad, Iqbal
- Venue
- PLoS ONE
- Publisher
- Public Library of Science (PLoS)
- Published
- 2010-08-26
- Volume
- 5
- Issue
- 8
- Pages
- e12425
- ISSN
- 1932-6203 (ISSN-L)
- PMC
- PMC2928741
- OpenAlex
- W2075249408
- Cited by
- 103
- References
- 58
- Citations by year
- 2026: 3 · 2025: 3 · 2023: 3 · 2022: 3 · 2021: 6 · 2020: 7 · 2019: 4 · 2018: 6 · 2017: 6 · 2016: 11 · 2015: 13 · 2014: 10 · 2013: 10 · 2012: 12
- FWCI
- 3.65
- Type
- journal article
- Language
- en
- Open access
- gold
- doi.org
- Locations
- PLoS ONE (publishedVersion, cc-by)
- PubMed Central (publishedVersion, cc-by)
- PubMed (publishedVersion)
- DOAJ (DOAJ: Directory of Open Access Journals) (submittedVersion, cc-by-sa)
- Figshare (submittedVersion, cc-by)
- Funders
- U.S. Department of Health and Human Services
- Research to Prevent Blindness
- Lincy Foundation
- Nebraska Department of Health and Human Services
- Topics
- Health Sciences › Medicine › Ophthalmology › Retinal Development and Disorders
- Life Sciences › Neuroscience › Developmental Neuroscience › Neurogenesis and neuroplasticity mechanisms
- Health Sciences › Medicine › Ophthalmology › Retinal Diseases and Treatments
- Keywords
- Müller cells, Notch signaling, Wnt signaling, retinal stem cells, light perception
- MeSH terms
- Animals, Mammals, Mice, Inbred C57BL, Regeneration, Retina, Vision, Ocular, Retinal Rod Photoreceptor Cells, Wnt Proteins, Mice, Rats, Receptors, Notch
About these checks
Registry, retraction, Cites and statistics results are computed, not judged, with one exception: a printed reference that no index lists is read once by a model before it counts as a citation error. Claims are extracted by a model and kept only when their quote appears verbatim in the text; each cited source is then checked, with a model’s help, for whether it says what the claim relies on. Those verdicts can be wrong — read the claim’s quote and the cited source before relying on one.
Statistics and arithmetic are recomputed, not judged.
Confidence bands are shown only for fields calibrated on our annotated test set. None is calibrated yet, so no band is shown.
What counts as a claim ›How we measure confidence ›How we check this ›
Are you an author, or do you see a problem with this page? Request a review
