

The DOI matches its Crossref record; 51 of the 52 references it cites were found in a registry or an index.
Dysregulation of the mTOR Pathway Mediates Impairment of Synaptic Plasticity in a Mouse Model of Alzheimer's Disease
Open accessAbstract
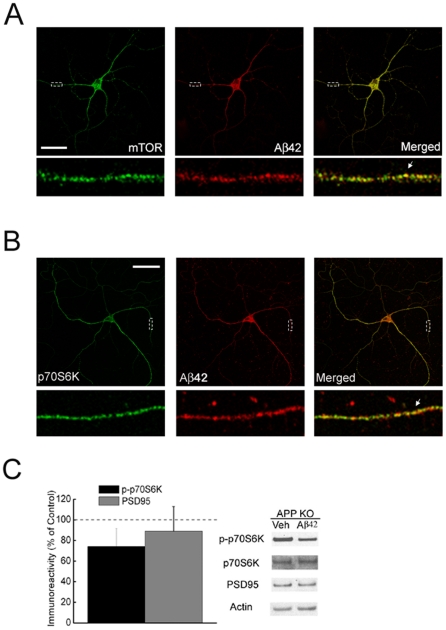
BACKGROUND: The mammalian target of rapamycin (mTOR) is an evolutionarily conserved Ser/Thr protein kinase that plays a pivotal role in multiple fundamental biological processes, including synaptic plasticity. We explored the relationship between the mTOR pathway and β-amyloid (Aβ)-induced synaptic dysfunction, which is considered to be critical in the pathogenesis of Alzheimer's disease (AD). METHODOLOGY/PRINCIPAL FINDINGS: We provide evidence that inhibition of mTOR signaling correlates with impairment in synaptic plasticity in hippocampal slices from an AD mouse model and in wild-type slices exposed to exogenous Aβ1-42. Importantly, by up-regulating mTOR signaling, glycogen synthase kinase 3 (GSK3) inhibitors rescued LTP in the AD mouse model, and genetic deletion of FK506-binding protein 12 (FKBP12) prevented Aβ-induced impairment in long-term potentiation (LTP). In addition, confocal microscopy demonstrated co-localization of intraneuronal Aβ42 with mTOR. CONCLUSIONS/SIGNIFICANCE: These data support the notion that the mTOR pathway modulates Aβ-related synaptic dysfunction in AD.
Overview
The claims and statistics of this paper haven’t been checked yet.
Run the check — free, no account needed. It reads the open-access text and checks the sources it cites.
Integrity signals
Registry
Cites
Statistics
Figures
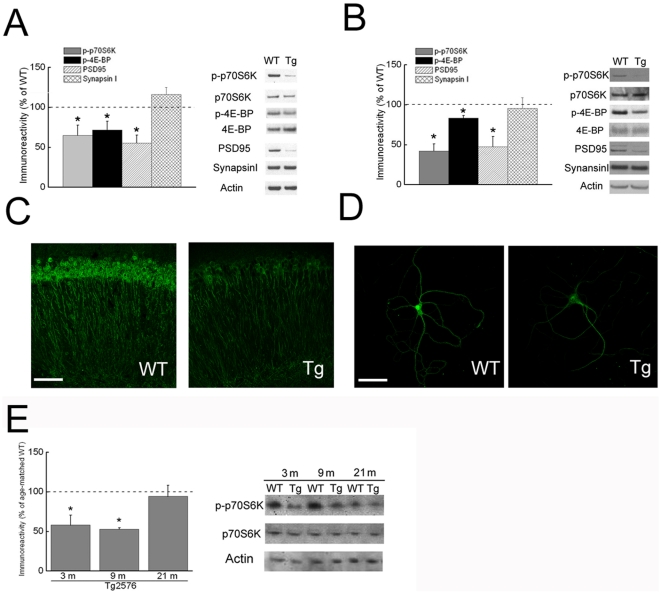
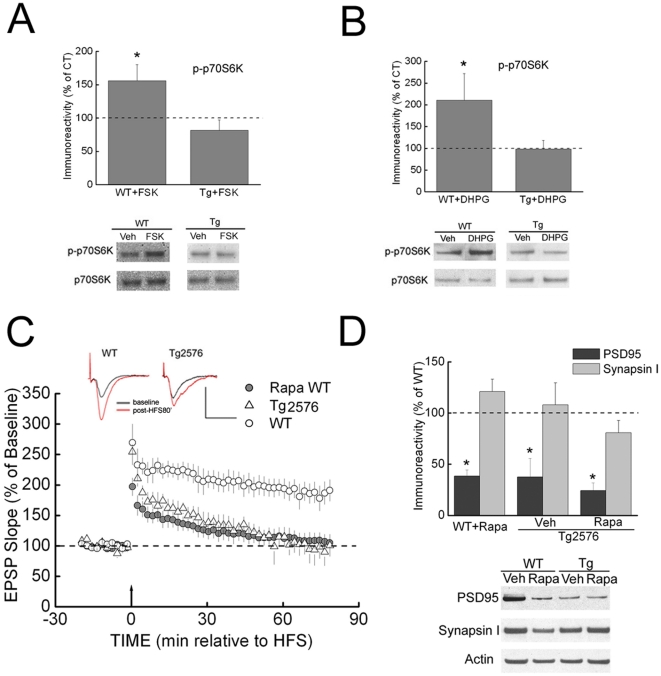
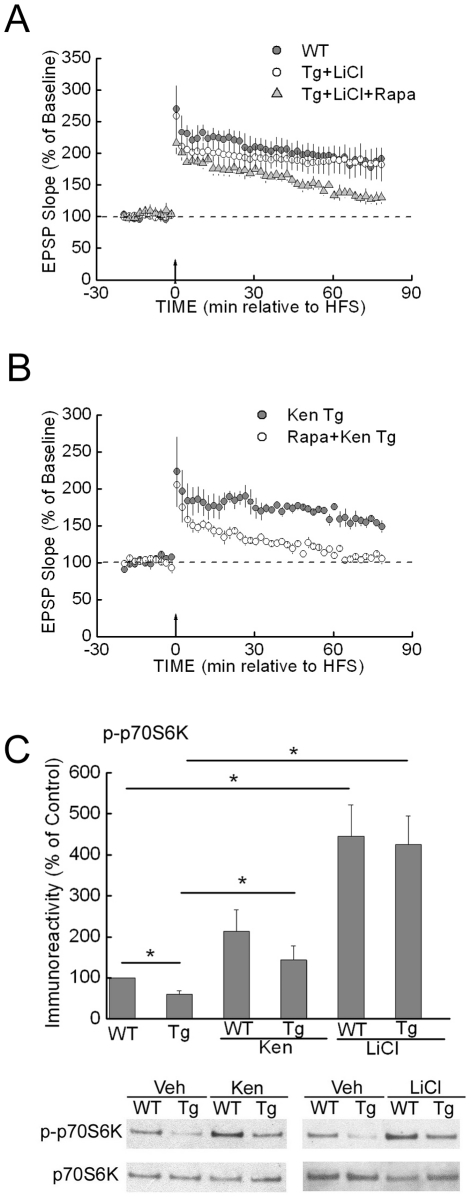
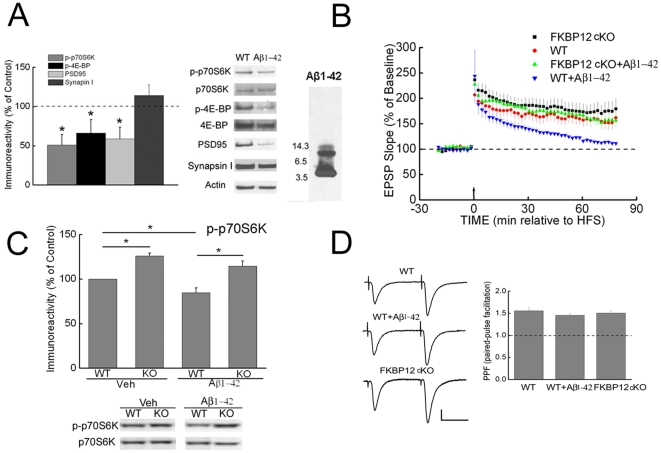
Verification
Claims the paper makes
The claims and statistics of this paper haven’t been checked yet.
Run the check — free, no account needed. It reads the open-access text and checks the sources it cites.
Claims other papers make about this one
Each is checked against this paper’s own text: does it say what the citing paper says it does?
In the citing paper
“mTOR activity, which is increased by Reelin signaling (92), is lower in AD mice (93).”
From Reelin: Neurodevelopmental Architect and Homeostatic Regulator of Excitatory Synapses (2017) · cites this paper as [93]
Self-check
Percentages, sums and reported differences re-computed from the paper’s own numbers.
The self-check needs the paper’s full text.
Citations
Cites
Soluble protein oligomers in neurodegeneration: lessons from the Alzheimer's amyloid β-peptide
Haass, C., & Selkoe, D. J. (2007) · Nature Reviews Molecular Cell Biology · doi:10.1038/nrm2101 · Cited by 4,744
Querfurth, H. W., & LaFerla, F. M. (2010) · New England Journal of Medicine · doi:10.1056/nejmra0909142 · Cited by 4,569
Correlative Memory Deficits, Aβ Elevation, and Amyloid Plaques in Transgenic Mice
Hsiao, K., Chapman, P., Nilsen, S., Eckman, C., Harigaya, Y., Younkin, S., Yang, F., & Cole, G. (1996) · Science · doi:10.1126/science.274.5284.99 · Cited by 4,210
Triple-Transgenic Model of Alzheimer’s Disease with Plaques and Tangles
Oddo, S., Caccamo, A., Shepherd, J. D., Murphy, M. P., Golde, T. E., Kayed, R., Metherate, R., Mattson, M. P., Akbari, Y., & LaFerla, F. M. (2003) · Neuron · doi:10.1016/s0896-6273(03)00434-3 · Cited by 4,126
Rapamycin fed late in life extends lifespan in genetically heterogeneous mice
Harrison, D. E., Strong, R., Sharp, Z. D., Nelson, J. F., Astle, C. M., Flurkey, K., Nadon, N. L., Wilkinson, J. E., Frenkel, K., Carter, C. S., et al. (2009) · Nature · doi:10.1038/nature08221 · Cited by 3,766
Prolonged Rapamycin Treatment Inhibits mTORC2 Assembly and Akt/PKB
Sarbassov, D. D., Ali, S. M., Sengupta, S., Sheen, J.-H., Hsu, P. P., Bagley, A. F., Markhard, A. L., & Sabatini, D. M. (2006) · Molecular Cell · doi:10.1016/j.molcel.2006.03.029 · Cited by 2,365
Ravikumar, B., Vacher, C., Berger, Z., Davies, J. E., Luo, S., Oroz, L. G., Scaravilli, F., Easton, D. F., Duden, R., O'Kane, C. J., et al. (2004) · Nature Genetics · doi:10.1038/ng1362 · Cited by 2,347
Guertin, D. A., Stevens, D. M., Thoreen, C. C., Burds, A. A., Kalaany, N. Y., Moffat, J., Brown, M., Fitzgerald, K. J., & Sabatini, D. M. (2006) · Developmental Cell · doi:10.1016/j.devcel.2006.10.007 · Cited by 1,467
Translational control of gene expression
Sonenberg, N., Hershey, J. W. B., & Mathews, M. B. (2000) · Cold Spring Harbor Laboratory eBooks · Cited by 1,379
Inoki, K., Ouyang, H., Zhu, T., Lindvall, C., Wang, Y., Zhang, X., Yang, Q., Bennett, C., Harada, Y., Stankunas, K., et al. (2006) · Cell · doi:10.1016/j.cell.2006.06.055 · Cited by 1,377
Cited by
Sorted by citations
Bomfim, T. R., Forny‐Germano, L., Sathler, L. B., Brito‐Moreira, J., Houzel, J., Decker, H., Silverman, M. A., Kazi, H., Melo, H. M., McClean, P. L., et al. (2012) · Journal of Clinical Investigation · doi:10.1172/jci57256 · Cited by 849
Rajmohan, R., & Reddy, P. H. (2016) · Journal of Alzheimer s Disease · doi:10.3233/jad-160612 · Cited by 730
Suppression of eIF2α kinases alleviates Alzheimer's disease–related plasticity and memory deficits
Ma, T., Trinh, M. A., Wexler, A. J., Bourbon, C., Gatti, E., Pierre, P., Cavener, D. R., & Klann, E. (2013) · Nature Neuroscience · doi:10.1038/nn.3486 · Cited by 575
Self-citationmTOR in Brain Physiology and Pathologies
Bockaert, J., & Marin, P. (2015) · Physiological Reviews · doi:10.1152/physrev.00038.2014 · Cited by 379
Mammalian/mechanistic target of rapamycin (mTOR) complexes in neurodegeneration
Querfurth, H., & Lee, H.-K. (2021) · Molecular Neurodegeneration · doi:10.1186/s13024-021-00428-5 · Cited by 288
Metadata
- Authors
- Ma, T., Hoeffer, C. A., Capetillo-Zarate, E., Yu, F., Wong, H., Lin, M. T., Tampellini, D., Klann, E., Blitzer, R. D., & Gouras, G. K.
- Affiliations
- Weill Cornell Medicine (US)
- New York University (US)
- Icahn School of Medicine at Mount Sinai (US)
- Corresponding author
- Gouras, Gunnar K.
- ORCID
- Venue
- PLoS ONE
- Publisher
- Public Library of Science (PLoS)
- Published
- 2010-09-20
- Volume
- 5
- Issue
- 9
- Pages
- e12845
- ISSN
- 1932-6203 (ISSN-L)
- PMC
- PMC2942840
- OpenAlex
- W2071279551
- Cited by
- 262
- References
- 52
- Citations by year
- 2026: 9 · 2025: 12 · 2024: 7 · 2023: 13 · 2022: 13 · 2021: 20 · 2020: 26 · 2019: 10 · 2018: 11 · 2017: 14 · 2016: 18 · 2015: 17 · 2014: 30 · 2013: 23 · 2012: 22
- FWCI
- 13.22
- Type
- journal article
- Language
- en
- Open access
- gold
- doi.org
- Locations
- PLoS ONE (publishedVersion, cc-by)
- PubMed Central (publishedVersion, cc-by)
- PubMed (publishedVersion)
- Communities in ADDI (University of the Basque Country) (submittedVersion, cc-by)
- DOAJ (DOAJ: Directory of Open Access Journals) (submittedVersion)
- Figshare (submittedVersion, cc-by)
- Hispana (submittedVersion, cc-by)
- Lund University Publications (Lund University) (submittedVersion)
- Funders
- National Institutes of Health (N S03400 7, AG‐09464, AG28174)
- National Institute on Aging (R01AG027140, AG09464, R01AG020729, K02AG028174, AG28174, AG027140, P01AG009464)
- National Institute of General Medical Sciences (R01GM054508, GM-054508)
- National Institute of Neurological Disorders and Stroke (R37NS034007, R01NS034007, R29NS034007, NS-034007)
- Topics
- Life Sciences › Neuroscience › Cellular and Molecular Neuroscience › Alzheimer's disease research and treatments
- Life Sciences › Neuroscience › Cellular and Molecular Neuroscience › Neuroscience and Neuropharmacology Research
- Life Sciences › Neuroscience › Neurology › Neuroinflammation and Neurodegeneration Mechanisms
- Keywords
- mTOR signaling, Alzheimer's disease, synaptic plasticity, amyloid-beta, amyloid-beta 42, long-term potentiation, glycogen synthase kinase-3, GSK-3 inhibitors, FKBP12, hippocampus, synaptic dysfunction, intraneuronal amyloid-beta
- MeSH terms
- Alzheimer Disease, Animals, Disease Models, Animal, Hippocampus, Humans, Mice, Inbred C57BL, Neuronal Plasticity, Peptide Fragments, Synapses, Signal Transduction, Amyloid beta-Peptides, Long-Term Potentiation, Mice, TOR Serine-Threonine Kinases
About these checks
Registry, retraction, Cites and statistics results are computed, not judged, with one exception: a printed reference that no index lists is read once by a model before it counts as a citation error. Claims are extracted by a model and kept only when their quote appears verbatim in the text; each cited source is then checked, with a model’s help, for whether it says what the claim relies on. Those verdicts can be wrong — read the claim’s quote and the cited source before relying on one.
Statistics and arithmetic are recomputed, not judged.
Confidence bands are shown only for fields calibrated on our annotated test set. None is calibrated yet, so no band is shown.
What counts as a claim ›How we measure confidence ›How we check this ›
Are you an author, or do you see a problem with this page? Request a review
