

The DOI matches its Crossref record; 75 of the 76 references it cites were found in a registry or an index.
Fat Oxidation, Fitness and Skeletal Muscle Expression of Oxidative/Lipid Metabolism Genes in South Asians: Implications for Insulin Resistance?
Open accessAbstract
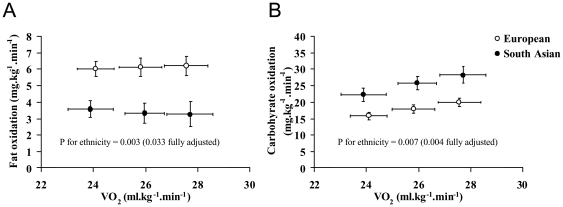
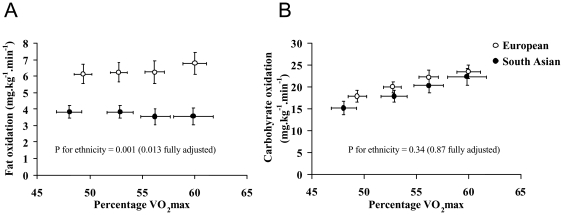
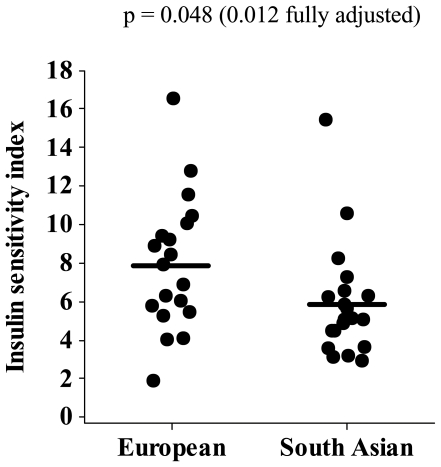
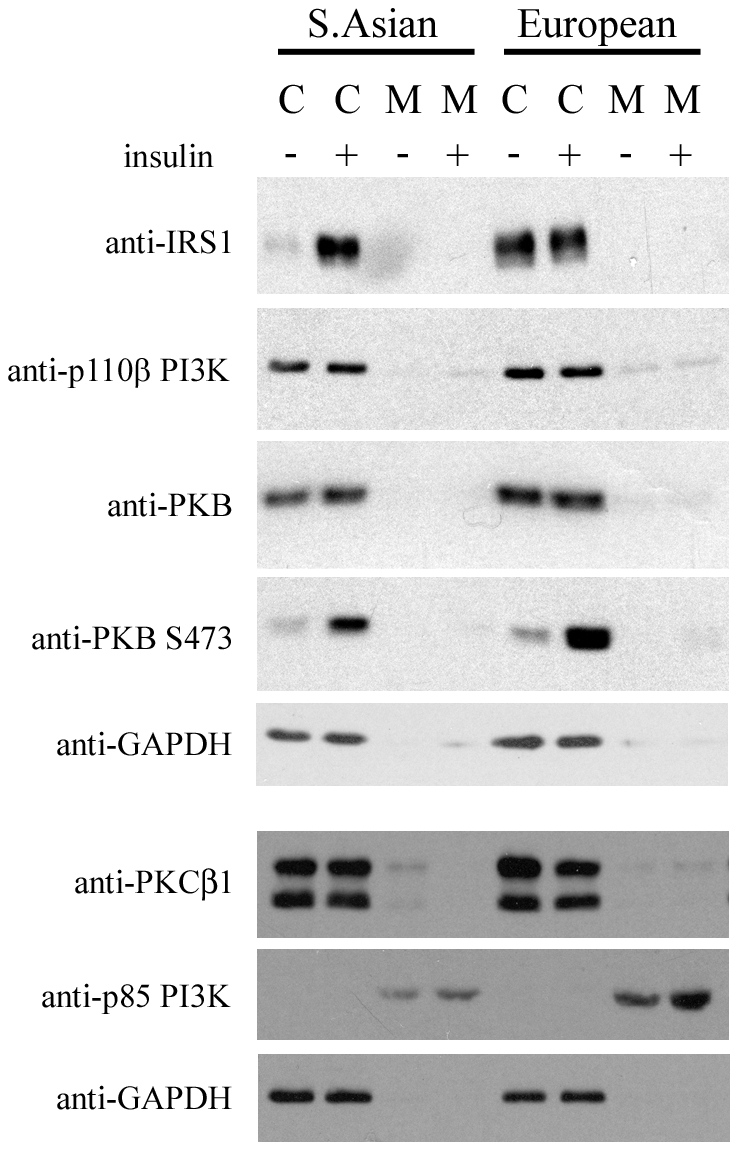
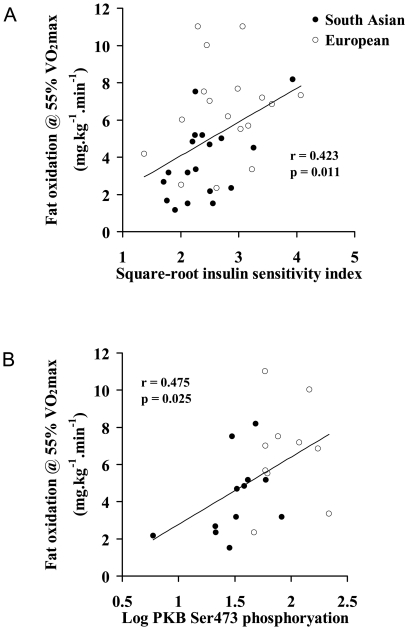
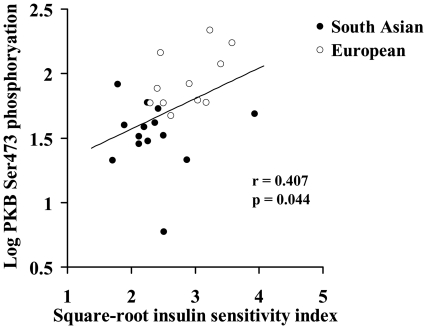
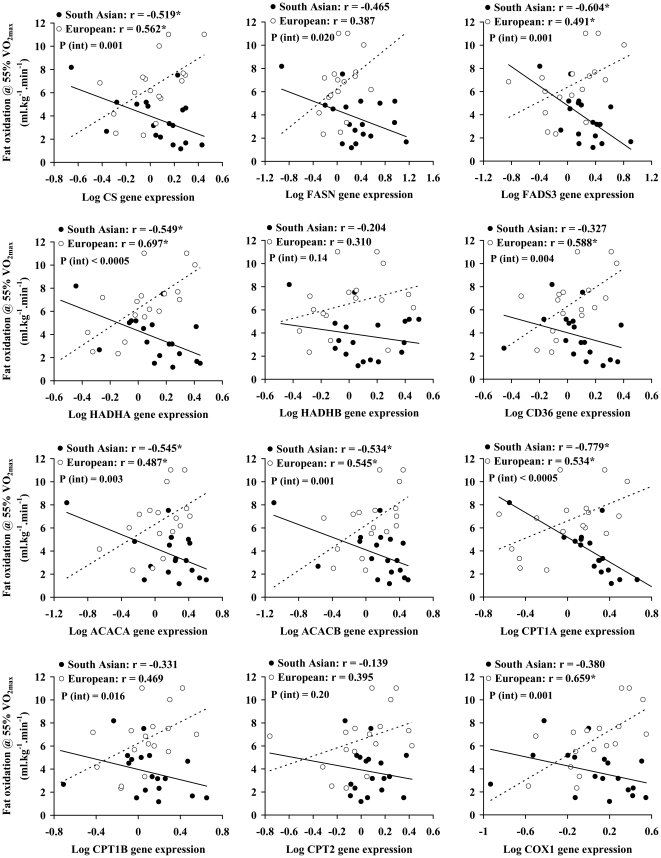
BACKGROUND: South Asians are more insulin resistant than Europeans, which cannot be fully explained by differences in adiposity. We investigated whether differences in oxidative capacity and capacity for fatty acid utilisation in South Asians might contribute, using a range of whole-body and skeletal muscle measures. METHODOLOGY/PRINCIPAL FINDINGS: Twenty men of South Asian ethnic origin and 20 age and BMI-matched men of white European descent underwent exercise and metabolic testing and provided a muscle biopsy to determine expression of oxidative and lipid metabolism genes and of insulin signalling proteins. In analyses adjusted for age, BMI, fat mass and physical activity, South Asians, compared to Europeans, exhibited; reduced insulin sensitivity by 26% (p = 0.010); lower VO2max (40.6±6.6 vs 52.4±5.7 ml x kg(-1) x min(-1), p = 0.001); and reduced fat oxidation during submaximal exercise at the same relative (3.77±2.02 vs 6.55±2.60 mg x kg(-1) x min(-1) at 55% VO2max, p = 0.013), and absolute (3.46±2.20 vs 6.00±1.93 mg x kg(-1) x min(-1) at 25 ml O(2) x kg(-1) x min(-1), p = 0.021), exercise intensities. South Asians exhibited significantly higher skeletal muscle gene expression of CPT1A and FASN and significantly lower skeletal muscle protein expression of PI3K and PKB Ser473 phosphorylation. Fat oxidation during submaximal exercise and VO2max both correlated significantly with insulin sensitivity index and PKB Ser473 phosphorylation, with VO2max or fat oxidation during exercise explaining 10-13% of the variance in insulin sensitivity index, independent of age, body composition and physical activity. CONCLUSIONS/SIGNIFICANCE: These data indicate that reduced oxidative capacity and capacity for fatty acid utilisation at the whole body level are key features of the insulin resistant phenotype observed in South Asians, but that this is not the consequence of reduced skeletal muscle expression of oxidative and lipid metabolism genes.
Overview
The claims and statistics of this paper haven’t been checked yet.
Run the check — free, no account needed. It reads the open-access text and checks the sources it cites.
Integrity signals
Registry
Cites
Statistics
Figures
Verification
Claims the paper makes
The claims and statistics of this paper haven’t been checked yet.
Run the check — free, no account needed. It reads the open-access text and checks the sources it cites.
Claims other papers make about this one
Each is checked against this paper’s own text: does it say what the citing paper says it does?
In the citing paper
“may be more sensitive to weight loss, with physiological differences in insulin resistance, body composition and fat oxidation [98, 99].”
In the citing paper
“South Asians develop type 2 diabetes at younger ages, more rapidly and with lower BMI”
Self-check
Percentages, sums and reported differences re-computed from the paper’s own numbers.
The self-check needs the paper’s full text.
Citations
Cites
Bradford, M. M. (1976) · Analytical Biochemistry · doi:10.1016/0003-2697(76)90527-3 · Cited by 255,302
International physical activity questionnaire: 12-country reliability and validity
CRAIG, C. L., MARSHALL, A. L., SJ??STR??M, M., BAUMAN, A. E., BOOTH, M. L., AINSWORTH, B. E., PRATT, M., EKELUND, U., YNGVE, A., SALLIS, J. F., et al. (2003) · Medicine & Science in Sports & Exercise · doi:10.1249/01.mss.0000078924.61453.fb · Cited by 21,619
Matsuda, M., & DeFronzo, R. A. (1999) · Diabetes Care · doi:10.2337/diacare.22.9.1462 · Cited by 5,621
International Standards for Anthropometric Assessment (2006)
Marfell-Jones, M., Olds, T., Stewart, A. D., & Carter, L. (2006) · VUBIR (Vrije Universiteit Brussel) · Cited by 2,608
Bruce, R. A., Kusumi, F., & Hosmer, D. W. (1973) · American Heart Journal · doi:10.1016/0002-8703(73)90502-4 · Cited by 2,057
Cho, H., Mu, J., Kim, J. K., Thorvaldsen, J. L., Chu, Q., Crenshaw, E. B., Kaestner, K. H., Bartolomei, M. S., Shulman, G. I., & Birnbaum, M. J. (2001) · Science · doi:10.1126/science.292.5522.1728 · Cited by 1,860
McKeigue, P. M., Shah, B., & Marmot, M. G. (1991) · The Lancet · doi:10.1016/0140-6736(91)91164-p · Cited by 1,618
Maximal Oxygen Intake as an Objective Measure of Cardio-Respiratory Performance
TAYLOR, H. L., BUSKIRK, E. R., & Henschel, A. F. (1955) · Journal of Applied Physiology · doi:10.1152/jappl.1955.8.1.73 · Cited by 1,366
Perceived exertion: a note on "history" and methods.
Borg, G. A. V. (1973) · PubMed · Cited by 1,096
Kelley, D. E., Goodpaster, B., Wing, R. R., & Simoneau, J.-A. (1999) · American Journal of Physiology-Endocrinology and Metabolism · doi:10.1152/ajpendo.1999.277.6.e1130 · Cited by 1,096
Research works printed but not linked: 1
- GJG Davey, 2000, Effects of exercise on insulin resistance in South Asians and Europeans., J Exerc Physiol, 3, 6
Cited by
Sorted by citations
Items 101–105 of 105
Energy metabolism in relation to diet and physical activity
Wulan, S. N. (2015) · doi:10.26481/dis.20151112sw
Ethnic Factors in the Assessment of Cardiovascular Risk for Primary Prevention
Bhatia, H. S., Xu, I., Taub, P. R., & Wilkinson, M. J. (2022) · Contemporary cardiology · doi:10.1007/978-3-030-98824-1_11
Structure Induced by a Multiple Membership Transformation on the Conditional Autoregressive Model
Gramatica, M., Liverani, S., & Congdon, P. D. (2023) · Bayesian Analysis · doi:10.1214/23-ba1370
Sun, L., Goh, H. J., Bi, X., Chan, S. P., & Leow, M. K. (2026) · International Journal of Obesity · doi:10.1038/s41366-026-02066-7
Haq, M. Z. U., Narayan, K. V., Patel, S. A., Sun, Y. V., Ali, M. K., & Ahmad, S. (2026) · Diabetes Research and Clinical Practice · doi:10.1016/j.diabres.2026.113572
Metadata
- Authors
- Hall, L. M. L., Moran, C. N., Milne, G. R., Wilson, J., MacFarlane, N. G., Forouhi, N. G., Hariharan, N., Salt, I. P., Sattar, N., & Gill, J. M. R.
- Affiliations
- University of Glasgow (GB)
- Addenbrooke's Hospital (GB)
- Pfizer (United States) (US)
- Corresponding author
- Gill, Jason M. R.
- Venue
- PLoS ONE
- Publisher
- Public Library of Science (PLoS)
- Published
- 2010-12-01
- Volume
- 5
- Issue
- 12
- Pages
- e14197
- ISSN
- 1932-6203 (ISSN-L)
- PMC
- PMC2995737
- OpenAlex
- W2071313377
- Cited by
- 106
- References
- 76
- Citations by year
- 2026: 4 · 2025: 3 · 2024: 2 · 2023: 4 · 2022: 7 · 2021: 9 · 2020: 8 · 2019: 9 · 2018: 8 · 2017: 9 · 2016: 9 · 2015: 12 · 2014: 3 · 2013: 10 · 2012: 8
- FWCI
- 16.27
- Type
- journal article
- Language
- en
- Open access
- gold
- doi.org
- Locations
- PLoS ONE (publishedVersion, cc-by)
- Europe PMC (PubMed Central) (publishedVersion, cc-by)
- PubMed Central (publishedVersion, cc-by)
- PubMed (publishedVersion)
- ENLIGHTEN (Jurnal Bimbingan dan Konseling Islam) (acceptedVersion)
- DOAJ (DOAJ: Directory of Open Access Journals) (submittedVersion, cc-by-sa)
- Stirling Online Research Repository (University of Stirling) (submittedVersion, cc-by)
- Funders
- Pfizer
- Diabetes UK (06/0003224)
- Topics
- Health Sciences › Medicine › Physiology (medical) › Cardiovascular and exercise physiology
- Health Sciences › Medicine › Physiology (medical) › Adipose Tissue and Metabolism
- Health Sciences › Medicine › Endocrinology, Diabetes and Metabolism › Diabetes, Cardiovascular Risks, and Lipoproteins
- Keywords
- South Asians, insulin resistance, fat oxidation, skeletal muscle gene expression, lipid metabolism genes, VO2max, exercise capacity, CPT1A, fatty acid synthase
- MeSH terms
- Adipose Tissue, Adult, Anthropometry, Asia, Biopsy, Body Composition, Fatty Acids, Female, Humans, Insulin, Insulin Resistance, Male, Oxygen, Signal Transduction, Body Mass Index, Muscle, Skeletal, Lipid Metabolism
About these checks
Registry, retraction, Cites and statistics results are computed, not judged, with one exception: a printed reference that no index lists is read once by a model before it counts as a citation error. Claims are extracted by a model and kept only when their quote appears verbatim in the text; each cited source is then checked, with a model’s help, for whether it says what the claim relies on. Those verdicts can be wrong — read the claim’s quote and the cited source before relying on one.
Statistics and arithmetic are recomputed, not judged.
Confidence bands are shown only for fields calibrated on our annotated test set. None is calibrated yet, so no band is shown.
What counts as a claim ›How we measure confidence ›How we check this ›
Are you an author, or do you see a problem with this page? Request a review
