

The DOI matches its Crossref record; 39 of the 39 references it cites were found in a registry or an index.
Aβ40 Oligomers Identified as a Potential Biomarker for the Diagnosis of Alzheimer's Disease
Open accessAbstract
Alzheimer's Disease (AD) is the most prevalent form of dementia worldwide, yet the development of therapeutics has been hampered by the absence of suitable biomarkers to diagnose the disease in its early stages prior to the formation of amyloid plaques and the occurrence of irreversible neuronal damage. Since oligomeric Aβ species have been implicated in the pathophysiology of AD, we reasoned that they may correlate with the onset of disease. As such, we have developed a novel misfolded protein assay for the detection of soluble oligomers composed of Aβ x-40 and x-42 peptide (hereafter Aβ40 and Aβ42) from cerebrospinal fluid (CSF). Preliminary validation of this assay with 36 clinical samples demonstrated the presence of aggregated Aβ40 in the CSF of AD patients. Together with measurements of total Aβ42, diagnostic sensitivity and specificity greater than 95% and 90%, respectively, were achieved. Although larger sample populations will be needed to confirm this diagnostic sensitivity, our studies demonstrate a sensitive method of detecting circulating Aβ40 oligomers from AD CSF and suggest that these oligomers could be a powerful new biomarker for the early detection of AD.
Overview
The claims and statistics of this paper haven’t been checked yet.
Run the check — free, no account needed. It reads the open-access text and checks the sources it cites.
Integrity signals
Registry
Cites
Statistics
Figures
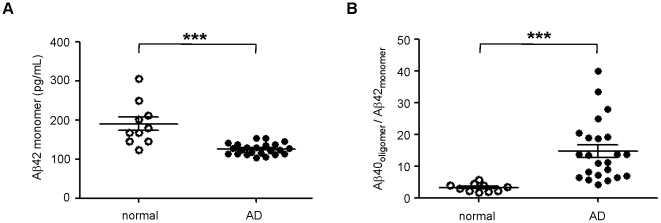
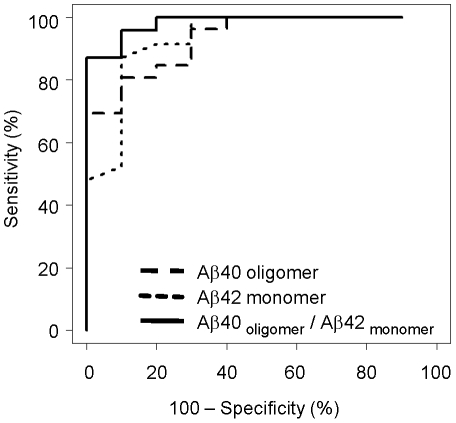
Verification
Claims the paper makes
The claims and statistics of this paper haven’t been checked yet.
Run the check — free, no account needed. It reads the open-access text and checks the sources it cites.
Claims other papers make about this one
Each is checked against this paper’s own text: does it say what the citing paper says it does?
In the citing paper
“These assays, which can be many orders of magnitude more sensitive than ELISAs, have established an AD-dependent accumulation of oligomers in human CSF (Fukumoto et al., 2010; Gao et al., 2010; Georganopoulou et al., 2005; Haes et al., 2005).”
From The Aβ oligomer hypothesis for synapse failure and memory loss in Alzheimer’s disease (2011) · cites this paper as Gao et al., 2010
Self-check
Percentages, sums and reported differences re-computed from the paper’s own numbers.
The self-check needs the paper’s full text.
Citations
Cites
1 retracted
RETRACTED ARTICLE: A specific amyloid-β protein assembly in the brain impairs memory
Lesné, S., Koh, M. T., Kotilinek, L., Kayed, R., Glabe, C. G., Yang, A., Gallagher, M., & Ashe, K. H. (2006) · Nature · doi:10.1038/nature04533 · Cited by 2,769
RetractedMcKhann, G., Drachman, D., Folstein, M., Katzman, R., Price, D., & Stadlan, E. M. (1984) · Neurology · doi:10.1212/wnl.34.7.939 · Cited by 27,915 · cited 1×
“and the criteria of probable AD defined by NINCDS-ADRDA”
BackgroundGlobal prevalence of dementia: a Delphi consensus study
Ferri, C. P., Prince, M. J., Brayne, C., Brodaty, H., Fratiglioni, L., Ganguli, M., Hall, K. S., Hasegawa, K., Hendrie, H. C., Huang, Y., et al. (2005) · The Lancet · doi:10.1016/s0140-6736(05)67889-0 · Cited by 5,336 · cited 1×
“It is the most prevalent form of dementia, estimated to affect 13 million people worldwide [1].”
BackgroundSoluble protein oligomers in neurodegeneration: lessons from the Alzheimer's amyloid β-peptide
Haass, C., & Selkoe, D. J. (2007) · Nature Reviews Molecular Cell Biology · doi:10.1038/nrm2101 · Cited by 4,744 · cited 1×
“Its chemical composition is also poorly defined, although several lines of evidence suggest that AD-associated oligomers are primarily composed of Ab42 [3].”
BackgroundCommon structure of soluble amyloid oligomers implies common mechanism of pathogenesis
Kayed, R., Head, E., Thompson, J. L., McIntire, T. M., Milton, S. C., Cotman, C. W., & Glabe, C. G. (2003) · Science · doi:10.1126/science.1079469 · Cited by 4,064 · cited 2×
“As amyloid aggregates are characterized by similar cross-beta sheet structure, they share conformational epitopes that are recognized by amyloid-binding molecules such as Congo Red and thioflavin T [15,16] as well as conformation-specific antibodies [17,18].”
BackgroundShankar, G. M., Li, S., Mehta, T. H., Garcia-Munoz, A., Shepardson, N. E., Smith, I., Brett, F. M., Farrell, M. A., Rowan, M. J., Lemere, C. A., et al. (2008) · Nature Medicine · doi:10.1038/nm1782 · Cited by 3,685
Atomic structures of amyloid cross-β spines reveal varied steric zippers
Sawaya, M. R., Sambashivan, S., Nelson, R. A., Ivanova, M. I., Sievers, S. A., Apostol, M. I., Thompson, M. J., Balbirnie, M., Wiltzius, J. J. W., McFarlane, H. T., et al. (2007) · Nature · doi:10.1038/nature05695 · Cited by 2,279 · cited 1×
“While the precise conformation of in vivo oligomers is unknown, several lines of evidence suggest that aggregated proteins share a number of structural properties. For instance, amyloid fibrils composed of different proteins have similar cross beta sheet structure, allowing binding and detection by a number of compoun…”
BackgroundAlzheimer Disease in the US Population: Prevalence Estimates Using the 2000 Census
Hebert, L. E., Scherr, P. A., Bienias, J. L., Bennett, D. A., & Evans, D. A. (2003) · Archives of Neurology · doi:10.1001/archneur.60.8.1119 · Cited by 2,168 · cited 1×
“elderly population greater than 85 years old [29].”
BackgroundJarrett, J. T., Berger, E. P., & Lansbury, P. T. (1993) · Biochemistry · doi:10.1021/bi00069a001 · Cited by 2,022 · cited 1×
“interpretation of these results is that aggregation of the less soluble Ab42 would precede and recruit subsequent aggregation of Ab40, as has been previously suggested [12,35].”
ResultAβ Oligomers – a decade of discovery
Walsh, D. M., & Selkoe, D. J. (2007) · Journal of Neurochemistry · doi:10.1111/j.1471-4159.2006.04426.x · Cited by 1,938 · cited 1×
“In addition, Ab42 appears to be more amyloidogenic than Ab40 and is found more frequently in plaques despite existing at much lower physiological concentrations [13].”
Background
Cited by
Sorted by citations
Peptoid Polymers: A Highly Designable Bioinspired Material
Sun, J., & Zuckermann, R. N. (2013) · ACS Nano · doi:10.1021/nn4015714 · Cited by 459
The Aβ oligomer hypothesis for synapse failure and memory loss in Alzheimer’s disease
Ferreira, S. T., & Klein, W. L. (2011) · Neurobiology of Learning and Memory · doi:10.1016/j.nlm.2011.08.003 · Cited by 442
Olivares, D., K. Deshpande, V., Shi, Y., K. Lahiri, D., H. Greig, N., T. Rogers, J., & Huang, X. (2012) · Current Alzheimer Research · doi:10.2174/156720512801322564 · Cited by 407
Pharmapolymers in the 21st century: Synthetic polymers in drug delivery applications
Englert, C., Brendel, J. C., Majdanski, T. C., Yildirim, T., Schubert, S., Gottschaldt, M., Windhab, N., & Schubert, U. S. (2018) · Progress in Polymer Science · doi:10.1016/j.progpolymsci.2018.07.005 · Cited by 254
Goyal, D., Shuaib, S., Mann, S., & Goyal, B. (2017) · ACS Combinatorial Science · doi:10.1021/acscombsci.6b00116 · Cited by 232
Morales, R., Moreno‐González, I., & Soto, C. A. (2013) · PLoS Pathogens · doi:10.1371/journal.ppat.1003537 · Cited by 225
“Although the presence of misfolded aggregates at different organs throughout the body complicates the possibility of a crossseeding in this specific case, it is important to highlight that there is evidence for soluble oligomers circulating in biological fluids [28,29].”
BackgroundFluid biomarkers in Alzheimer’s disease – current concepts
Rosén, C., Hansson, O., Blennow, K., & Zetterberg, H. (2013) · Molecular Neurodegeneration · doi:10.1186/1750-1326-8-20 · Cited by 221
Hong, S., Ostaszewski, B. L., Yang, T., O’Malley, T. T., Jin, M., Yanagisawa, K., Li, S., Bartels, T., & Selkoe, D. J. (2014) · Neuron · doi:10.1016/j.neuron.2014.02.027 · Cited by 213
“A few reports of the detection of apparent Ab oligomers in CSF and plasma have appeared (Fukumoto et al., 2010; Gao et al., 2010; Klyubin et al., 2008; Villemagne et al., 2010); however, the interpretation of these reports has been clouded by failure to define the precise oligomeric unit the assays are detecting, an i…”
Detection of Misfolded Aβ Oligomers for Sensitive Biochemical Diagnosis of Alzheimer’s Disease
Salvadores, N., Shahnawaz, M., Scarpini, E. A., Tagliavini, F., & Soto, C. A. (2014) · Cell Reports · doi:10.1016/j.celrep.2014.02.031 · Cited by 205
“Recent studies have shown that Ab oligomers are naturally secreted by cells and circulate in AD biological fluids (Gao et al., 2010; Head et al., 2010; Walsh et al., 2002; Klyubin et al., 2008; Georganopoulou et al., 2005; Fukumoto et al., 2010).”
BackgroundGoure, W. F., Krafft, G. A., Jerecic, J., & Hefti, F. (2014) · Alzheimer's Research & Therapy · doi:10.1186/alzrt272 · Cited by 190
“Soluble Aβ oligomers have been isolated from extracts of postmortem AD brain tissue and from transgenic AD animal models [37,52,117-119] and have been reported to be elevated in human AD brain relative to non-demented older patients [59,61,62,65,119-124].”
BackgroundA Sensitive Aβ Oligomer Assay Discriminates Alzheimer's and Aged Control Cerebrospinal Fluid
Savage, M. J., Kalinina, J., Wolfe, A. L., Tugusheva, K., Korn, R., Cash-Mason, T., Maxwell, J. W., Hatcher, N. G., Haugabook, S. J., Wu, G., et al. (2014) · Journal of Neuroscience · doi:10.1523/jneurosci.1675-13.2014 · Cited by 187
“It is notable that oligomers consistently increase in AD (Pitschke et al., 1998; Georganopoulou et al., 2005; Fukumoto et al., 2010; Gao et al., 2010; Sancesario et al., 2012; Santos et al., 2012; Hölttä et al., 2013; Herskovits et al., 2013), unlike A 42 monomer (Jack et al., 2010).”
BackgroundInfluentialAmyloid β oligomers (AβOs) in Alzheimer’s disease
Mroczko, B., Groblewska, M., Litman‐Zawadzka, A., Kornhuber, J., & Lewczuk, P. (2017) · Journal of Neural Transmission · doi:10.1007/s00702-017-1820-x · Cited by 150
Evaluating Amyloid-β Oligomers in Cerebrospinal Fluid as a Biomarker for Alzheimer’s Disease
Hölttä, M., Hansson, O., Andréasson, U., Hertze, J., Minthon, L., Nägga, K., Andreasen, N., Zetterberg, H., & Blennow, K. (2013) · PLoS ONE · doi:10.1371/journal.pone.0066381 · Cited by 147
Upcoming Candidate Cerebrospinal Fluid Biomarkers of Alzheimer’s Disease
Fagan, A. M., & Perrin, R. J. (2012) · Biomarkers in Medicine · doi:10.2217/bmm.12.42 · Cited by 118
Alzheimer’s Disease: Biomarkers in the Genome, Blood, and Cerebrospinal Fluid
Huynh, R. A., & Mohan, C. (2017) · Frontiers in Neurology · doi:10.3389/fneur.2017.00102 · Cited by 112
“compared the diagnostic potential of the Aβ40 oligomer to that of the Aβ42 monomer and found Aβ42 monomers to be superior (63).”
BackgroundDeng, Y., Wang, Z., Wang, R., Zhang, X., Zhang, S., Wu, Y., Staufenbiel, M., Cai, F., & Song, W. (2013) · European Journal of Neuroscience · doi:10.1111/ejn.12235 · Cited by 108
“Although Ab42 is more toxic than Ab40, Ab40 is the predominant form of Ab, accounting for > 90% of total Ab (Donmez et al., 2010; Gao et al., 2010; Kuperstein et al., 2010; Seppala et al., 2010; Rabe et al., 2011; Sato et al., 2012).”
BackgroundPreoperative cerebrospinal fluid β‐Amyloid/Tau ratio and postoperative delirium
Xie, Z., Swain, C. A., Ward, S. A. P., Zheng, H., Dong, Y., Sunder, N., Burke, D. W., Escobar, D., Zhang, Y., & Marcantonio, E. R. (2014) · Annals of Clinical and Translational Neurology · doi:10.1002/acn3.58 · Cited by 96
Epilepsy, amyloid-β, and D1 dopamine receptors: a possible pathogenetic link?
Costa, C., Parnetti, L., D'Amelio, M., Tozzi, A., Tantucci, M., Romigi, A., Siliquini, S., Cavallucci, V., Di Filippo, M., Mazzocchetti, P., et al. (2016) · Neurobiology of Aging · doi:10.1016/j.neurobiolaging.2016.08.025 · Cited by 94
An overview of peptide and peptoid foldamers in medicinal chemistry
Mándity, I. M., & Fülöp, F. (2015) · Expert Opinion on Drug Discovery · doi:10.1517/17460441.2015.1076790 · Cited by 83
Prion Pathogenesis Is Faithfully Reproduced in Cerebellar Organotypic Slice Cultures
Falsig, J., Sonati, T., Herrmann, U., Saban, D. V., Li, B., Arroyo, K., Ballmer, B., Liberski, P. P., & Aguzzi, A. (2012) · PLoS Pathogens · doi:10.1371/journal.ppat.1002985 · Cited by 79
Peptoids for biomaterials science
Lau, K. H. A. (2014) · Biomaterials Science · doi:10.1039/c3bm60269a · Cited by 79
Amyloid cross-seeding raises new dimensions to understanding of amyloidogenesis mechanism
Chaudhuri, P., Prajapati, K. P., Anand, B. G., Dubey, K., & Kar, K. (2019) · Ageing Research Reviews · doi:10.1016/j.arr.2019.100937 · Cited by 80
Blennow, K., & Zetterberg, H. (2015) · Frontiers in Neuroscience · doi:10.3389/fnins.2015.00345 · Cited by 79
“…such as fluorescence correlation spectroscopy (Pitschke et al., 1998), biobarcode assay (Georganopoulou et al., 2005), misfolded protein assay (Gao et al., 2010), ELISA with the same monoclonal antibody both for capture and detection (Fukumoto et al., 2010), flow cytometry based assays…”
Braidy, N., Zarka, M. H., Jugder, B., Welch, J. H., Jayasena, T., Chan, D. K. Y., Sachdev, P. S., & Bridge, W. J. (2019) · Frontiers in Aging Neuroscience · doi:10.3389/fnagi.2019.00177 · Cited by 70
“These peptides have been localized in amyloid plaques and can form oligomers and protofibrils, although Aβ42 is more hydrophobic and fibrillogenic (Selkoe, 2001).”
BackgroundInfluentialCSF Biomarkers for Amyloid and Tau Pathology in Alzheimer's Disease
Rosenmann, H. (2011) · Journal of Molecular Neuroscience · doi:10.1007/s12031-011-9665-5 · Cited by 72
Effects of Anesthetic Isoflurane and Desflurane on Human Cerebrospinal Fluid Aβ and τ Level
Zhang, B., Tian, M., Zheng, H., Yu, Z., Yue, Y., Li, T., Li, S., Marcantonio, E. R., & Xie, Z. (2013) · Anesthesiology · doi:10.1097/aln.0b013e31828ce55d · Cited by 67
The Amyloid-β Oligomer Count in Cerebrospinal Fluid is a Biomarker for Alzheimer's Disease
Wang‐Dietrich, L., Funke, S. A., Kühbach, K., Wang, K., Besmehn, A., Willbold, S., Cinar, Y., Bannach, O., Birkmann, E., & Willbold, D. (2013) · Journal of Alzheimer s Disease · doi:10.3233/jad-122047 · Cited by 66
Scarano, S., Lisi, S., Ravelet, C., Peyrin, É., & Minunni, M. (2016) · Analytica Chimica Acta · doi:10.1016/j.aca.2016.08.008 · Cited by 67
Detection of Aβ Monomers and Oligomers: Early Diagnosis of Alzheimer's Disease
Zhou, Y., Liu, L., Hao, Y., & Xu, M. (2016) · Chemistry - An Asian Journal · doi:10.1002/asia.201501355 · Cited by 61
Blennow, K., Biscetti, L., Eusebi, P., & Parnetti, L. (2016) · Movement Disorders · doi:10.1002/mds.26656 · Cited by 61
Martins, B., Vieira, M., Delerue-Matos, C. M., Grosso, C., & Soares, C. M. D. (2022) · Marine Drugs · doi:10.3390/md20060362 · Cited by 58
“Aβ peptides produced through the amyloidogenic pathway can have several lengths, between 38 and 42 amino acids [55], the most common forms being Aβ40 and Aβ42 [56].”
BackgroundRationally Designed Peptoids Modulate Aggregation of Amyloid-Beta 40
Turner, J. P., Lutz-Rechtin, T. M., Moore, K. A., Rogers, L., Bhave, O., Moss, M. A., & Servoss, S. L. (2014) · ACS Chemical Neuroscience · doi:10.1021/cn400221u · Cited by 55
Clinical significance of fluid biomarkers in Alzheimer’s Disease
Lewczuk, P., Łukaszewicz‐Zając, M., Mroczko, P., & Kornhuber, J. (2020) · Pharmacological Reports · doi:10.1007/s43440-020-00107-0 · Cited by 56
Cerebrospinal Fluid P-Tau181P: Biomarker for Improved Differential Dementia Diagnosis
Struyfs, H., Niemantsverdriet, E., Goossens, J., Fransén, E., Martin, J., Deyn, P. P. D., & Engelborghs, S. (2015) · Frontiers in Neurology · doi:10.3389/fneur.2015.00138 · Cited by 53
Oxidative Stress and Its Clinical Applications in Dementia
Mao, P. (2012) · Journal of Neurodegenerative Diseases · doi:10.1155/2013/319898 · Cited by 56
Liu, L., Xia, N., Jiang, M., Huang, N., Guo, S., Li, S., & Zhang, S. (2015) · Journal of Electroanalytical Chemistry · doi:10.1016/j.jelechem.2015.06.017 · Cited by 52
Arendash, G. W., Cao, C., Abulaban, H., Baranowski, R., Wisniewski, G., Becerra, L. R., Andel, R., Lin, X., Zhang, X., Wittwer, D., et al. (2019) · Journal of Alzheimer s Disease · doi:10.3233/jad-190367 · Cited by 52
Aβ42-Binding Peptoids as Amyloid Aggregation Inhibitors and Detection Ligands
Luo, Y., Vali, S., Sun, S., Chen, X., Liang, X., Drozhzhina, T., Александровна, П. Е., & Борисович, Б. И. (2013) · ACS Chemical Neuroscience · doi:10.1021/cn400011f · Cited by 46
Detection of retinal and blood Aβ oligomers with nanobodies
Habiba, U., Descallar, J., Kreilaus, F., Adhikari, U. K., Kumar, S., Morley, J. W., Bui, B. V., Koronyo‐Hamaoui, M., & Tayebi, M. (2021) · Alzheimer s & Dementia Diagnosis Assessment & Disease Monitoring · doi:10.1002/dad2.12193 · Cited by 43
Zhao, Z., Zhu, L., Bu, X., Ma, H., Yang, S., Yang, Y., & Hu, Z. (2014) · Chemical Communications · doi:10.1039/c4cc07037b · Cited by 43
A Universal Method for Detection of Amyloidogenic Misfolded Proteins
Yam, A. Y.-W., Wang, X., Gao, C. M., Connolly, M. D., Zuckermann, R. N., Bleu, T., Hall, J., Fedynyshyn, J. P., Allauzen, S., Peretz, D., et al. (2011) · Biochemistry · doi:10.1021/bi200215j · Cited by 39
Schluesener, J. K., & Schluesener, H. J. (2013) · Molecular Nutrition & Food Research · doi:10.1002/mnfr.201300409 · Cited by 39
CSF biomarkers in neurodegenerative and vascular dementias
Llorens, F., Schmitz, M., Ferrer, I., & Zerr, I. (2016) · Progress in Neurobiology · doi:10.1016/j.pneurobio.2016.03.003 · Cited by 44
“Additionally, the application of a Misfolded Protein Assay (MPA) for the detection of soluble oligomers allows specific detection of Ab40 and Ab42 oligomers in the CSF; this is important as Ab40 but not Ab42 oligomers are increased in the CSF in AD patients (Gao et al., 2010).”
BackgroundProtein misfolding cyclic amplification (PMCA): Current status and future directions
Saá, P., & Červen̆áková, L. (2014) · Virus Research · doi:10.1016/j.virusres.2014.11.007 · Cited by 37
Estrada, L. D., Chamorro, D., Yañez, M. J., González, M., Leal, N. R., Rommy von Bernhardi, M., Dulcey, A. E., Marugán, J., Ferrer, M., Soto, C. A., et al. (2016) · Journal of Alzheimer s Disease · doi:10.3233/jad-151087 · Cited by 35
Methods for the Specific Detection and Quantitation of Amyloid-β Oligomers in Cerebrospinal Fluid
Schuster, J., & Funke, S. A. (2016) · Journal of Alzheimer s Disease · doi:10.3233/jad-151029 · Cited by 34
“Interestingly, similar results were not found for A 42 aggregates [33].”
ResultPolypeptoids synthesis based on Ugi reaction: Advances and perspectives
Tao, Y., Wang, Z., & Tao, Y. (2019) · Biopolymers · doi:10.1002/bip.23288 · Cited by 30
Beta-Amyloid Instigates Dysfunction of Mitochondria in Cardiac Cells
Jang, S., Chapa‐Dubocq, X. R., Parodi‐Rullán, R. M., Fossati, S., & Javadov, S. A. (2022) · Cells · doi:10.3390/cells11030373 · Cited by 30
Zhuo, C., Li, Z., Cui, J., Song, Z., Tang, Q., Yin, Y., Zhang, G., Liao, X., Liu, Z., & Gao, F. (2023) · Analytica Chimica Acta · doi:10.1016/j.aca.2023.340889 · Cited by 28
The elusive nature and diagnostics of misfolded Aβ oligomers
Cerasoli, E., Ryadnov, M. G., & Austen, B. (2015) · Frontiers in Chemistry · doi:10.3389/fchem.2015.00017 · Cited by 30
“…value of Aβ oligomers for early diagnosis and as a possible surrogate biomarker in clinical trials (Sian et al., 2000; Austen et al., 2008; Gao et al., 2010; Yam et al., 2011; Herskovits et al., 2013; Lesne et al., 2013), Aβ has yet to be validated as a clinically acceptedmarker for AD…”
BackgroundHaxton, T. K., Mannige, R. V., Zuckermann, R. N., & Whitelam, S. (2014) · Journal of Chemical Theory and Computation · doi:10.1021/ct5010559 · Cited by 28
Correlation of Aβ oligomer levels in matched cerebrospinal fluid and serum samples
Kasai, T., Tokuda, T., Taylor, M., Kondo, M., Mann, D. M. A., Foulds, P. G., Nakagawa, M., & Allsop, D. (2013) · Neuroscience Letters · doi:10.1016/j.neulet.2013.06.029 · Cited by 26
Cerebrospinal fluid and blood biomarkers in the diagnostic assays of Alzheimer’s disease
Zhang, L., Liang, X., Zhang, Z., & Luo, H. (2021) · Journal of Innovative Optical Health Sciences · doi:10.1142/s1793545822300014 · Cited by 24
Funke, S. A. (2011) · International Journal of Alzheimer s Disease · doi:10.4061/2011/151645 · Cited by 23
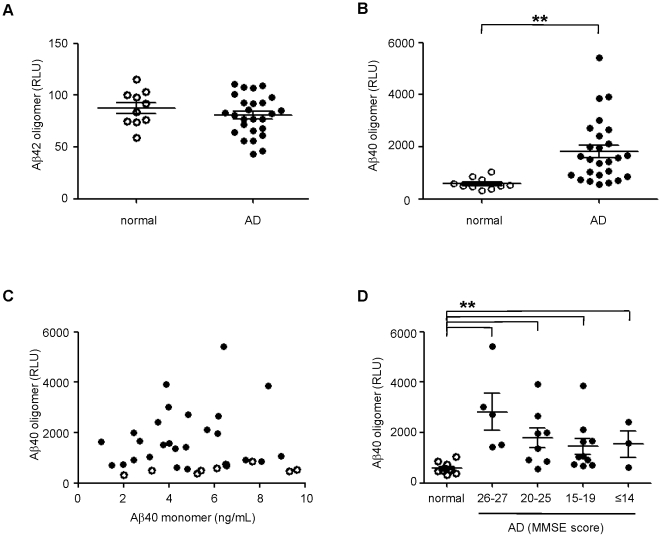
“Interestingly, in CSF samples of 26 AD patients, higher amounts of Aβ1-40 aggregates could be detected than in the samples of 10 agematched controls [29].”
BackgroundRosa‐Neto, P., Hsiung, G. R., Masellis, M., & participants, O. B. O. T. C. (2013) · Alzheimer s Research & Therapy · doi:10.1186/alzrt223 · Cited by 24
“Novel assays of misfolded protein for the detection of soluble Aβ1–40 and Aβ1–42 oligomers in CSF have shown promise in terms of greater accuracy in differentiating patients with MCI and AD from normal controls, as compared with the usual methods based on fibrillar forms of the peptide [15,78].”
BackgroundResultZetterberg, H., Lautner, R., Skillbäck, T. B., Rosén, C., Shahim, P., Mattsson, N., & Blennow, K. (2014) · Advances in clinical chemistry · doi:10.1016/b978-0-12-800141-7.00005-x · Cited by 21
How many biomarkers to discriminate neurodegenerative dementia?
Sancesario, G. M., & Bernardini, S. (2015) · Critical Reviews in Clinical Laboratory Sciences · doi:10.3109/10408363.2015.1051658 · Cited by 23
Grant, M. K. O., Handoko, M., Rózga, M., Brinkmalm, G., Portelius, E., Blennow, K., Ashe, K. H., Zahs, K. R., & Liu, P. (2019) · PLoS ONE · doi:10.1371/journal.pone.0212815 · Cited by 19
Diner, I., Dooyema, J. M., Gearing, M., Walker, L. C., & Seyfried, N. T. (2017) · Bioconjugate Chemistry · doi:10.1021/acs.bioconjchem.7b00500 · Cited by 21
Cerebrospinal fluid biomarkers of Alzheimer’s disease
Sui, X., Liu, J., & Yang, X. (2014) · Neuroscience Bulletin · doi:10.1007/s12264-013-1412-1 · Cited by 17
The Role of α-sheet in Amyloid Oligomer Aggregation and Toxicity.
Bi, T., & Daggett, V. (2018) · Europe PMC (PubMed Central) · Cited by 16
A Window into the Heterogeneity of Human Cerebrospinal Fluid Aβ Peptides
Ghidoni, R., Paterlini, A., Albertini, V., Stoppani, E., Binetti, G. G., Fuxé, K., Benussi, L., & Agnati, L. F. (2011) · BioMed Research International · doi:10.1155/2011/697036 · Cited by 15
“Nevertheless Gao and coworkers, using a novel misfolded protein assay, found an enrichment of Aβ40containing oligomers in AD CSF [78] and suggested these assemblies as biomarker for early diagnosis of AD.”
BackgroundField amplified sample stacking of amyloid beta (1-42) oligomers using capillary electrophoresis
Paracha, S., & Hestekin, C. N. (2016) · Biomicrofluidics · doi:10.1063/1.4954051 · Cited by 13
Greiner, E. R., Kelly, J. W., & Palhano, F. L. (2014) · PLoS ONE · doi:10.1371/journal.pone.0105433 · Cited by 13
Unusual molecular mechanism behind the thermal response of polypeptoids in aqueous solutions
Ma, J., Xuan, S., Guerin, A. C., Yu, T., Zhang, D., & Kuroda, D. G. (2017) · Physical Chemistry Chemical Physics · doi:10.1039/c6cp08536a · Cited by 13
Screening of sorbents for recovery of succinic and itaconic acid from fermentation broths
Wever, H. D., & Dennewald, D. (2017) · Journal of Chemical Technology & Biotechnology · doi:10.1002/jctb.5366 · Cited by 11
Herpetosiphon Secondary Metabolites Inhibit Amyloid-β Toxicity in Human Primary Astrocytes
Dehhaghi, M., Panahi, H. K. S., Braidy, N., & Guillemin, G. J. (2020) · Journal of Alzheimer s Disease · doi:10.3233/jad-200116 · Cited by 11
da Rosa, M. I., Perucchi, J. L., Medeiros, L. R., Fernandes, B. B., dos Reis, M. E. F., & Silva, B. R. (2014) · Journal of Alzheimer s Disease · doi:10.3233/jad-132264 · Cited by 11
Mao, P. (2012) · Advances in Biological Chemistry · doi:10.4236/abc.2012.22022 · Cited by 10
Hornemann, S., Schwarz, P., Rushing, E. J., Connolly, M. D., Zuckermann, R. N., Yam, A. Y.-W., & Aguzzi, A. (2019) · PLoS ONE · doi:10.1371/journal.pone.0216013 · Cited by 10
Kasai, T., Tokuda, T., Taylor, M., Nakagawa, M., & Allsop, D. (2012) · Biochemical and Biophysical Research Communications · doi:10.1016/j.bbrc.2012.04.146 · Cited by 10
Chen, C., Jong, Y., Chao, Y.-Y., Wang, C., & Chen, Y. (2022) · Analytical and Bioanalytical Chemistry · doi:10.1007/s00216-022-04350-7 · Cited by 9
“Furthermore, in the case of the clinical trial, the levels of AβO in AD patients were also found to be significantly higher than in healthy individuals [7, 8].”
BackgroundNew developments and concepts related to biomarker application to vaccines
Ahmed, S., BLACK, S. B., & Ulmer, J. B. (2011) · Microbial Biotechnology · doi:10.1111/j.1751-7915.2011.00277.x · Cited by 9
“In Alzheimer’s disease, a potential biomarker (Ab40) has been discovered that may facilitate earlier diagnosis of Alzheimer’s disease (Gao et al., 2010).”
BackgroundChallenges in understanding the structure/activity relationship of Aβ oligomers
Pilkington, A. W., & Legleiter, J. A. (2019) · AIMS Biophysics · doi:10.3934/biophy.2019.1.1 · Cited by 7
Multivalent foldamer-based affinity assay for selective recognition of Aβ oligomers
Olajos, G., Bartus, É., Schuster, I., Lautner, G., Gyurcsányi, R. E., Szögi, T., Fülöp, L., & Martinek, T. A. (2017) · Analytica Chimica Acta · doi:10.1016/j.aca.2017.01.013 · Cited by 7
Direct and selective nanosensor for amyloid-β oligomers in serum for Alzheimer's disease diagnosis
Song, Q., Zhang, H., Lan, Y., Kong, J., Wong, M. S., & Li, H. (2025) · RSC Advances · doi:10.1039/d5ra01020a · Cited by 6
Clinical significance of plasma candidate biomarkers of Alzheimer’s Disease
Lewczuk, P., Łukaszewicz‐Zając, M., Kornhuber, J., & Mroczko, B. (2024) · Neurologia i Neurochirurgia Polska · doi:10.5603/pjnns.100675 · Cited by 7
Protein Misfolding in Neurodegenerative Diseases: The Key Pending Questions
Soto, C. A., & Mitchell, C. (2013) · Cited by 6
Interactions between gold nanoparticles and amyloid β 25–35 peptide
Peng, J., Weng, J., Ren, L., & Sun, L. (2014) · IET Nanobiotechnology · doi:10.1049/iet-nbt.2013.0071 · Cited by 6
Peptoid self-assembly and opportunities for creating protein-mimetic biomaterials and biointerfaces
yaagoubi, M. E., Tewari, K. M., & Lau, K. H. A. (2018) · Elsevier eBooks · doi:10.1016/b978-0-08-102015-9.00006-x · Cited by 5
Webb, S. J. N., Chitta, S., Magden, E. R., & Simmons, J. H. (2025) · PLoS ONE · doi:10.1371/journal.pone.0318173 · Cited by 4
Biomarkers of Alzheimer’s Disease
Saeed, U., Swardfager, W., Black, S. E., & Masellis, M. (2017) · Mental health and illness worldwide · doi:10.1007/978-981-10-2414-6_8 · Cited by 4
Neuropathological Basis of Alzheimer’s Disease and Alzheimer’s Disease Diagnosis
Schneider, J. A., Montine, T. J., Sperling, R. A., & Bennett, D. A. (2012) · Advances in biological psychiatry · doi:10.1159/000335384 · Cited by 4
Amyloid-β in the Cerebrospinal Fluid of APP Transgenic Mice Does not Show Prion-like Properties
Skachokova, Z. K., Sprenger, F., Breu, K., Abramowski, D., Clavaguera, F., Hench, J., Staufenbiel, M., Tolnay, M., & Winkler, D. T. (2015) · Current Alzheimer Research · doi:10.2174/1567205012666150710115022 · Cited by 4
Alzheimer’s Disease and Other Neurodegenerative Disorders
Rosén, C., Zetterberg, H., & Blennow, K. (2015) · Springer eBooks · doi:10.1007/978-3-319-01225-4_20 · Cited by 2
Fluid Biomarkers in Alzheimer’s Disease and Frontotemporal Dementia
Mattsson, N., Grigoriou, S., & Zetterberg, H. (2018) · Springer eBooks · doi:10.1007/978-3-319-72938-1_11 · Cited by 2
In vitro screening on amyloid beta modulation of aqueous extracts from plant seeds
Okada, Y., & Okada, M. (2015) · Journal of Pharmacy And Bioallied Sciences · doi:10.4103/0975-7406.171688 · Cited by 2
“Yield was expressed as a gram of dry matter/mL. Yield was in the range of 0.137–0.246 g/mL. TPC was expressed as mg of chlorogenic acid equiv/g of dry matter [Table 1].”
InfluentialArtificial DnaJ Protein for protein production and conformational diseases
Hishiya, A., & Koya, K. (2017) · Scientific Reports · doi:10.1038/s41598-017-09067-7 · Cited by 2
Neuroimaging and molecular biomarkers of dementia
Polyakova, T., & Араблинский, А. В. (2017) · S S Korsakov Journal of Neurology and Psychiatry · doi:10.17116/jnevro20171176216-22 · Cited by 1
Bioinspired Polymers for Regenerative Medicine
Khajehmohammadi, M., Tolabi, H., Kabbani, L., & Ashammakhi, N. A. (2025) · Springer eBooks · doi:10.1007/978-3-031-87744-5_2 · Cited by 1
Sancesario, G. (2012) · Journal of Molecular Biomarkers & Diagnosis · doi:10.4172/2155-9929.1000e107 · Cited by 1
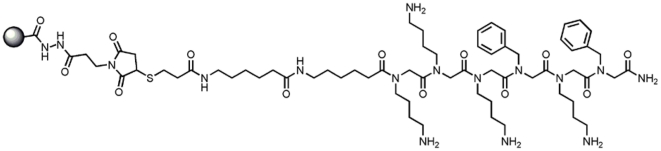
“[7] developed a complex method using a synthetic ligand, the Aggregate Specific Reagent 1 (ASR1) that preferentially binds aggregated proteins over monomeric proteins.”
MethodAdvances in Alzheimer’s Disease Management
Gauthier, S. G., & Rosa‐Neto, P. (2012) · doi:10.2217/9781780840840 · Cited by 1
Sahoo, S., Balireddygari, L. R., Padhy, A. A., Kumari, S., Hegde, P., & Mishra, P. (2024) · Elsevier eBooks · doi:10.1016/b978-0-443-21809-5.00003-x · Cited by 1
Martone, R. L., Snyder, R. H., Xu, A. S. L., & Reams, R. Y. (2012) · Current Translational Geriatrics and Experimental Gerontology Reports · doi:10.1007/s13670-012-0015-4
“ent platforms have been developed to interrogate the ability of a test therapeutic compound to cause ostensibly therapeutic reductions in Aβ or Aβ oligomers [35, 36].”
BackgroundSPECIFIC AMYLOID-BETA OLIGOMERS IN HUMAN CEREBROSPINAL FLUID
Handoko, M. (2012) · University of Minnesota Digital Conservancy (University of Minnesota)
New Frontiers in Alzheimer's Disease Diagnosis
Llorens, F., Nuhn, S., Peter, C., Zerr, I., & Stoeck, K. (2015) · InTech eBooks · doi:10.5772/59652 · Cited by 1
Fluid biomarkers in Alzheimer's disease - current
Rosén, C., Hansson, O., Blennow, K., & Zetterberg, H. (2013)
Fluid Biomarkers and Diagnostics
Zetterberg, H., & Blennow, K. (2016) · Elsevier eBooks · doi:10.1016/b978-0-12-802173-6.00021-6
Biomarkers of Alzheimer’s Disease
Saeed, U., Swardfager, W., Black, S. E., & Masellis, M. (2017) · Mental health and illness worldwide · doi:10.1007/978-981-10-0370-7_8-1
Metadata
- Authors
- Gao, C. M., Yam, A. Y., Wang, X., Magdangal, E., Salisbury, C., Peretz, D., Zuckermann, R. N., Connolly, M. D., Hansson, O., Minthon, L., Zetterberg, H., Blennow, K., Fedynyshyn, J. P., & Allauzen, S.
- Affiliations
- Lund University (SE)
- Sahlgrenska University Hospital (SE)
- Corresponding author
- Fedynyshyn, Joseph P.
- ORCID
- Venue
- PLoS ONE
- Publisher
- Public Library of Science (PLoS)
- Published
- 2010-12-30
- Volume
- 5
- Issue
- 12
- Pages
- e15725
- ISSN
- 1932-6203 (ISSN-L)
- PMC
- PMC3012719
- OpenAlex
- W2135057867
- Cited by
- 105
- References
- 39
- Citations by year
- 2026: 2 · 2025: 3 · 2024: 2 · 2023: 1 · 2022: 3 · 2021: 2 · 2020: 2 · 2019: 8 · 2018: 4 · 2017: 11 · 2016: 9 · 2015: 10 · 2014: 17 · 2013: 13 · 2012: 12
- FWCI
- 6.72
- Type
- journal article
- Language
- en
- Open access
- gold
- doi.org
- Locations
- PLoS ONE (publishedVersion, cc-by)
- PubMed Central (publishedVersion, cc-by)
- PubMed (publishedVersion)
- DOAJ (DOAJ: Directory of Open Access Journals) (submittedVersion, cc-by-sa)
- UCL Discovery (University College London) (submittedVersion)
- Lund University Publications (Lund University) (submittedVersion, other-oa)
- Topics
- Life Sciences › Neuroscience › Cellular and Molecular Neuroscience › Alzheimer's disease research and treatments
- Health Sciences › Medicine › Psychiatry and Mental health › Dementia and Cognitive Impairment Research
- Life Sciences › Neuroscience › Neurology › Neuroinflammation and Neurodegeneration Mechanisms
- Keywords
- Alzheimer's disease, Aβ40, amyloid-beta 42, cerebrospinal fluid biomarkers, early diagnosis, amyloid plaques, sensitivity and specificity
- MeSH terms
- Aged, Alzheimer Disease, Epitopes, Brain, Enzyme-Linked Immunosorbent Assay, Gene Expression Regulation, Humans, Middle Aged, Models, Chemical, Molecular Conformation, Peptide Fragments, Peptides, Protein Conformation, Sensitivity and Specificity, Biomarkers, Amyloid beta-Peptides
About these checks
Registry, retraction, Cites and statistics results are computed, not judged, with one exception: a printed reference that no index lists is read once by a model before it counts as a citation error. Claims are extracted by a model and kept only when their quote appears verbatim in the text; each cited source is then checked, with a model’s help, for whether it says what the claim relies on. Those verdicts can be wrong — read the claim’s quote and the cited source before relying on one.
Statistics and arithmetic are recomputed, not judged.
Confidence bands are shown only for fields calibrated on our annotated test set. None is calibrated yet, so no band is shown.
What counts as a claim ›How we measure confidence ›How we check this ›
Are you an author, or do you see a problem with this page? Request a review
