

The DOI matches its Crossref record; 32 of the 32 references it cites were found in a registry or an index.
Age-Related Differences in Plasma Proteins: How Plasma Proteins Change from Neonates to Adults
Open accessAbstract
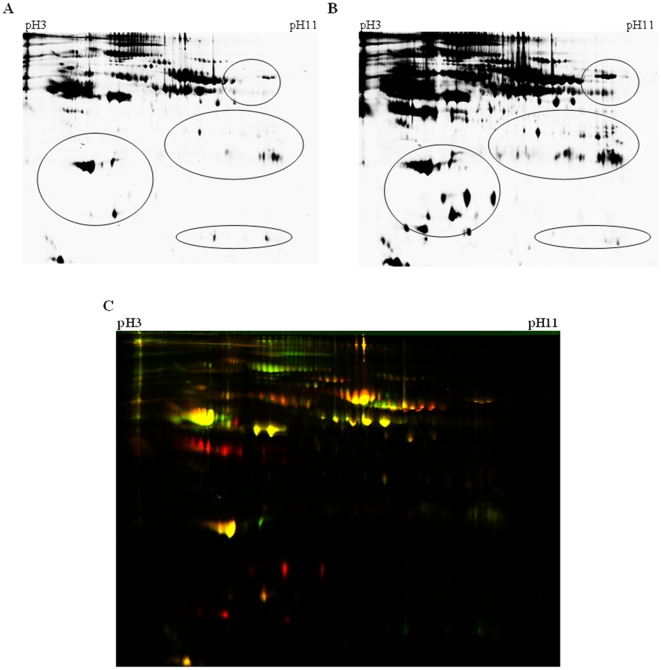
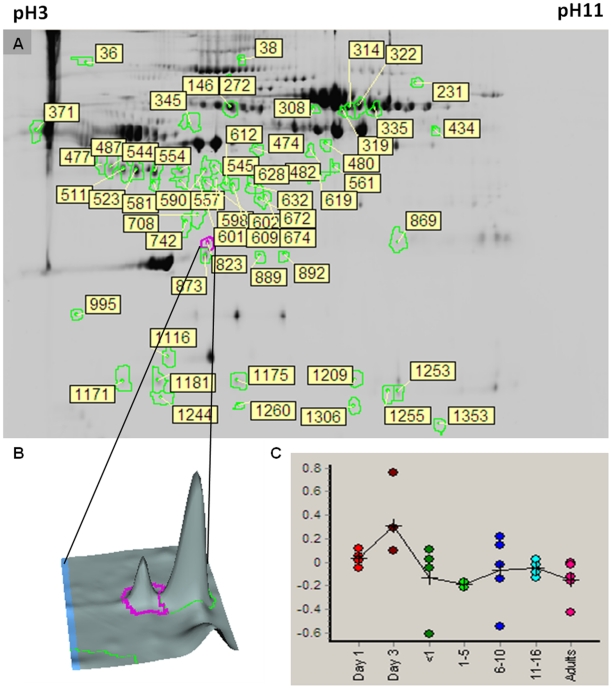
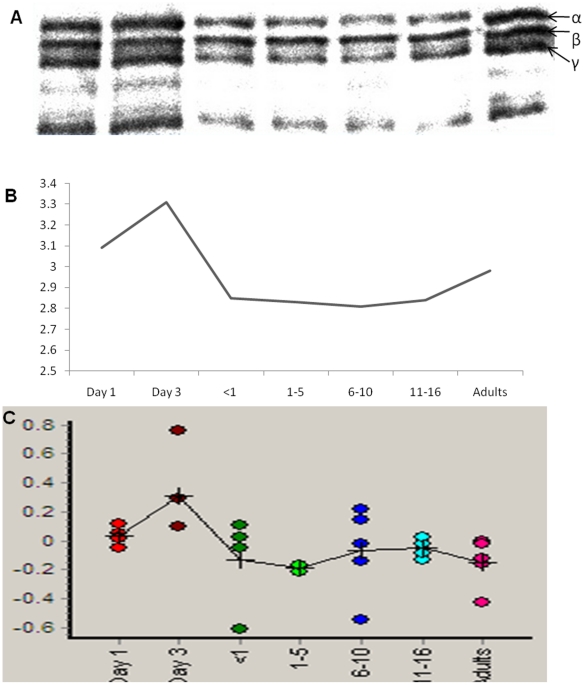
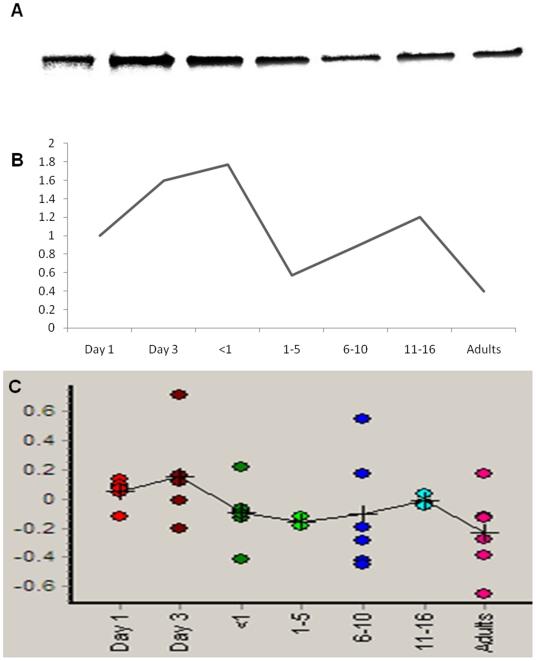
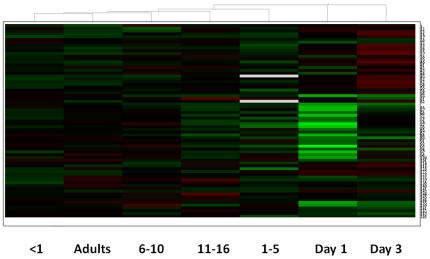
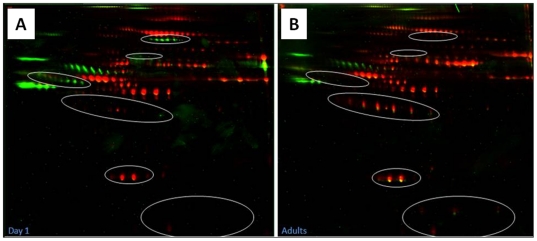
The incidence of major diseases such as cardiovascular disease, thrombosis and cancer increases with age and is the major cause of mortality world-wide, with neonates and children somehow protected from such diseases of ageing. We hypothesized that there are major developmental differences in plasma proteins and that these contribute to age-related changes in the incidence of major diseases. We evaluated the human plasma proteome in healthy neonates, children and adults using the 2D-DIGE approach. We demonstrate significant changes in number and abundance of up to 100 protein spots that have marked differences in during the transition of the plasma proteome from neonate and child through to adult. These proteins are known to be involved in numerous physiological processes such as iron transport and homeostasis, immune response, haemostasis and apoptosis, amongst others. Importantly, we determined that the proteins that are differentially expressed with age are not the same proteins that are differentially expressed with gender and that the degree of phosphorylation of plasma proteins also changes with age. Given the multi-functionality of these proteins in human physiology, understanding the differences in the plasma proteome in neonates and children compared to adults will make a major contribution to our understanding of developmental biology in humans.
Overview
The claims and statistics of this paper haven’t been checked yet.
Run the check — free, no account needed. It reads the open-access text and checks the sources it cites.
Integrity signals
Registry
Cites
Statistics
Figures
Verification
Claims the paper makes
The claims and statistics of this paper haven’t been checked yet.
Run the check — free, no account needed. It reads the open-access text and checks the sources it cites.
Claims other papers make about this one
Each is checked against this paper’s own text: does it say what the citing paper says it does?
In the citing paper
“Studies using multiple proteomic technologies have shown that thousands of proteins change with age in human plasma91–93 and cerebrospinal fluid94, which has recently led to the development of multiple proteomic ageing clocks.”
From Measuring biological age using omics data (2022) · cites this paper as [92]
Self-check
Percentages, sums and reported differences re-computed from the paper’s own numbers.
The self-check needs the paper’s full text.
Citations
Cites
Holick, M. F. (2007) · New England Journal of Medicine · doi:10.1056/nejmra070553 · Cited by 13,720
Fibrinogen Stimulates Macrophage Chemokine Secretion Through Toll-Like Receptor 4
Smiley, S. T., King, J. A., & Hancock, W. W. (2001) · The Journal of Immunology · doi:10.4049/jimmunol.167.5.2887 · Cited by 946
Maturation of the hemostatic system during childhood
Andrew, M., Vegh, P., Johnston, M., Bowker, J., Ofosu, F. A., & Mitchell, L. (1992) · Blood · doi:10.1182/blood.v80.8.1998.1998 · Cited by 923
Barnes, C. D., Ignjatović, V., Furmedge, J., Newall, F. H., Chan, A. K. C., Rosa, L. D., Hamilton, S., Ragg, P., Robinson, S., Auldist, A., et al. (2006) · Thrombosis and Haemostasis · doi:10.1160/th05-01-0047 · Cited by 517
Self-citationThe Impact of COPD on Lung Health Worldwide
Hurd, S. S. (2000) · CHEST Journal · doi:10.1378/chest.117.2_suppl.1s · Cited by 338
Investigating diversity in human plasma proteins
Nedelkov, D., Kiernan, U. A., Niederkofler, E. E., Tubbs, K. A., & Nelson, R. W. (2005) · Proceedings of the National Academy of Sciences · doi:10.1073/pnas.0500426102 · Cited by 192
High Dynamic Range Characterization of the Trauma Patient Plasma Proteome
Liu, T., Qian, W., Gritsenko, M. A., Xiao, W., Moldawer, L. L., Kaushal, A., Monroe, M. E., Varnum, S. M., Moore, R., Purvine, S. O., et al. (2006) · Molecular & Cellular Proteomics · doi:10.1074/mcp.m600068-mcp200 · Cited by 159
Kierulf, P., Sandset, P. M., Klingenberg, O., Joø, G. B., Godal, H. C., Skjønsberg, O. H., & Jensen, T. (2007) · Thrombosis and Haemostasis · doi:10.1160/th07-01-0039 · Cited by 140
Santilli, G., Aronow, B. J., & Sala, A. (2003) · Journal of Biological Chemistry · doi:10.1074/jbc.c300252200 · Cited by 138
Fibrinogen activates NF-kappa B transcription factors in mononuclear phagocytes.
Sitrin, R. G., Pan, P., Srikanth, S., & Todd, R. F. (1998) · PubMed · Cited by 129
Cited by
Sorted by citations
DNA methylation GrimAge strongly predicts lifespan and healthspan
Lu, A. T., Quach, A., Wilson, J. G., Reiner, A. P., Aviv, A., Raj, K., Hou, L., Baccarelli, A. A., Li, Y., Stewart, J. D., et al. (2019) · Aging · doi:10.18632/aging.101684 · Cited by 2,540
Jylhävä, J., Pedersen, N. L., & Hägg, S. (2017) · EBioMedicine · doi:10.1016/j.ebiom.2017.03.046 · Cited by 1,240
Measuring biological age using omics data
Rutledge, J., Oh, H., & Wyss-Coray, T. (2022) · Nature Reviews Genetics · doi:10.1038/s41576-022-00511-7 · Cited by 570
Ignjatović, V., Geyer, P. E., Palaniappan, K. K., Chaaban, J. E., Omenn, G. S., Baker, M. S., Deutsch, E. W., & Schwenk, J. M. (2019) · Journal of Proteome Research · doi:10.1021/acs.jproteome.9b00503 · Cited by 237
Clinical controversies in anticoagulation monitoring and antithrombin supplementation for ECMO
Chlebowski, M., Baltagi, S. A., Carlson, M., Levy, J. H., & Spinella, P. C. (2020) · Critical Care · doi:10.1186/s13054-020-2726-9 · Cited by 207
Metadata
- Authors
- Ignjatovic, V., Lai, C., Summerhayes, R., Mathesius, U., Tawfilis, S., Perugini, M. A., & Monagle, P.
- Affiliations
- Royal Children's Hospital (AU)
- Australian National University (AU)
- The University of Melbourne (AU)
- Venue
- PLoS ONE
- Publisher
- Public Library of Science (PLoS)
- Published
- 2011-02-18
- Volume
- 6
- Issue
- 2
- Pages
- e17213
- ISSN
- 1932-6203 (ISSN-L)
- PMC
- PMC3041803
- OpenAlex
- W1971352522
- Cited by
- 132
- References
- 32
- Citations by year
- 2026: 6 · 2025: 8 · 2024: 6 · 2023: 7 · 2022: 5 · 2021: 14 · 2020: 16 · 2019: 11 · 2018: 9 · 2017: 6 · 2016: 7 · 2015: 4 · 2014: 15 · 2013: 6 · 2012: 8
- FWCI
- 4.65
- Type
- journal article
- Language
- en
- Open access
- gold
- doi.org
- Locations
- PLoS ONE (publishedVersion, cc-by)
- PubMed Central (publishedVersion, cc-by)
- PubMed (publishedVersion)
- Minerva Access (University of Melbourne) (submittedVersion, cc-by)
- DOAJ (DOAJ: Directory of Open Access Journals) (submittedVersion, cc-by-sa)
- ANU Open Research (Australian National University) (submittedVersion, cc-by)
- Funders
- University of Melbourne
- Topics
- Physical Sciences › Chemistry › Spectroscopy › Advanced Proteomics Techniques and Applications
- Life Sciences › Biochemistry, Genetics and Molecular Biology › Molecular Biology › Advanced Biosensing Techniques and Applications
- Life Sciences › Biochemistry, Genetics and Molecular Biology › Aging › Genetics, Aging, and Longevity in Model Organisms
- Keywords
- plasma proteome, age-related changes, neonates, children, developmental differences, protein phosphorylation, iron transport, hemostasis, immune response, apoptosis, sex differences, 2D-DIGE, human development
- MeSH terms
- Adolescent, Adult, Age Factors, Aging, Blood Proteins, Child, Child, Preschool, Female, Humans, Infant, Infant, Newborn, Male, Phosphoproteins, Electrophoresis, Gel, Two-Dimensional, Proteome, Validation Studies as Topic
About these checks
Registry, retraction, Cites and statistics results are computed, not judged, with one exception: a printed reference that no index lists is read once by a model before it counts as a citation error. Claims are extracted by a model and kept only when their quote appears verbatim in the text; each cited source is then checked, with a model’s help, for whether it says what the claim relies on. Those verdicts can be wrong — read the claim’s quote and the cited source before relying on one.
Statistics and arithmetic are recomputed, not judged.
Confidence bands are shown only for fields calibrated on our annotated test set. None is calibrated yet, so no band is shown.
What counts as a claim ›How we measure confidence ›How we check this ›
Are you an author, or do you see a problem with this page? Request a review
