

The DOI matches its Crossref record; 75 of the 75 references it cites were found in a registry or an index.
MicroRNA Expression Aberration as Potential Peripheral Blood Biomarkers for Schizophrenia
Open accessAbstract
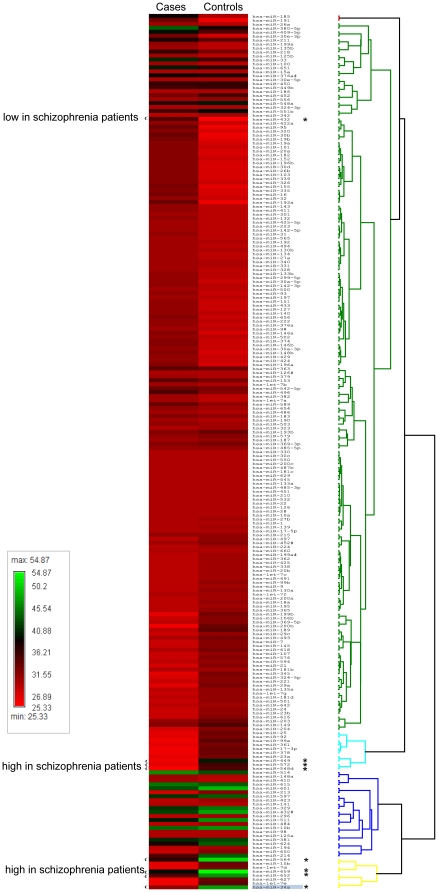
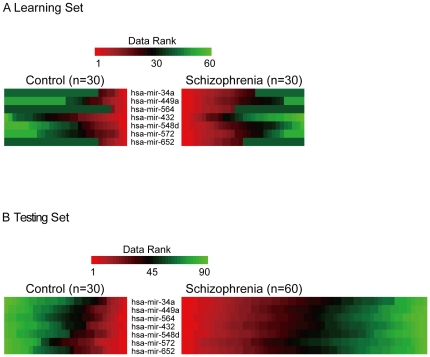
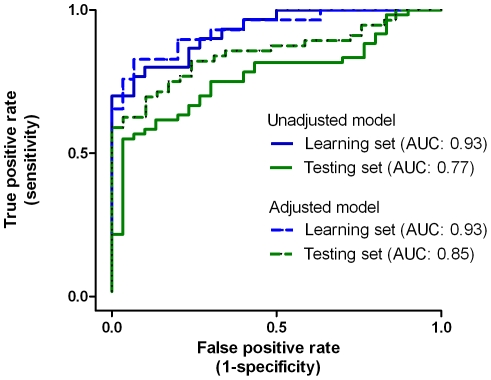
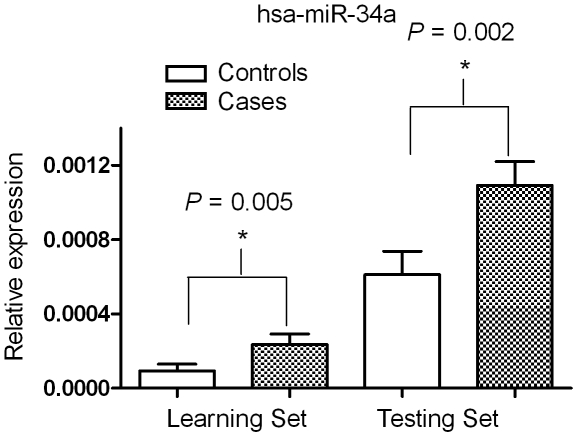
Since brain tissue is not readily accessible, a new focus in search of biomarkers for schizophrenia is blood-based expression profiling of non-protein coding genes such as microRNAs (miRNAs), which regulate gene expression by inhibiting the translation of messenger RNAs. This study aimed to identify potential miRNA signature for schizophrenia by comparing genome-wide miRNA expression profiles in patients with schizophrenia vs. healthy controls. A genome-wide miRNA expression profiling was performed using a Taqman array of 365 human miRNAs in the mononuclear leukocytes of a learning set of 30 cases and 30 controls. The discriminating performance of potential biomarkers was validated in an independent testing set of 60 cases and 30 controls. The expression levels of the miRNA signature were then evaluated for their correlation with the patients' clinical symptoms, neurocognitive performances, and neurophysiological functions. A seven-miRNA signature (hsa-miR-34a, miR-449a, miR-564, miR-432, miR-548d, miR-572 and miR-652) was derived from a supervised classification with internal cross-validation, with an area under the curve (AUC) of receiver operating characteristics of 93%. The putative signature was then validated in the testing set, with an AUC of 85%. Among these miRNAs, miR-34a was differentially expressed between cases and controls in both the learning (P = 0.005) and the testing set (P = 0.002). These miRNAs were differentially correlated with patients' negative symptoms, neurocognitive performance scores, and event-related potentials. The results indicated that the mononuclear leukocyte-based miRNA profiling is a feasible way to identify biomarkers for schizophrenia, and the seven-miRNA signature warrants further investigation.
Overview
The claims and statistics of this paper haven’t been checked yet.
Run the check — free, no account needed. It reads the open-access text and checks the sources it cites.
Integrity signals
Registry
Cites
Statistics
Figures
Verification
Claims the paper makes
The claims and statistics of this paper haven’t been checked yet.
Run the check — free, no account needed. It reads the open-access text and checks the sources it cites.
Claims other papers make about this one
Each is checked against this paper’s own text: does it say what the citing paper says it does?
The cited source says what the claim attributes to it.
In the citing paper
“miR-34 dysregulation is related to different psychiatric disorders, including schizophrenia236, Alzheimer’s disease,237 and MDD.238”
From Epigenetic regulation in major depression and other stress-related disorders: molecular mechanisms, clinical relevance and therapeutic potential (2023) · cites this paper as [236]
Self-check
Percentages, sums and reported differences re-computed from the paper’s own numbers.
The self-check needs the paper’s full text.
Citations
Cites
Diagnostic and Statistical Manual of Mental Disorders
Williams, J. B. W., & First, M. B. (2013) · Oxford University Press eBooks · doi:10.1093/acrefore/9780199975839.013.104 · Cited by 109,845
Controlling the False Discovery Rate: A Practical and Powerful Approach to Multiple Testing
Benjamini, Y., & Hochberg, Y. (1995) · Journal of the Royal Statistical Society Series B: Statistical Methodology · doi:10.1111/j.2517-6161.1995.tb02031.x · Cited by 109,482
Lewis, B. P., Burge, C. B., & Bartel, D. P. (2005) · Cell · doi:10.1016/j.cell.2004.12.035 · Cited by 11,855
The functions of animal microRNAs
Ambros, V. (2004) · Nature · doi:10.1038/nature02871 · Cited by 10,728
Gene selection for cancer classification using support vector machines
Guyon, I., Weston, J., Barnhill, S., & Vapnik, V. (2002) · Machine Learning · doi:10.1023/a:1012487302797 · Cited by 9,954
Diagnostic and Statistical Manual of Mental Disorders
Siegel, L. J., & Fletcher‐Janzen, E. (2008) · Wiley eBooks · doi:10.1002/9780470373699.speced0655 · Cited by 8,467
The Endophenotype Concept in Psychiatry: Etymology and Strategic Intentions
Gottesman, I. I., & Gould, T. D. (2003) · American Journal of Psychiatry · doi:10.1176/appi.ajp.160.4.636 · Cited by 5,615
Combinatorial microRNA target predictions
Krek, A., Grün, D., Poy, M. N., Wolf, R., Rosenberg, L., Epstein, E. J., MacMenamin, P., da Piedade, I., Gunsalus, K. C., Stoffel, M., et al. (2005) · Nature Genetics · doi:10.1038/ng1536 · Cited by 4,603
Wisconsin Card Sorting Test Manual – Revised and Expanded
Heaton, R. K., Chelune, C., Talley, J., Kay, G., & Curtiss, G. (1981) · Medical Entomology and Zoology · Cited by 2,975
The microRNA.org resource: targets and expression
Betel, D., Wilson, M. T., Gabow, A. P., Marks, D. S., & Sander, C. (2007) · Nucleic Acids Research · doi:10.1093/nar/gkm995 · Cited by 2,530
Research works printed but not linked: 1
- JJ Cheng, 1996, Positive and Negative Syndrome Scale (PANSS): establishment and reliability study of a Mandarin Chinese language version., Chinese Psychiatry, 10, 251
Cited by
Sorted by citations
MicroRNA profiling: approaches and considerations
Pritchard, C. C., Cheng, H. H., & Tewari, M. (2012) · Nature Reviews Genetics · doi:10.1038/nrg3198 · Cited by 1,765
Circulating miRNA Biomarkers for Alzheimer's Disease
Kumar, P., Dezső, Z., MacKenzie, C. J., Oestreicher, J., Agoulnik, S. I., Byrne, M., Bernier, F., Yanagimachi, M., Aoshima, K., & Oda, Y. (2013) · PLoS ONE · doi:10.1371/journal.pone.0069807 · Cited by 400
Miller, B. H., Zeier, Z., Xi, L., Lanz, T. A., Deng, S., Strathmann, J., Willoughby, D., Kenny, P. J., Elsworth, J. D., Lawrence, M. S., et al. (2012) · Proceedings of the National Academy of Sciences · doi:10.1073/pnas.1113793109 · Cited by 309
Banigan, M. G., Kao, P. F., Kozubek, J. A., Winslow, A. R., Medina, J., Costa, J., Schmitt, A., Schneider, A., Cabral, H., Cagsal‐Getkin, O., et al. (2013) · PLoS ONE · doi:10.1371/journal.pone.0048814 · Cited by 271
The microRNAs within the DLK1-DIO3 genomic region: involvement in disease pathogenesis
Benetatos, L., Hatzimichael, E. C., Londin, E. R., Vartholomatos, G., Loher, P., Rigoutsos, I., & Briasoulis, E. C. (2012) · Cellular and Molecular Life Sciences · doi:10.1007/s00018-012-1080-8 · Cited by 279
Metadata
- Authors
- Lai, C.-Y., Yu, S.-L., Hsieh, M. H., Chen, C.-H., Chen, H.-Y., Wen, C.-C., Huang, Y.-H., Hsiao, P.-C., Hsiao, C. K., Liu, C.-M., Yang, P.-C., Hwu, H.-G., & Chen, W. J.
- Affiliations
- National Taiwan University (TW)
- Institute of Statistical Science, Academia Sinica (TW)
- Corresponding author
- Chen, Wei J.
- ORCID
- Venue
- PLoS ONE
- Publisher
- Public Library of Science (PLoS)
- Published
- 2011-06-29
- Volume
- 6
- Issue
- 6
- Pages
- e21635
- ISSN
- 1932-6203 (ISSN-L)
- PMC
- PMC3126851
- OpenAlex
- W2065980876
- Cited by
- 228
- References
- 75
- Citations by year
- 2026: 6 · 2025: 7 · 2024: 13 · 2023: 6 · 2022: 8 · 2021: 18 · 2020: 10 · 2019: 13 · 2018: 18 · 2017: 20 · 2016: 25 · 2015: 18 · 2014: 29 · 2013: 20 · 2012: 12
- FWCI
- 14.31
- Type
- journal article
- Language
- en
- Open access
- gold
- doi.org
- Locations
- PLoS ONE (publishedVersion, cc-by)
- PubMed Central (publishedVersion, cc-by)
- PubMed (publishedVersion)
- DOAJ (DOAJ: Directory of Open Access Journals) (submittedVersion, cc-by-sa)
- Figshare (submittedVersion, cc-by)
- Funders
- National Science Council (NSC98-2314-B-002-125-MY3)
- National Health Research Institutes (NHRI-EX99-9511PP)
- National Taiwan University (97R0337, 97HP0071, 97HP0023)
- Topics
- Health Sciences › Medicine › Psychiatry and Mental health › Schizophrenia research and treatment
- Life Sciences › Biochemistry, Genetics and Molecular Biology › Cancer Research › MicroRNA in disease regulation
- Life Sciences › Neuroscience › Biological Psychiatry › Tryptophan and brain disorders
- Keywords
- schizophrenia, microRNA expression, peripheral blood biomarkers, microRNA signature, mononuclear leukocytes, miR-34a, negative symptoms, neuropsychological performance, event-related potentials, blood-based diagnosis
- MeSH terms
- Humans, Schizophrenia, Biomarkers, Case-Control Studies, MicroRNAs
About these checks
Registry, retraction, Cites and statistics results are computed, not judged, with one exception: a printed reference that no index lists is read once by a model before it counts as a citation error. Claims are extracted by a model and kept only when their quote appears verbatim in the text; each cited source is then checked, with a model’s help, for whether it says what the claim relies on. Those verdicts can be wrong — read the claim’s quote and the cited source before relying on one.
Statistics and arithmetic are recomputed, not judged.
Confidence bands are shown only for fields calibrated on our annotated test set. None is calibrated yet, so no band is shown.
What counts as a claim ›How we measure confidence ›How we check this ›
Are you an author, or do you see a problem with this page? Request a review
