

The DOI matches its Crossref record; 63 of the 63 references it cites were found in a registry or an index.
Enhanced Osteoclastic Resorption and Responsiveness to Mechanical Load in Gap Junction Deficient Bone
Open accessAbstract
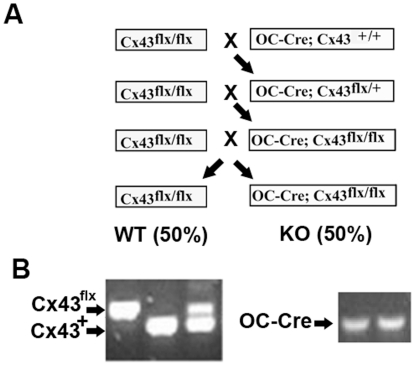
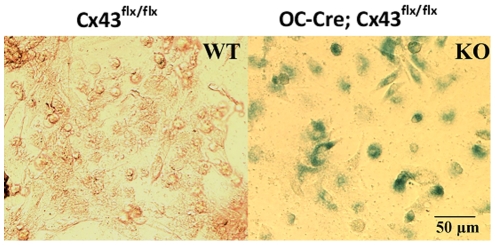
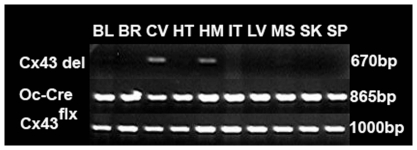
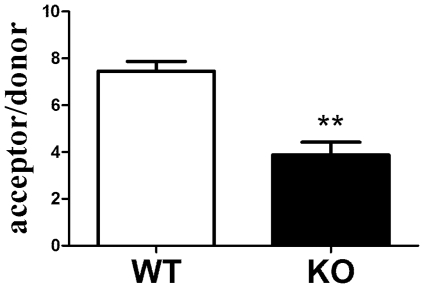
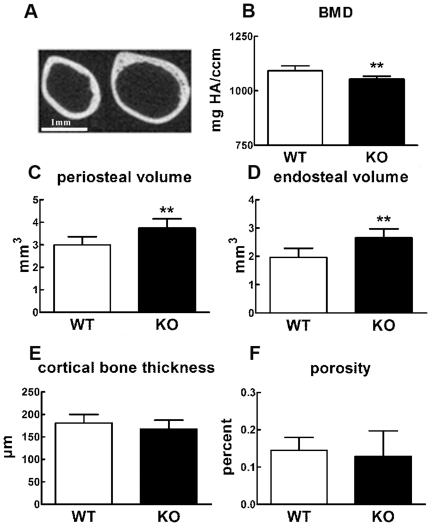
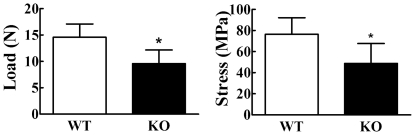
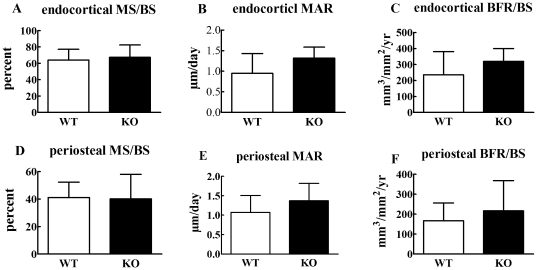
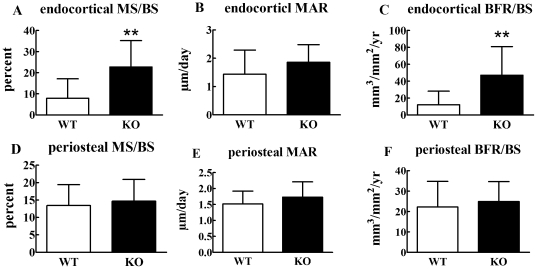
Emerging evidence suggests that connexin mediated gap junctional intercellular communication contributes to many aspects of bone biology including bone development, maintenance of bone homeostasis and responsiveness of bone cells to diverse extracellular signals. Deletion of connexin 43, the predominant gap junction protein in bone, is embryonic lethal making it challenging to examine the role of connexin 43 in bone in vivo. However, transgenic murine models in which only osteocytes and osteoblasts are deficient in connexin 43, and which are fully viable, have recently been developed. Unfortunately, the bone phenotype of different connexin 43 deficient models has been variable. To address this issue, we used an osteocalcin driven Cre-lox system to create osteoblast and osteocyte specific connexin 43 deficient mice. These mice displayed bone loss as a result of increased bone resorption and osteoclastogenesis. The mechanism underlying this increased osteoclastogenesis included increases in the osteocytic, but not osteoblastic, RANKL/OPG ratio. Previous in vitro studies suggest that connexin 43 deficient bone cells are less responsive to biomechanical signals. Interestingly, and in contrast to in vitro studies, we found that connexin 43 deficient mice displayed an enhanced anabolic response to mechanical load. Our results suggest that transient inhibition of connexin 43 expression and gap junctional intercellular communication may prove a potentially powerful means of enhancing the anabolic response of bone to mechanical loading.
Overview
The claims and statistics of this paper haven’t been checked yet.
Run the check — free, no account needed. It reads the open-access text and checks the sources it cites.
Integrity signals
Registry
Cites
Statistics
Figures
Verification
Claims the paper makes
The claims and statistics of this paper haven’t been checked yet.
Run the check — free, no account needed. It reads the open-access text and checks the sources it cites.
Claims other papers make about this one
Each is checked against this paper’s own text: does it say what the citing paper says it does?
In the citing paper
“Conditional knockout of Cx43 in osteoblasts and osteocytes in mice led to various degrees of osteopenia depending on the differentiation state in which the deletion was induced,20,21 suggesting that functional Cx43 in osteoblasts and osteocytes is essential for normal bone mass acquisition and maintenance.”
From Bone remodeling: an operational process ensuring survival and bone mechanical competence (2022) · cites this paper as [21]
Self-check
Percentages, sums and reported differences re-computed from the paper’s own numbers.
The self-check needs the paper’s full text.
Citations
Cites
Mechanical Stimulation of Bone in Vivo Reduces Osteocyte Expression of Sost/Sclerostin
Robling, A. G., Niziolek, P. J., Baldridge, L. A., Condon, K. W., Allen, M. R., Alam, I., Mantila, S. M., Gluhak-Heinrich, J., Bellido, T. M., Harris, S. E., et al. (2008) · Journal of Biological Chemistry · doi:10.1074/jbc.m705092200 · Cited by 1,350
Cardiac Malformation in Neonatal Mice Lacking Connexin43
Reaume, A. G., Sousa, P. A. D., Kulkarni, S., Langille, B. L., Zhu, D., Davies, T. C., Juneja, S. C., Kidder, G. M., & Rossant, J. (1995) · Science · doi:10.1126/science.7892609 · Cited by 1,243
Mechanotransduction and the functional response of bone to mechanical strain
Duncan, R., & Turner, C. (1995) · Calcified Tissue International · doi:10.1007/bf00302070 · Cited by 944
Targeted ablation of osteocytes induces osteoporosis with defective mechanotransduction.
Tatsumi, S., Ishii, K., Amizuka, N., Li, M., Kobayashi, T., Kohno, K., Ito, M., Takeshita, S., & Ikeda, K. (2007) · Cell Metabolism · doi:10.1016/j.cmet.2007.05.001 · Cited by 848
Zhang, M., Xuan, S., Bouxsein, M., Stechow, D. V., Akeno, N., Faugere, M.-C., Malluche, H. H., Zhao, G., Rosen, C. J., Efstratiadis, A., et al. (2002) · Journal of Biological Chemistry · doi:10.1074/jbc.m208265200 · Cited by 696
Connexin 43 (GJA1) Mutations Cause the Pleiotropic Phenotype of Oculodentodigital Dysplasia
Paznekas, W. A., Boyadjiev, S. A., Shapiro, R. E., Daniëls, O., Wollnik, B., Keegan, C. E., Innis, J. W., Dinulos, M. B., Christian, C., Hannibal, M., et al. (2003) · The American Journal of Human Genetics · doi:10.1086/346090 · Cited by 620
Garnero, P., Ferreras, M., Karsdal, M. A., NicAmhlaoibh, R., Risteli, J., Borel, O., Qvist, P., Delmas, P. D., Foged, N., & Delaissé, J. (2003) · Journal of Bone and Mineral Research · doi:10.1359/jbmr.2003.18.5.859 · Cited by 472
Morphological evidence of gap junctions between bone cells
Doty, S. B. (1981) · Calcified Tissue International · doi:10.1007/bf02409482 · Cited by 456
Mechanotransduction in bone: do bone cells act as sensors of fluid flow?
Turner, C. H., Forwood, M. R., & Otter, M. W. (1994) · The FASEB Journal · doi:10.1096/fasebj.8.11.8070637 · Cited by 412
Lecanda, F., Warlow, P. M., Sheikh, S., Furlan, F., Steinberg, T. H., & Civitelli, R. (2000) · The Journal of Cell Biology · doi:10.1083/jcb.151.4.931 · Cited by 395
Research works printed but not linked: 1
- MM Saunders, 2001, Gap junctions and fluid flow response in MC3T3-E1 cells., Am J Physiol Cell Physiol, 281, C1917, 10.1152/ajpcell.2001.281.6.C1917 · DOI
Cited by
Sorted by citations
The Osteocyte: An Endocrine Cell … and More
Dallas, S. L., Prideaux, M., & Bonewald, L. F. (2013) · Endocrine Reviews · doi:10.1210/er.2012-1026 · Cited by 1,042
Mechanical regulation of bone remodeling
Wang, L., You, X., Zhang, L., Zhang, C., & Zou, W. (2022) · Bone Research · doi:10.1038/s41413-022-00190-4 · Cited by 641
Mechanical sensing protein PIEZO1 regulates bone homeostasis via osteoblast-osteoclast crosstalk
Wang, L., You, X., Lotinun, S., Zhang, L., Wu, N., & Zou, W. (2020) · Nature Communications · doi:10.1038/s41467-019-14146-6 · Cited by 535
Mechanosensation and transduction in osteocytes
Klein-Nulend, J., Bakker, A. D., Bacabac, R. G., Vatsa, A., & Weinbaum, S. (2013) · Bone · doi:10.1016/j.bone.2012.10.013 · Cited by 528
Osteocytes: master orchestrators of bone
Schaffler, M. B., Cheung, W.-Y., Majeska, R., & Kennedy, O. (2014) · Calcified Tissue International · doi:10.1007/s00223-013-9790-y · Cited by 514
Metadata
- Authors
- Zhang, Y., Paul, E. M., Sathyendra, V., Davison, A., Sharkey, N., Bronson, S., Srinivasan, S., Gross, T. S., & Donahue, H. J.
- Affiliations
- Pennsylvania State University (US)
- University of Washington (US)
- Corresponding author
- Donahue, Henry J.
- Venue
- PLoS ONE
- Publisher
- Public Library of Science (PLoS)
- Published
- 2011-08-29
- Volume
- 6
- Issue
- 8
- Pages
- e23516
- ISSN
- 1932-6203 (ISSN-L)
- PMC
- PMC3163577
- OpenAlex
- W2022309828
- Cited by
- 148
- References
- 63
- Citations by year
- 2026: 1 · 2025: 2 · 2024: 6 · 2023: 7 · 2022: 11 · 2021: 8 · 2020: 19 · 2019: 11 · 2018: 4 · 2017: 8 · 2016: 7 · 2015: 12 · 2014: 15 · 2013: 20 · 2012: 16
- FWCI
- 6.75
- Type
- journal article
- Language
- en
- Open access
- gold
- doi.org
- Locations
- PLoS ONE (publishedVersion, cc-by)
- Europe PMC (PubMed Central) (publishedVersion, cc-by)
- PubMed Central (publishedVersion, cc-by)
- PubMed (publishedVersion)
- DOAJ (DOAJ: Directory of Open Access Journals) (submittedVersion, cc-by-sa)
- Funders
- University of Pennsylvania
- Pennsylvania State University
- National Institutes of Health
- Penn State College of Medicine
- National Institute on Aging (R01AG013087)
- National Institute of Arthritis and Musculoskeletal and Skin Diseases (R03AR057546)
- Topics
- Life Sciences › Biochemistry, Genetics and Molecular Biology › Molecular Biology › Bone Metabolism and Diseases
- Life Sciences › Biochemistry, Genetics and Molecular Biology › Molecular Biology › Connexins and lens biology
- Health Sciences › Medicine › Orthopedics and Sports Medicine › Bone health and osteoporosis research
- Keywords
- connexin 43, gap junctional intercellular communication, osteoclastogenesis, bone resorption, osteocytes, osteoblasts, RANKL/OPG ratio, mechanical loading, bone loss
- MeSH terms
- Animals, Biomechanical Phenomena, Bone and Bones, Bone Resorption, Cell Communication, Cell Line, Humans, Male, Osteoclasts, Osteocytes, Osteogenesis, RNA, Messenger, Bone Density, Gene Deletion, Gap Junctions, Connexin 43, Mice, Osteoprotegerin, RANK Ligand, Mechanical Phenomena
About these checks
Registry, retraction, Cites and statistics results are computed, not judged, with one exception: a printed reference that no index lists is read once by a model before it counts as a citation error. Claims are extracted by a model and kept only when their quote appears verbatim in the text; each cited source is then checked, with a model’s help, for whether it says what the claim relies on. Those verdicts can be wrong — read the claim’s quote and the cited source before relying on one.
Statistics and arithmetic are recomputed, not judged.
Confidence bands are shown only for fields calibrated on our annotated test set. None is calibrated yet, so no band is shown.
What counts as a claim ›How we measure confidence ›How we check this ›
Are you an author, or do you see a problem with this page? Request a review
