

The DOI matches its Crossref record; 77 of the 79 references it cites were found in a registry or an index.
Global Patterns of Bacterial Beta-Diversity in Seafloor and Seawater Ecosystems
Open accessAbstract
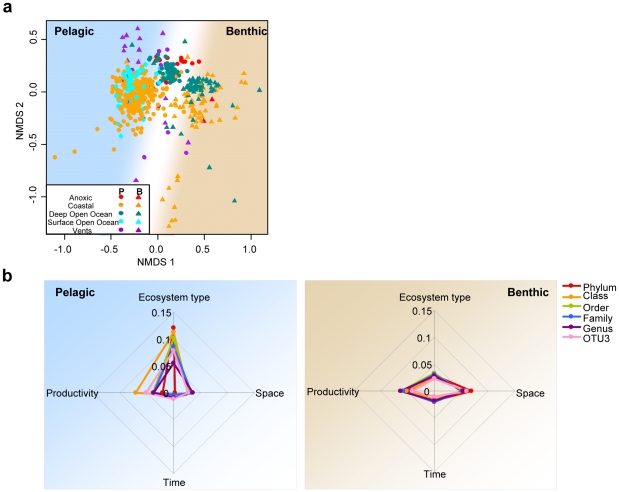
BACKGROUND: Marine microbial communities have been essential contributors to global biomass, nutrient cycling, and biodiversity since the early history of Earth, but so far their community distribution patterns remain unknown in most marine ecosystems. METHODOLOGY/PRINCIPAL FINDINGS: The synthesis of 9.6 million bacterial V6-rRNA amplicons for 509 samples that span the global ocean's surface to the deep-sea floor shows that pelagic and benthic communities greatly differ, at all taxonomic levels, and share <10% bacterial types defined at 3% sequence similarity level. Surface and deep water, coastal and open ocean, and anoxic and oxic ecosystems host distinct communities that reflect productivity, land influences and other environmental constraints such as oxygen availability. The high variability of bacterial community composition specific to vent and coastal ecosystems reflects the heterogeneity and dynamic nature of these habitats. Both pelagic and benthic bacterial community distributions correlate with surface water productivity, reflecting the coupling between both realms by particle export. Also, differences in physical mixing may play a fundamental role in the distribution patterns of marine bacteria, as benthic communities showed a higher dissimilarity with increasing distance than pelagic communities. CONCLUSIONS/SIGNIFICANCE: This first synthesis of global bacterial distribution across different ecosystems of the World's oceans shows remarkable horizontal and vertical large-scale patterns in bacterial communities. This opens interesting perspectives for the definition of biogeographical biomes for bacteria of ocean waters and the seabed.
Overview
The claims and statistics of this paper haven’t been checked yet.
Run the check — free, no account needed. It reads the open-access text and checks the sources it cites.
Integrity signals
Registry
Cites
Statistics
Figures
Verification
Claims the paper makes
The claims and statistics of this paper haven’t been checked yet.
Run the check — free, no account needed. It reads the open-access text and checks the sources it cites.
Claims other papers make about this one
Each is checked against this paper’s own text: does it say what the citing paper says it does?
In the citing paper
“which are respectively dominant classes in pelagic and benthic marine environments (Zinger et al., 2011).”
From Potential lineage transmission within the active microbiota of the eggs and the nauplii of the shrimp Litopenaeus stylirostris : possible influence of the rearing water and more (2021) · cites this paper as Zinger et al., 2011
In the citing paper
“3 classes previously identified in pelagic environments and marine ecosystems (Giovannoni & Stingl, 2005; Zinger et al., 2011).”
From Potential lineage transmission within the active microbiota of the eggs and the nauplii of the shrimp Litopenaeus stylirostris : possible influence of the rearing water and more (2021) · cites this paper as Zinger et al., 2011
Self-check
Percentages, sums and reported differences re-computed from the paper’s own numbers.
The self-check needs the paper’s full text.
Citations
Cites
R: A Language and Environment for Statistical Computing
R Core Team (2000) · doi:10.32614/r.manuals · Cited by 355,893
vegan: Community Ecology Package
Oksanen, J., Simpson, G. L., Blanchet, F. G., Kindt, R., Legendre, P., Minchin, P. R., O’Hara, R. B., Sólymos, P., Stevens, M. H. H., Szöcs, E., et al. (2001) · doi:10.32614/cran.package.vegan · Cited by 27,099
A global map of human impact on marine ecosystems
Halpern, B. S., Walbridge, S., Selkoe, K. A., Kappel, C. V., Micheli, F., D'Agrosa, C., Bruno, J. F., Casey, K. S., Ebert, C., Fox, H. E., et al. (2008) · Science · doi:10.1126/science.1149345 · Cited by 6,627
Measuring biological diversity
Magurran, A. E. (2004) · Choice Reviews Online · doi:10.5860/choice.42-1547 · Cited by 6,617
Prokaryotes: The unseen majority
Whitman, W. B., Coleman, D. C., & Wiebe, W. J. (1998) · Proceedings of the National Academy of Sciences · doi:10.1073/pnas.95.12.6578 · Cited by 4,871 · cited 2×
“diversity [1,2,3] and ecosystem functioning [4,5].”
BackgroundMeasuring Biological Diversity
Reid, J. R. W. (2005) · Austral Ecology · doi:10.1111/j.1442-9993.2005.01502.x · Cited by 4,471
Partialling out the spatial component of ecological variation
Borcard, D., Legendre, P., & Drapeau, P. (1992) · Ecology · doi:10.2307/1940179 · Cited by 4,449
Microbial diversity in the deep sea and the underexplored “rare biosphere”
Sogin, M. L., Morrison, H. G., Huber, J. A., Welch, D. B. M., Huse, S. M., Neal, P. R., Arrieta, J. M., & Herndl, G. J. (2006) · Proceedings of the National Academy of Sciences · doi:10.1073/pnas.0605127103 · Cited by 3,803
The Microbial Engines That Drive Earth's Biogeochemical Cycles
Falkowski, P. G., Fenchel, T., & Delong, E. F. (2008) · Science · doi:10.1126/science.1153213 · Cited by 3,379
Distance‐Based Tests for Homogeneity of Multivariate Dispersions
Anderson, M. J. (2006) · Biometrics · doi:10.1111/j.1541-0420.2005.00440.x · Cited by 3,304
Research works printed but not linked: 2
- C Turley, 2002, The importance of ‘marine snow’., Microbiol Today, 29, 177
- P Legendre, 1998, Numerical Ecology, 2nd English edition.
Cited by
Sorted by citations
Items 601–644 of 644
(2018) · Oxford University Press eBooks · doi:10.1093/oso/9780198767220.002.0004
Population dynamics, interactions and evolution of marine microbes using genomic approaches
Latorre, F. (2023) · UPCommons institutional repository (Universitat Politècnica de Catalunya) · doi:10.5821/dissertation-2117-396974
Marine Microbiomes: Towards Standard Methods and Best Practices
(2023) · Frontiers research topics · doi:10.3389/978-2-8325-4131-9 · Cited by 1
Zhang, Y., Qu, Z., Zhang, K., Li, J., & Lin, X. (2024) · Microorganisms · doi:10.3390/microorganisms12010124
Wang, X., Zhao, D., Yu, T., Zhu, Y., Jiang, M., Liu, Y., Hu, S., Luo, Y., Xiang, H., & Zheng, Y. (2024) · SSRN Electronic Journal · doi:10.2139/ssrn.4806493
Sediment bacterial diversity in the upwelling regions of Alappuzha, on the southwest coast of India.Preprint
Vijayan, J., Parvathi, A., Gireesh, K. T., & Pazhayamadom, D. G. (2024) · Research Square · doi:10.21203/rs.3.rs-4569934/v1
Qi, H., Lu, G., Zheng, K., Chang, J., Li, J., Ma, K., Zhao, Y., & Deng, A. (2025) · Geomicrobiology Journal · doi:10.1080/01490451.2025.2463549
Diversity and Distribution of Mangrove-Associated Bacteria
Harinathan, B., Selvam, P., Raja, E., & Sankaralingam, S. (2025) · Springer eBooks · doi:10.1007/978-981-96-2602-1_2
Maeke, M., Yin, X., Wunder, L. C., Vanni, C., Richter‐Heitmann, T., Miravet‐Verde, S., Ruscheweyh, H., Sunagawa, S., Fabian, J., Piontek, J., et al. (2025) · Microbiome · doi:10.1186/s40168-025-02140-8
Avila-Castro, E., Pérez, L. D., Rodríguez-Zaragoza, F. A., Hernández‐Zulueta, J., Zamora‐Tavares, P., Alcalá-Gómez, G., Ortiz, A. O., & Vargas‐Ponce, O. (2025) · Symbiosis · doi:10.1007/s13199-025-01066-x
Sediment bacterial diversity in the upwelling regions of Alappuzha, on the Southwest coast of IndiaPreprint
Vijayan, J., Parvathi, A., Gireesh, K. T., & Pazhayamadom, D. G. (2025) · SSRN Electronic Journal · doi:10.2139/ssrn.5422063
Rajamanickam, V., & Suresh, A. (2025) · Elsevier eBooks · doi:10.1016/b978-0-443-26771-0.00007-2
Rath, S., Panda, S. K., & Das, S. (2025) · Critical Reviews in Microbiology · doi:10.1080/1040841x.2025.2591753
Spatiotemporal variation of marine microbes in the Taiwan strait ecosystem
Li, J., Lü, Y., Chen, X., Wang, L., Lei, H., Cao, Z., Zhang, Z., Sun, B., & Wang, P. (2025) · Environmental Research · doi:10.1016/j.envres.2025.123479
Tubbs, T. R., Smith, R. M., Catasus, A. B., Adhikari, P. L., Douglass, J. G., & Urakawa, H. (2025) · Coasts · doi:10.3390/coasts5040047
Huber, P., Angelis, D. D., Sarmento, H., Metz, S., Giner, C. R., de Vargas, C., Maiorano, L., Massana, R., & Logares, R. (2024) · Figshare · doi:10.6084/m9.figshare.26942079
Robinson, C. V., Visona‐Kelly, B. C., Laqua, E. J., Sutton, G. J., Talty, C. M., & Judson, M. W. D. (2026) · Metabarcoding and Metagenomics · doi:10.3897/mbmg.10.174578
Spatial and temporal variation of marine microbial populations
Gautam, M. K., Dey, A., Mondal, S., Das, R., & Das, R. (2026) · Elsevier eBooks · doi:10.1016/b978-0-443-43836-3.00003-3
Peter, R., Meenatchi, R., Sivaprakasam, S., Uma, C., Sivagurunathan, P., Joseph, S., & Thinesh, T. (2026) · Frontiers in Marine Science · doi:10.3389/fmars.2026.1735848
Matthys, L., Moungues, E. M., Genève, A., Sanial, V., Misson, B., & Navarro, É. (2026) · PLoS ONE · doi:10.1371/journal.pone.0343743
Xiong, D., Sun, Y., Zhang, H., Lin, Q., Ma, Q., He, C., Zhang, C., & Zheng, H. (2026) · Marine Environmental Research · doi:10.1016/j.marenvres.2026.108025 · Cited by 1
Sediment bacterial diversity in the upwelling regions of Alappuzha, on the Southwest coast of IndiaPreprint
Parvathi, A., Jasna, V., Gireesh, K. T., & Pazhayamadom, D. G. (2026) · SSRN Electronic Journal · doi:10.2139/ssrn.6496438
Malik, S. A. A. (2020) · theses.fr (ABES) · doi:10.70675/c0e49a28z60c8z43bez9911z45ad6867ddea
Metabarcoding and metagenomic approaches to decipher microbial communities in suboxic environments
Reboul, G. (2020) · theses.fr (ABES) · doi:10.70675/f0308064z2fe8z44fczb92dzb797ed7fe3ed
Études des interactions hôte-microbiote chez l’algue brune Saccharina latissima
Burgunter‐Delamare, B. (2022) · theses.fr (ABES) · doi:10.70675/909e1b53z8cb8z4f76za09bzf56145e0ad1f
Giraud, C. (2023) · theses.fr (ABES) · doi:10.70675/a2e25d6fzc86fz4127za381z3f3f3e22f7f7
Yapan, B., Janßen, F., Boëtius, A., Haeckel, M., & Molari, M. (2026) · Frontiers in Marine Science · doi:10.3389/fmars.2026.1759595
A global synthesis of port water microbiome biogeography and anthropogenic associations
Lv, B., Zhang, Q., An, T., Mei, S., Kan, G., Wu, D., & Shi, J. (2026) · Biocontaminant · doi:10.48130/biocontam-0026-0005
Valenzuela‐Muñoz, V., Tapia, F. J., Gallardo‐Escárate, C., Mestre, M., Navarrete, S. A., Gutiérrez, M. H., Morales-Rivera, M. F., & Jessen, G. L. (2026) · Frontiers in Microbiology · doi:10.3389/fmicb.2026.1764313
Peng, Y., Wu, J., Zhang, X., Wang, X., Wang, B., Zhang, C., Wang, C. P., Zhang, H., Liu, F., Lian, K., et al. (2026) · Applied and Environmental Microbiology · doi:10.1128/aem.00448-26
Hu, J., Mukherjee, M., Rich, V. I., & Maier, R. M. (2026) · Elsevier eBooks · doi:10.1016/b978-0-443-29825-7.00024-6
Barnes, N. M., & Damare, S. R. (2026) · Journal of Earth System Science · doi:10.1007/s12040-026-02951-9
Caumartin, J., Benzerara, K., Gutiérrez‐Preciado, A., Iniesto, M., Bertolino, P., Ciobanu, M., Thomazo, C., Havas, R., Jézéquel, D., Deschamps, P., et al. (2026) · Geobiology · doi:10.1111/gbi.70064
Sun, F., Wang, Y., Wu, Z., Li, Q. P., & Wu, M. (2026) · Marine Environmental Research · doi:10.1016/j.marenvres.2026.108409
Consistent drivers of coastal biodiversity across the tree of life
Sigsgaard, E. E., Degn, K. B., Ávila, M. D. P., Agersnap, S., Jørgensen, M. Z. S., Jensen, M. R., Antich, A., Corcoran, D., Pedersen, P. B. M., Jespersen, A., et al. (2026) · Proceedings of the Royal Society B Biological Sciences · doi:10.1098/rspb.2025.3219
Bably, N. S., Hossain, A., Faruque, M. H., Zahid, M. A., Haque, M. I.-M., Watanabe, K., & Mandal, S. C. (2026) · Aquaculture Fish and Fisheries · doi:10.1002/aff2.70328
Kim, M., Cha, I.-T., & Park, S.-J. (2026) · Microbiology Spectrum · doi:10.1128/spectrum.02092-26
Kang, S. U., Choi, H. S., Park, N. Y., Yang, H. J., Jang, S. H., Lee, M. J., Yoo, Y. D., Lee, S. Y., & Lim, A. S. (2026) · Regional Studies in Marine Science · doi:10.1016/j.rsma.2026.105528
张石蕊, 郭婷婷, Wang, L., Zhu, M., Zhenlin, L., & Jiang, Z. (2026) · Aquaculture · doi:10.1016/j.aquaculture.2026.744614
Huang, L., Xu, L., Jiang, H., Chai, G., Li, Y., Gong, S., & Yu, K. (2026) · Research Square · doi:10.21203/rs.3.rs-11293285/v1
Metadata
- Authors
- Zinger, L., Amaral-Zettler, L. A., Fuhrman, J. A., Horner-Devine, M. C., Huse, S. M., Welch, D. B. M., Martiny, J. B. H., Sogin, M., Boetius, A., & Ramette, A.
- Affiliations
- Max Planck Institute for Marine Microbiology (DE)
- University of Southern California (US)
- Marine Biological Laboratory (US)
- University of California, Irvine (US)
- Alfred-Wegener-Institut Helmholtz-Zentrum für Polar- und Meeresforschung (DE)
- Corresponding author
- Zinger, Lucie
- Fuhrman, Jed A.
- Huse, Susan M.
- Welch, David B. Mark
- Martiny, Jennifer B. H.
- Sogin, Mitchell
- Ramette, Alban
- ORCID
- Venue
- PLoS ONE
- Publisher
- Public Library of Science (PLoS)
- Published
- 2011-09-08
- Volume
- 6
- Issue
- 9
- Pages
- e24570
- ISSN
- 1932-6203 (ISSN-L)
- PMC
- PMC3169623
- OpenAlex
- W2169157436
- Cited by
- 643
- References
- 79
- Citations by year
- 2026: 29 · 2025: 28 · 2024: 23 · 2023: 34 · 2022: 55 · 2021: 43 · 2020: 48 · 2019: 47 · 2018: 72 · 2017: 57 · 2016: 43 · 2015: 54 · 2014: 44 · 2013: 39 · 2012: 24
- FWCI
- 30.72
- Type
- journal article
- Language
- en
- Open access
- gold
- doi.org
- Locations
- PLoS ONE (publishedVersion, cc-by)
- PubMed Central (publishedVersion, cc-by)
- PubMed (publishedVersion)
- MPG.PuRe (Max Planck Society) (submittedVersion, other-oa)
- Bern Open Repository and Information System (University of Bern) (submittedVersion, cc-by)
- DOAJ (DOAJ: Directory of Open Access Journals) (submittedVersion, cc-by-sa)
- Helmholtz-Zentrum für Polar-und Meeresforschung (Alfred-Wegener-Institut) (submittedVersion)
- eScholarship (California Digital Library) (submittedVersion, cc-by)
- Max Planck Digital Library (submittedVersion)
- Figshare (submittedVersion, cc-by)
- Open Access CRIS of the University of Bern
- Funders
- Deutsche Forschungsgemeinschaft
- Max-Planck-Gesellschaft
- Leibniz-Gemeinschaft
- Topics
- Physical Sciences › Environmental Science › Ecology › Microbial Community Ecology and Physiology
- Physical Sciences › Earth and Planetary Sciences › Oceanography › Marine Biology and Ecology Research
- Physical Sciences › Environmental Science › Environmental Chemistry › Methane Hydrates and Related Phenomena
- Keywords
- marine bacteria, benthic-pelagic coupling, seafloor ecosystems, deep-sea floor, hydrothermal vents, coastal ecosystems, surface water productivity, particle export, ocean mixing, bacterial biogeography
- MeSH terms
- Bacteria, Classification, Oceans and Seas, Phylogeny, Seawater, Water Microbiology, Cluster Analysis, Databases, Factual, Ecosystem, Biomass, Computational Biology, Biodiversity
About these checks
Registry, retraction, Cites and statistics results are computed, not judged, with one exception: a printed reference that no index lists is read once by a model before it counts as a citation error. Claims are extracted by a model and kept only when their quote appears verbatim in the text; each cited source is then checked, with a model’s help, for whether it says what the claim relies on. Those verdicts can be wrong — read the claim’s quote and the cited source before relying on one.
Statistics and arithmetic are recomputed, not judged.
Confidence bands are shown only for fields calibrated on our annotated test set. None is calibrated yet, so no band is shown.
What counts as a claim ›How we measure confidence ›How we check this ›
Are you an author, or do you see a problem with this page? Request a review
