

The DOI matches its Crossref record; 56 of the 56 references it cites were found in a registry or an index.
RNA-Seq Analyses Generate Comprehensive Transcriptomic Landscape and Reveal Complex Transcript Patterns in Hepatocellular Carcinoma
Open accessAbstract
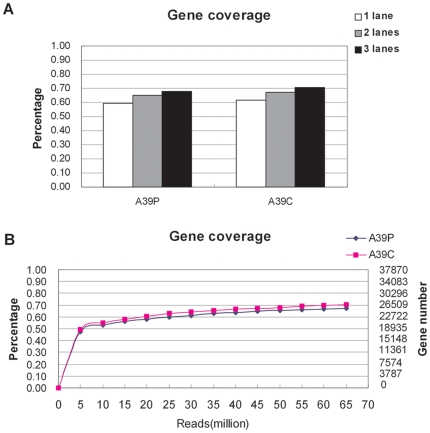
RNA-seq is a powerful tool for comprehensive characterization of whole transcriptome at both gene and exon levels and with a unique ability of identifying novel splicing variants. To date, RNA-seq analysis of HBV-related hepatocellular carcinoma (HCC) has not been reported. In this study, we performed transcriptome analyses for 10 matched pairs of cancer and non-cancerous tissues from HCC patients on Solexa/Illumina GAII platform. On average, about 21.6 million sequencing reads and 10.6 million aligned reads were obtained for samples sequenced on each lane, which was able to identify >50% of all the annotated genes for each sample. Furthermore, we identified 1,378 significantly differently expressed genes (DEGs) and 24, 338 differentially expressed exons (DEEs). Comprehensive function analyses indicated that cell growth-related, metabolism-related and immune-related pathways were most significantly enriched by DEGs, pointing to a complex mechanism for HCC carcinogenesis. Positional gene enrichment analysis showed that DEGs were most significantly enriched at chromosome 8q21.3-24.3. The most interesting findings were from the analysis at exon levels where we characterized three major patterns of expression changes between gene and exon levels, implying a much complex landscape of transcript-specific differential expressions in HCC. Finally, we identified a novel highly up-regulated exon-exon junction in ATAD2 gene in HCC tissues. Overall, to our best knowledge, our study represents the most comprehensive characterization of HBV-related HCC transcriptome including exon level expression changes and novel splicing variants, which illustrated the power of RNA-seq and provided important clues for understanding the molecular mechanisms of HCC pathogenesis at system-wide levels.
Overview
The claims and statistics of this paper haven’t been checked yet.
Free: it reads the open-access text and checks the first 5 claims that cite a source we can check. Create a free account to check every claim.
Integrity signals
Registry
Cites
Statistics
Figures


Verification
Claims the paper makes
The claims and statistics of this paper haven’t been checked yet.
Free: it reads the open-access text and checks the first 5 claims that cite a source we can check. Create a free account to check every claim.
Claims other papers make about this one
Each is checked against this paper’s own text: does it say what the citing paper says it does?
The source backs part of the claim, not all of it — or backs it for a different population, condition or comparison.
In the citing paper
“and also includes pathways frequently deregulated in other human cancers, such as pancreatic adenocarcinoma and bladder, small cell lung, prostate, and estrogen-dependent and hereditary breast cancers (Table S4–5)”
From Circadian Homeostasis of Liver Metabolism Suppresses Hepatocarcinogenesis (2016) · cites this paper as Huang et al., 2011
Experimental — accuracy not yet measured
Self-check
Percentages, sums and reported differences re-computed from the paper’s own numbers.
The self-check needs the paper’s full text.
Citations
Cites
Analysis of Relative Gene Expression Data Using Real-Time Quantitative PCR and the 2−ΔΔCT Method
Livak, K. J., & Schmittgen, T. D. (2001) · Methods · doi:10.1006/meth.2001.1262 · Cited by 180,860
Subramanian, A., Tamayo, P., Mootha, V. K., Mukherjee, S., Ebert, B. L., Gillette, M. A., Paulovich, A., Pomeroy, S. L., Golub, T. R., Lander, E. S., et al. (2005) · Proceedings of the National Academy of Sciences · doi:10.1073/pnas.0506580102 · Cited by 53,625
Robinson, M. D., McCarthy, D. J., & Smyth, G. K. (2010) · Bioinformatics · doi:10.1093/bioinformatics/btp616 · Cited by 41,364
Mapping and quantifying mammalian transcriptomes by RNA-Seq
Mortazavi, A., Williams, B. A., McCue, K., Schaeffer, L., & Wold, B. (2008) · Nature Methods · doi:10.1038/nmeth.1226 · Cited by 13,696
RNA-Seq: a revolutionary tool for transcriptomics
Wang, Z., Gerstein, M., & Snyder, M. (2009) · Nature Reviews Genetics · doi:10.1038/nrg2484 · Cited by 13,174
TopHat: discovering splice junctions with RNA-Seq
Trapnell, C., Pachter, L., & Salzberg, S. L. (2009) · Bioinformatics · doi:10.1093/bioinformatics/btp120 · Cited by 11,617
SOAP2: an improved ultrafast tool for short read alignment
Li, R., Yu, C., Li, Y., Lam, T.-W., Yiu, S.-M., Kristiansen, K., & Wang, J. (2009) · Bioinformatics · doi:10.1093/bioinformatics/btp336 · Cited by 3,760
RNA-seq: An assessment of technical reproducibility and comparison with gene expression arrays
Marioni, J. C., Mason, C. E., Mane, S. M., Stephens, M., & Gilad, Y. (2008) · Genome Research · doi:10.1101/gr.079558.108 · Cited by 2,771
The Transcriptional Landscape of the Yeast Genome Defined by RNA Sequencing
Nagalakshmi, U., Wang, Z., Waern, K., Shou, C., Raha, D., Gerstein, M., & Snyder, M. (2008) · Science · doi:10.1126/science.1158441 · Cited by 2,479
The impact of next-generation sequencing technology on genetics
Mardis, E. R. (2008) · Trends in Genetics · doi:10.1016/j.tig.2007.12.007 · Cited by 2,053
Cited by
Circadian Homeostasis of Liver Metabolism Suppresses Hepatocarcinogenesis
Kettner, N. M., Voicu, H., Finegold, M. J., Coarfa, C., Sreekumar, A., Putluri, N., Katchy, C. A., Lee, C., Moore, D. D., & Fu, L. (2016) · Cancer Cell · doi:10.1016/j.ccell.2016.10.007 · Cited by 508
“Importantly, the jet lag induced gene deregulation signature significantly overlaps with that found in human HCC (Figure 4B), and also includes pathways frequently deregulated in other human cancers, such as pancreatic adenocarcinoma and bladder, small cell lung, prostate, and estrogen-dependent and hereditary breast…”
BackgroundInfluentialFunction of lncRNAs and approaches to lncRNA-protein interactions
Zhu, J., Fu, H., Wu, Y., & Zheng, X. (2013) · Science China Life Sciences · doi:10.1007/s11427-013-4553-6 · Cited by 387
RNA-Seq and human complex diseases: recent accomplishments and future perspectives
Costa, V., Aprile, M., Esposito, R., & Ciccodicola, A. (2013) · European Journal of Human Genetics · doi:10.1038/ejhg.2012.129 · Cited by 269
Kalinich, M., Bhan, I., Kwan, T. T., Miyamoto, D. T., Javaid, S., LiCausi, J. A., Milner, J. D., Hong, X., Goyal, L., Sil, S., et al. (2017) · Proceedings of the National Academy of Sciences · doi:10.1073/pnas.1617032114 · Cited by 163
Li, S., Hu, Z., Zhao, Y., Huang, S., & He, X. (2018) · Hepatology · doi:10.1002/hep.30158 · Cited by 154
Metadata
- Authors
- Huang, Q., Lin, B., Liu, H., Ma, X., Mo, F., Yu, W., Li, L., Li, H., Tian, T., Wu, D., Shen, F., Xing, J., & Chen, Z.-N.
- Affiliations
- State Key Laboratory of Cancer Biology (CN)
- University of Washington (US)
- Zhejiang University (CN)
- Beijing Jiaotong University (CN)
- Second Military Medical University (CN)
- Corresponding author
- Xing, Jinliang
- Chen, Zhi-Nan
- ORCID
- Venue
- PLoS ONE
- Publisher
- Public Library of Science (PLoS)
- Published
- 2011-10-17
- Volume
- 6
- Issue
- 10
- Pages
- e26168
- ISSN
- 1932-6203 (ISSN-L)
- PMC
- PMC3197143
- OpenAlex
- W2088301231
- Cited by
- 104
- References
- 56
- Citations by year
- 2025: 2 · 2024: 3 · 2023: 3 · 2022: 4 · 2021: 5 · 2020: 6 · 2019: 10 · 2018: 6 · 2017: 14 · 2016: 6 · 2015: 10 · 2014: 8 · 2013: 16 · 2012: 9
- FWCI
- 4.55
- Type
- journal article
- Language
- en
- Open access
- gold
- doi.org
- Locations
- PLoS ONE (publishedVersion, cc-by)
- PubMed Central (publishedVersion, cc-by)
- PubMed (publishedVersion)
- DOAJ (DOAJ: Directory of Open Access Journals) (submittedVersion, cc-by-sa)
- Figshare (submittedVersion, cc-by)
- Funders
- National Natural Science Foundation of China (30872927)
- National Key Research and Development Program of China (2009CB521704)
- Topics
- Life Sciences › Biochemistry, Genetics and Molecular Biology › Molecular Biology › Genomics and Phylogenetic Studies
- Life Sciences › Biochemistry, Genetics and Molecular Biology › Cancer Research › Cancer-related molecular mechanisms research
- Life Sciences › Biochemistry, Genetics and Molecular Biology › Molecular Biology › RNA Research and Splicing
- Keywords
- hepatocellular carcinoma, HBV-related liver cancer, transcriptome, differentially expressed genes, splice variants, exon-exon junctions, ATAD2, carcinogenesis, gene expression profiling
- MeSH terms
- Exons, Carcinoma, Hepatocellular, Humans, Liver Neoplasms, RNA, Messenger, Gene Expression Regulation, Neoplastic, Sequence Analysis, RNA, Protein Isoforms, Transcriptome
About these checks
Registry, retraction, Cites and statistics results are computed, not judged, with one exception: a printed reference that no index lists is read once by a model before it counts as a citation error. Claims are extracted by a model and kept only when their quote appears verbatim in the text; each cited source is then checked, with a model’s help, for whether it says what the claim relies on. Those verdicts can be wrong — read the claim’s quote and the cited source before relying on one.
Statistics and arithmetic are recomputed, not judged.
Confidence bands are shown only for fields calibrated on our annotated test set. None is calibrated yet, so no band is shown.
What counts as a claim ›How we measure confidence ›How we check this ›
Are you an author, or do you see a problem with this page? Request a review
How to cite
Cite CoChat for the checks on this page, and the paper for its own findings.
- This page
- CoChat. (2026). Citation check: RNA-Seq Analyses Generate Comprehensive Transcriptomic Landscape and Reveal Complex Transcript Patterns in Hepatocellular Carcinoma. https://app.cochat.ai/papers/10.1371/journal.pone.0026168
- The paper
- Huang, Q., Lin, B., Liu, H., Ma, X., Mo, F., Yu, W., Li, L., Li, H., Tian, T., Wu, D., Shen, F., Xing, J., & Chen, Z.-N. (2011). RNA-Seq Analyses Generate Comprehensive Transcriptomic Landscape and Reveal Complex Transcript Patterns in Hepatocellular Carcinoma. PLoS ONE. https://doi.org/10.1371/journal.pone.0026168
Data sources
Bibliographic data: Semantic Scholar, OpenAlex, Crossref.
Contains information from the Semantic Scholar Academic Graph Datasets, made available under the ODC Attribution License (ODC-BY 1.0).
Semantic Scholar’s data is described in: Kinney, R., et al. (2023). The Semantic Scholar Open Data Platform. arXiv:2301.10140.
