

The DOI matches its Crossref record; 46 of the 46 references it cites were found in a registry or an index.
Comparing Statistical Methods for Constructing Large Scale Gene Networks
Open accessAbstract
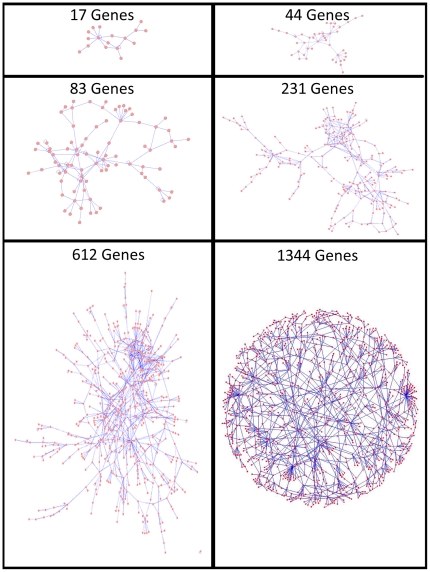
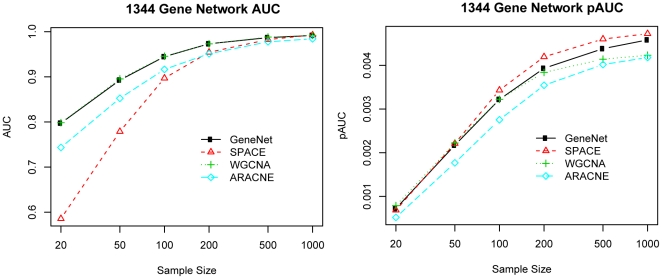
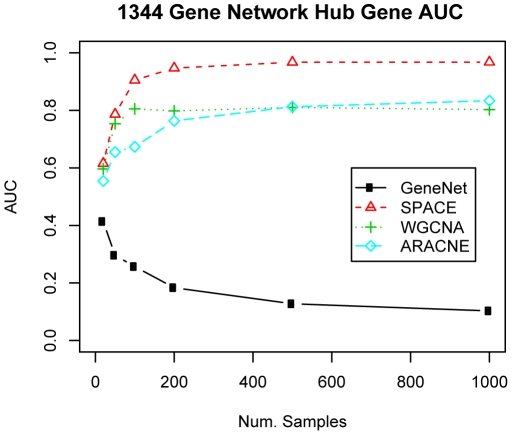
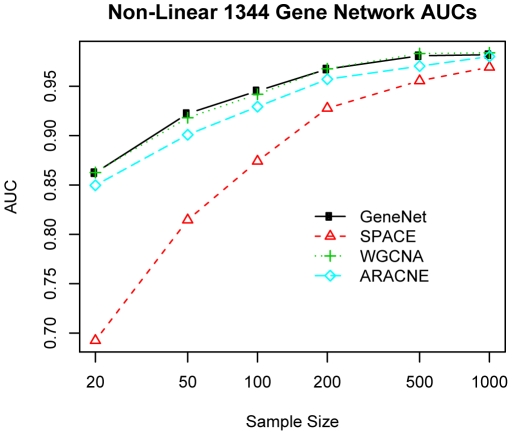
The gene regulatory network (GRN) reveals the regulatory relationships among genes and can provide a systematic understanding of molecular mechanisms underlying biological processes. The importance of computer simulations in understanding cellular processes is now widely accepted; a variety of algorithms have been developed to study these biological networks. The goal of this study is to provide a comprehensive evaluation and a practical guide to aid in choosing statistical methods for constructing large scale GRNs. Using both simulation studies and a real application in E. coli data, we compare different methods in terms of sensitivity and specificity in identifying the true connections and the hub genes, the ease of use, and computational speed. Our results show that these algorithms performed reasonably well, and each method has its own advantages: (1) GeneNet, WGCNA (Weighted Correlation Network Analysis), and ARACNE (Algorithm for the Reconstruction of Accurate Cellular Networks) performed well in constructing the global network structure; (2) GeneNet and SPACE (Sparse PArtial Correlation Estimation) performed well in identifying a few connections with high specificity.
Overview
The claims and statistics of this paper haven’t been checked yet.
Run the check — free, no account needed. It reads the open-access text and checks the sources it cites.
Integrity signals
Registry
Cites
Statistics
Figures
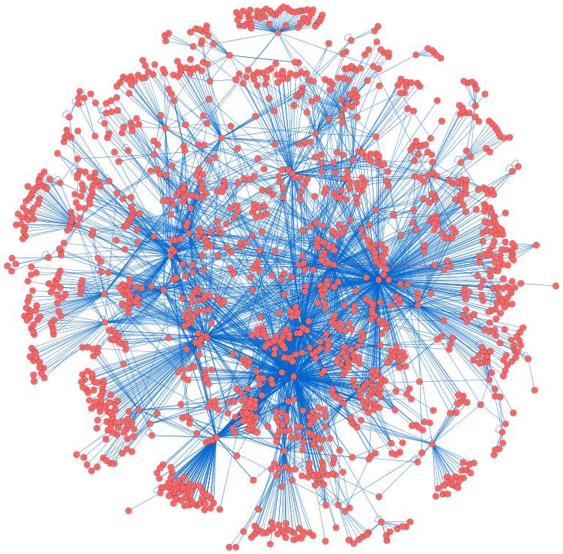
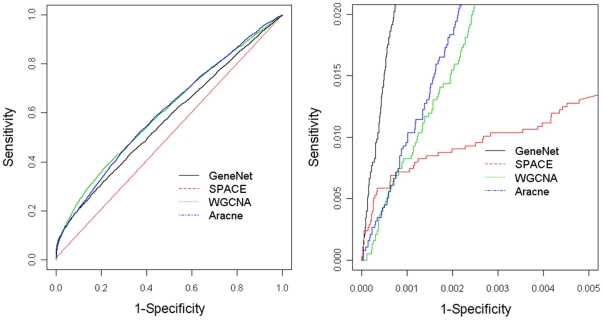
Verification
Claims the paper makes
The claims and statistics of this paper haven’t been checked yet.
Run the check — free, no account needed. It reads the open-access text and checks the sources it cites.
Claims other papers make about this one
Each is checked against this paper’s own text: does it say what the citing paper says it does?
The source backs part of the claim, not all of it — or backs it for a different population, condition or comparison.
In the citing paper
“At currently available sample sizes, networks are most reproducible at a module level35,38,39, then at the hub gene level41,223 and, last, at the level of precise gene connectivity rankings or precise module memberships of genes40,49.”
From Systems biology and gene networks in neurodevelopmental and neurodegenerative disorders (2015) · cites this paper as [39]
Experimental — accuracy not yet measuredThe source backs part of the claim, not all of it — or backs it for a different population, condition or comparison.
In the citing paper
“weighted networks constructed with the topological overlap of correlation (for example, by weighted gene co-expression network analysis (WGCNA)42,44) have similar sensitivity and specificity for detecting true network structure for experiments involving monotonic relationships as do networks constructed with nonlinear association measures such as mutual information (for example, by the Algorithm”
From Systems biology and gene networks in neurodevelopmental and neurodegenerative disorders (2015) · cites this paper as [39]
Experimental — accuracy not yet measuredThe cited source says what the claim attributes to it.
In the citing paper
“A comparison between these tools and others, including WGCNA, showed that WGCNA and ARACNE perform best at defining the network structure of Escherichia coli [130], for which a well-defined regulatory network was used as a gold standard [131].”
From Gene co-expression analysis for functional classification and gene–disease predictions (2017) · cites this paper as [130]
The check wasn’t confident either way, so it gives no verdict — never disputed.
In the citing paper
“Each of the methods detects specific module changes by design, but they can also detect modular changes that they were not specifically designed for and may outperform other tools in the identification of these changes [130].”
From Gene co-expression analysis for functional classification and gene–disease predictions (2017) · cites this paper as [130]
Experimental — accuracy not yet measuredThe check wasn’t confident either way, so it gives no verdict — never disputed.
In the citing paper
“Network analyses of AD brain tissue demonstrate the most reproducibility at the module level, followed by the hub protein level, and then finally at the level of precise protein connectivity rankings and module protein membership [61, 89–94].”
From Systems-based proteomics to resolve the biology of Alzheimer’s disease beyond amyloid and tau (2021) · cites this paper as [91]
Experimental — accuracy not yet measured
Self-check
Percentages, sums and reported differences re-computed from the paper’s own numbers.
The self-check needs the paper’s full text.
Citations
Cites
Cytoscape: A software Environment for integrated models of biomolecular interaction networks
Shannon, P., Markiel, A., Ozier, O., Baliga, N. S., Wang, J. T., Ramage, D., Amin, N., Schwikowski, B., & Ideker, T. (2003) · Genome Research · doi:10.1101/gr.1239303 · Cited by 51,888
WGCNA: an R package for weighted correlation network analysis
Langfelder, P., & Horvath, S. (2008) · BMC Bioinformatics · doi:10.1186/1471-2105-9-559 · Cited by 27,252
DAVID: Database for Annotation, Visualization, and Integrated Discovery
Dennis, G., Sherman, B. T., Hosack, D. A., Yang, J., Gao, W., Lane, H. C., & Lempicki, R. A. (2003) · Genome Biology · doi:10.1186/gb-2003-4-5-p3 · Cited by 9,327
A General Framework for Weighted Gene Co-Expression Network Analysis
Zhang, B., & Horvath, S. (2005) · Statistical Applications in Genetics and Molecular Biology · doi:10.2202/1544-6115.1128 · Cited by 5,684
A generalized inverse for matrices
Penrose, R. (1955) · Mathematical Proceedings of the Cambridge Philosophical Society · doi:10.1017/s0305004100030401 · Cited by 4,611
A Bayesian Method for the Induction of Probabilistic Networks from Data
Cooper, G. F., & Herskovits, E. H. (1992) · Machine Learning · doi:10.1023/a:1022649401552 · Cited by 4,241
Margolin, A. A., Nemenman, I., Basso, K., Wiggins, C., Stolovitzky, G., Favera, R. D., & Califano, A. (2006) · BMC Bioinformatics · doi:10.1186/1471-2105-7-s1-s7 · Cited by 2,420
A Gene-Coexpression Network for Global Discovery of Conserved Genetic Modules
Stuart, J. M., Segal, E., Koller, D., & Kim, S. K. (2003) · Science · doi:10.1126/science.1087447 · Cited by 2,276
Margolin, A. A., Nemenman, I. M., Basso, K., Wiggins, C. H., Stolovitzky, G. A., Favera, R. D., & Califano, A. (2006) · BMC Bioinformatics · doi:10.7916/d8g15zbp · Cited by 2,260
Causal Protein-Signaling Networks Derived from Multiparameter Single-Cell Data
Sachs, K., Perez, O. D., Pe’er, D., Lauffenburger, D. A., & Nolan, G. P. (2005) · Science · doi:10.1126/science.1105809 · Cited by 1,785
Cited by
Sorted by citations
Items 101–185 of 185
A system level analysis of gastric cancer across tumor stages with RNA-seq data
Wu, J., Zhao, X., Lin, Z., & Shao, Z. (2015) · Molecular BioSystems · doi:10.1039/c5mb00105f · Cited by 13
Conserved Transcription Factors Steer Growth-Related Genomic Programs in Daphnia
Spanier, K. I., Jansen, M. W. J. C., Decaestecker, E., Hulselmans, G. J., Becker, D., Colbourne, J. K., Orsini, L., Meester, L. D., & Aerts, S. (2017) · Genome Biology and Evolution · doi:10.1093/gbe/evx127 · Cited by 15
A Null Model for Pearson Coexpression Networks
Gobbi, A., & Jurman, G. (2015) · PLoS ONE · doi:10.1371/journal.pone.0128115 · Cited by 13
Challenges and opportunities in the network medicine of complex diseases
d’Andrea, V., Loscalzo, J., & Domenico, M. D. (2025) · Med · doi:10.1016/j.medj.2025.100920 · Cited by 19
Moslehi, R., Ambroggio, X. I., Nagarajan, V., Kumar, A., & Dzutsev, A. (2014) · BMC Genomics · doi:10.1186/1471-2164-15-373 · Cited by 12
Li, J., Wei, H., Liu, T., & Zhao, P. X. (2013) · Nucleic Acids Research · doi:10.1093/nar/gkt983 · Cited by 11
Regulatory networks in retinal ischemia-reperfusion injury
Andreeva, K., Soliman, M., & Cooper, N. G. F. (2015) · BMC Genetics · doi:10.1186/s12863-015-0201-4 · Cited by 11
Chickpea Proteome Analysis Reveals Genotype-Dependent Variations Associated with Seed Traits
Bose, U., Buck, S., Sirault, X. R. R., Bahmani, M., Byrne, K. A., Stockwell, S., McWilliam, S. M., Colgrave, M. L., Juhász, A., & Ral, J.-P. F. (2024) · Journal of Agricultural and Food Chemistry · doi:10.1021/acs.jafc.4c07669 · Cited by 11
Xu, C., Xia, P., Li, J., Lewis, K. B., Ciombor, K. K., Wang, L., Smith, J. J., Beauchamp, R. D., & Chen, X. (2024) · Cell Reports Medicine · doi:10.1016/j.xcrm.2024.101661 · Cited by 11
Uddin, R., & Singh, S. M. (2017) · Frontiers in Systems Neuroscience · doi:10.3389/fnsys.2017.00075 · Cited by 9
Wang, H., Lu, D., Liu, X., Jiang, J., Feng, S., Dong, X., Shi, X., Wu, H., Xiong, G., Wang, H., et al. (2019) · Oncology Letters · doi:10.3892/ol.2019.10795 · Cited by 9
Dehghanian, F., Hojati, Z., Hosseinkhan, N., Mousavian, Z., & Masoudi‐Nejad, A. (2018) · Computers in Biology and Medicine · doi:10.1016/j.compbiomed.2018.05.023 · Cited by 9
Lin, A., Forsyth, J. K., Hoftman, G. D., Kushan, L., Jalbrzikowski, M., Dokuru, D. R., Coppola, G., Fiksinski, A., Zinkstok, J., Vorstman, J. A. S., et al. (2021) · Brain Behavior & Immunity - Health · doi:10.1016/j.bbih.2021.100386 · Cited by 10
Developing the ‘omic toolkit of comparative physiologists
Ripley, D. M., Garner, T., & Stevens, A. (2024) · Comparative Biochemistry and Physiology Part D Genomics and Proteomics · doi:10.1016/j.cbd.2024.101287 · Cited by 8
Information-Theoretic Approaches to Understanding Stem Cell Variability
Smith, R. C. G., & MacArthur, B. D. (2017) · Current Stem Cell Reports · doi:10.1007/s40778-017-0093-5 · Cited by 9
Leal, L. G., López, C. E., & López-Kleine, L. (2013) · Advances in intelligent systems and computing · doi:10.1007/978-3-319-01568-2_3 · Cited by 8
YUE, H., Yang, B. K., YANG, F., Hu, X.-L., & bin Kong, F. (2016) · Experimental and Therapeutic Medicine · doi:10.3892/etm.2016.3131 · Cited by 8
The impact of sample size and tissue type on the reproducibility of gene co-expression networks
Ovens, K. L., Eames, B. F., & McQuillan, I. (2020) · ACM International Conference on Bioinformatics, Computational Biology, and Health Informatics (ACM-BCB) · doi:10.1145/3388440.3412481 · Cited by 7
Guo, Z., Fu, Y., Huang, C., Zheng, C., Wu, Z., Chen, X., Gao, S., Ma, Y., Shahen, M., Li, Y., et al. (2021) · Genomics Proteomics & Bioinformatics · doi:10.1016/j.gpb.2020.06.023 · Cited by 7
Figueiredo, R. Q., Raschka, T., Kodamullil, A. T., Hofmann‐Apitius, M., Mubeen, S., & Domingo‐Fernándéz, D. (2021) · Nucleic Acids Research · doi:10.1093/nar/gkab556 · Cited by 7
Ha, M. J., Baladandayuthapani, V., & Do, K.-A. (2015) · Cancer Informatics · doi:10.4137/cin.s14873 · Cited by 6
Asnicar, F., Masera, L., Coller, E., Gallo, C., Sella, N., Tolio, T., Morettin, P., Erculiani, L., Galante, F., Semeniuta, S., et al. (2016) · The International Journal of High Performance Computing Applications · doi:10.1177/1094342016662508 · Cited by 7
Anti-Synchronizing Backstepping Control Design for Arneodo Chaotic System
Vaidyanathan, S. V. (2013) · International Journal on Bioinformatics & Biosciences · doi:10.5121/ijbb.2013.3103 · Cited by 8
The Doublesex sex determination pathway regulates reproductive division of labor in honey beesPreprint
Velasque, M., Qiu, L., & Mikheyev, A. S. (2018) · bioRxiv (Cold Spring Harbor Laboratory) · doi:10.1101/314492 · Cited by 7
Know Me! Unraveling the Riddle of Calcific Aortic Valve Disease by Bioinformatics
Pasipoularides, A. D. (2017) · The Tohoku Journal of Experimental Medicine · doi:10.1620/tjem.243.255 · Cited by 6
Inferring gene correlation networks from transcription factor binding sites
Mahdevar, G., Nowzari-Dalini, A., & Sadeghi, M. (2013) · Genes & Genetic Systems · doi:10.1266/ggs.88.301 · Cited by 6
Wei, B., Yu, M., Yao, J., Jiang, M., An, J., Yang, J., Lin, J., Zhao, Y., & Zhu, Y. (2021) · Frontiers in Immunology · doi:10.3389/fimmu.2021.657951 · Cited by 6
Module-Based Association Analysis for Omics Data with Network Structure
Wang, Z., Maity, A., Hsiao, C. K., Voora, D., Kaddurah-Daouk, R. F., & Tzeng, J. (2015) · PLoS ONE · doi:10.1371/journal.pone.0122309 · Cited by 6
Roberts, W. R., & Roalson, E. H. (2020) · PeerJ · doi:10.7717/peerj.8778 · Cited by 7
Estimation of gene co-expression from RNA-Seq count data
Specht, A. T., & Li, J. (2015) · Statistics and Its Interface · doi:10.4310/sii.2015.v8.n4.a9 · Cited by 6
Canovi, C., Stojkovič, K., Ayllón-Benítez, A., Delhomme, N., Egertsdotter, U., & Street, N. R. (2024) · Physiologia Plantarum · doi:10.1111/ppl.14537 · Cited by 5
Sethi, A., Sharaff, M. M., & Sahu, R. (2021) · Plant Gene · doi:10.1016/j.plgene.2021.100307 · Cited by 5
Large-scale correlation mining for biomolecular network discovery
Hero, A. O., & Rajaratnam, B. (2015) · Cambridge University Press eBooks · doi:10.1017/cbo9781316162750.016 · Cited by 5
CCor: A Whole Genome Network-Based Similarity Measure Between Two Genes
Hu, Y., & Zhao, H. (2016) · Biometrics · doi:10.1111/biom.12508 · Cited by 5
Reconstruction and inference of the Lactococcus lactis MG1363 gene co-expression network
Omony, J., de Jong, A., Kok, J., & van Hijum, S. A. F. T. (2019) · PLoS ONE · doi:10.1371/journal.pone.0214868 · Cited by 5
A two-stage approach of gene network analysis for high-dimensional heterogeneous data
Lee, S., Liang, F., Cai, L., & Xiao, G. (2017) · Biostatistics · doi:10.1093/biostatistics/kxx033 · Cited by 5
Self-citationDiscovering Candidates for Gene Network Expansion by Distributed Volunteer Computing
Asnicar, F., Erculiani, L., Galante, F., Gallo, C., Masera, L., Morettin, P., Sella, N., Semeniuta, S., Tolio, T., Malacarne, G., et al. (2015) · IEEE International Conference on Trust, Security and Privacy in Computing and Communications (TrustCom) · doi:10.1109/trustcom.2015.640 · Cited by 5
Constructing temporal regulatory cascades in the context of development and cell differentiation
Daou, R., Beißbarth, T., Wingender, E., Gültaş, M., & Haubrock, M. (2020) · PLoS ONE · doi:10.1371/journal.pone.0231326 · Cited by 3
How Different Are Estimated Genetic Networks of Cancer Subtypes?
Shojaie, A., & Sedaghat, N. (2017) · Contributions to statistics · doi:10.1007/978-3-319-41573-4_9 · Cited by 4
The gene regulatory network of mESC differentiation: a benchmark for reverse engineering methods
Meisig, J., & Blüthgen, N. (2018) · Philosophical Transactions of the Royal Society B Biological Sciences · doi:10.1098/rstb.2017.0222 · Cited by 4
Guan, J., Wang, Y., Wang, Y., Zhuang, Y., & Ji, G. (2022) · BMC Genomics · doi:10.1186/s12864-022-09020-7 · Cited by 4
Mbebi, A. J., & Nikoloski, Z. (2023) · PLoS Computational Biology · doi:10.1371/journal.pcbi.1010832 · Cited by 3
Inferring gene regulatory networks with a scale-free property based informative prior
Yang, B., Xu, J., Liu, B., & Wu, Z. Z. (2015) · International Conference on Biomedical Engineering and Informatics (BMEI) · doi:10.1109/bmei.2015.7401564 · Cited by 3
Biostatistics, Data Mining and Computational Modeling
He, H., Lin, D., Zhang, J., Wang, Y.-P., & Deng, H. (2016) · Translational bioinformatics · doi:10.1007/978-94-017-7543-4_2 · Cited by 3
Databases and tools for constructing signal transduction networks in cancer
Nam, S. (2017) · BMB Reports · doi:10.5483/bmbrep.2017.50.1.135 · Cited by 3
Handling Big Data in Precision Medicine
Lemus, E. H., Enríquez, J. E., & García-Herrera, R. (2017) · Elsevier eBooks · doi:10.1016/b978-0-12-809411-2.00014-3 · Cited by 3
Reverse Engineering Gene Networks
Chockalingam, S. P., Aluru, M. R., Guo, H., Yin, Y., & Aluru, S. (2017) · ACM International Conference on Bioinformatics, Computational Biology, and Health Informatics (ACM-BCB) · doi:10.1145/3107411.3107428 · Cited by 3
DTW-MIC Coexpression Networks from Time-Course DataPreprint
Riccadonna, S., Jurman, G., Visintainer, R., Filosi, M., & Furlanello, C. (2012) · arXiv (Cornell University) · doi:10.48550/arxiv.1210.3149 · Cited by 3
Barman, B., Biswas, P., & Mukhopadhyay, A. (2016) · International Journal of Bio-Inspired Computation · doi:10.1504/ijbic.2016.078640 · Cited by 2
Clustering analysis SAGE libraries using maximal information coefficient
Tang, D. (2015) · International Conference of Soft Computing and Pattern Recognition (SoCPaR) · doi:10.1109/socpar.2015.7492785 · Cited by 1
Gene Networks in Neuropsychiatric Disease
Parikshak, N., & Geschwind, D. H. (2016) · Elsevier eBooks · doi:10.1016/b978-0-12-800105-9.00011-1 · Cited by 1
Geração de redes de co-expressão de genes utilizando informações de expressão diferencial
Corrêa, B. A., Okada, G. L., Maldonado, L. M. M., Wolf, I. R., Valente, G. T., & Simões, R. P. (2019) · C Q D - Revista Eletrônica Paulista de Matemática · doi:10.21167/cqdvol14ermac201923169664bacglolmmmirwgtvrps122131 · Cited by 1
Pflieger, L. T., Pulst, S. M., & Facelli, J. C. (2020) · IEEE International Conference on Healthcare Informatics (ICHI) · doi:10.1109/ichi48887.2020.9374300 · Cited by 1
Inference of Gene Coexpression Networks from Bulk-Based RNA-Sequencing Data
Lamere, A. T. (2021) · Methods in molecular biology · doi:10.1007/978-1-0716-1534-8_2 · Cited by 1
Xu, L., Xiao, T., Zou, B., Rong, Z., & Yao, W. (2024) · Frontiers in Pediatrics · doi:10.3389/fped.2024.1339925 · Cited by 1
Integrative Analysis of Gene Networks and Their Application to Lung Adenocarcinoma Studies
Lee, S., Liang, F., Cai, L., & Xiao, G. (2017) · Cancer Informatics · doi:10.1177/1176935117690778 · Cited by 1
Self-citationStability Indicators in Network ReconstructionPreprint
Jurman, G., Filosi, M., Visintainer, R., Riccadonna, S., & Furlanello, C. (2012) · arXiv (Cornell University) · doi:10.48550/arxiv.1209.1654 · Cited by 1
Network-based analysis of protein mass spectrometry expression data
Gurinovich, A., Banzhaf, W., & Peña‐Castillo, L. (2013) · F1000Research · doi:10.7490/f1000research.1094103.1
Integrative network modeling of large multidimensional cancer datasets
Kling, T. (2015) · Gothenburg University Publications Electronic Archive (Gothenburg University)
Genome-Scale Technology Driven Advances to Research into Normal and Malignant Haematopoiesis
Göttgens, B. (2012) · Scientifica · doi:10.6064/2012/437956
Coexpression Networks Predict Ataxia Genes
Pulst, S. M., & Pflieger, L. T. (2014) · JAMA Neurology · doi:10.1001/jamaneurol.2014.757
Problems in Network Modeling: Estimating Edges and Community Detection
Wang, Y. X. (2015) · eScholarship (California Digital Library)
Network-based Approach Enabling Drug Repositioning for the Treatment of Myocardial Infarction
Androsova, G. (2014) · Open Repository and Bibliography (University of Luxembourg)
Gene and protein networks in understanding cellular function
Lehtinen, S. (2015) · UCL Discovery (University College London)
Sequence based analysis of neurodevelopmental disorders
Halvardson, J. (2016) · Uppsala University Publications (Uppsala University)
PROBING THE ARCHITECTURE OF COMPLEX TRAITS: FUNCTIONAL GENOMICS METHODS AND APPLICATIONS
Weiser, M. (2015) · Carolina Digital Repository (University of North Carolina at Chapel Hill) · doi:10.17615/e5za-ph20
Dynamic gene regulatory network-based inference framework for identifying cancer biomarkers
Yang, B., & Wu, Z. Z. (2016) · International Congress on Image and Signal Processing (CISP) · doi:10.1109/cisp-bmei.2016.7853009
Sánchez, J. (2013) · Chalmers Publication Library (Chalmers University of Technology)
Inferring propensity amongst lung and breast carcinomas via overlapped gene expression profilesPreprint
Jaiswal, R., Dhakal, S., & Jauhari, S. (2017) · bioRxiv (Cold Spring Harbor Laboratory) · doi:10.1101/178558
Izadi, F. (2018) · Research in Cardiovascular Medicine · doi:10.4103/rcm.rcm_14_17
Ko, K. D., Dell’Orso, S., Juan, A. H., & Sartorelli, V. (2019) · bioRxiv (Cold Spring Harbor Laboratory) · doi:10.1101/612952
Roberts, W. R., & Roalson, E. H. (2019) · bioRxiv (Cold Spring Harbor Laboratory) · doi:10.1101/817221
An assessment of gene regulatory network inference algorithms
Pedraza, Z., & Guillermo, A. (2020)
Lu, D., Wang, H., Wu, X., Zhai, J., Liu, X., Dong, X., Feng, S., Shi, X., Jiang, J., Wang, Z., et al. (2021) · Complexity · doi:10.1155/2021/9997783
Dunn, S.-J. (2019) · Faculty Opinions – Post-Publication Peer Review of the Biomedical Literature · doi:10.3410/f.722129179.793567423
Zardoya, R., Mauro, D. S., & Irisarri, I. (2021) · Faculty Opinions – Post-Publication Peer Review of the Biomedical Literature · doi:10.3410/f.739835180.793584962
Integracija strukturnih omejitev pri izpeljavi gensko regulatornih omrežij
Pušnik, Ž., & Moškon, M. (2021) · Uporabna informatika · doi:10.31449/upinf.vol29.num1.110 · Cited by 1
From local to global gene co-expression estimation using single-cell RNA-seq data
Tian, J., Lei, J., & Roeder, K. (2024) · Biometrics · doi:10.1093/biomtc/ujae001
Principles, methods and applications of gene regulatory network inference
Jiang, Y., Liu, Z., Zhang, Q., Chen, Z., Zan, Z., Lü, Q., Wang, J., Zhu, J., Zhang, J., & Wei, X. (2025) · Scientia Sinica Vitae · doi:10.1360/ssv-2025-0070
Bootstrap-based criteria for identifying differences between learned Bayesian networksPreprint
Berners-Lee, R., & Smith, V. A. (2025) · bioRxiv (Cold Spring Harbor Laboratory) · doi:10.1101/2025.11.04.686685
Shi, J., Xue, Y., & Zhang, X. (2025) · Mathematical Methods in the Applied Sciences · doi:10.1002/mma.70375
Biswas, P., Barman, B., & Mukhopadhyay, A. (2015) · Advances in intelligent systems and computing · doi:10.1007/978-81-322-2250-7_76
Metadata
- Authors
- Allen, J. D., Xie, Y., Chen, M., Girard, L., & Xiao, G.
- Affiliations
- The University of Texas Southwestern Medical Center (US)
- Harold C. Simmons Comprehensive Cancer Center (US)
- Corresponding author
- Xiao, Guanghua
- Venue
- PLoS ONE
- Publisher
- Public Library of Science (PLoS)
- Published
- 2012-01-17
- Volume
- 7
- Issue
- 1
- Pages
- e29348
- ISSN
- 1932-6203 (ISSN-L)
- PMC
- PMC3260142
- OpenAlex
- W2061971803
- Cited by
- 186
- References
- 46
- Citations by year
- 2025: 4 · 2024: 6 · 2023: 1 · 2022: 4 · 2021: 13 · 2020: 11 · 2019: 17 · 2018: 15 · 2017: 22 · 2016: 20 · 2015: 25 · 2014: 15 · 2013: 24 · 2012: 9
- FWCI
- 9.38
- Type
- journal article
- Language
- en
- Open access
- gold
- doi.org
- Locations
- PLoS ONE (publishedVersion, cc-by)
- Europe PMC (PubMed Central) (publishedVersion, cc-by)
- PubMed Central (publishedVersion, cc-by)
- PubMed (publishedVersion)
- RePEc: Research Papers in Economics (submittedVersion)
- DOAJ (DOAJ: Directory of Open Access Journals) (submittedVersion)
- Figshare (submittedVersion, cc-by)
- Funders
- National Science Foundation (0907562)
- National Institutes of Health (RR024982)
- National Institute on Drug Abuse (R33DA027592, R21DA027592)
- National Cancer Institute ((P50-CA70907, R01CA152301, P50CA070907)
- National Center for Research Resources (UL1RR024982)
- Topics
- Life Sciences › Biochemistry, Genetics and Molecular Biology › Molecular Biology › Gene Regulatory Network Analysis
- Life Sciences › Biochemistry, Genetics and Molecular Biology › Molecular Biology › Bioinformatics and Genomic Networks
- Life Sciences › Biochemistry, Genetics and Molecular Biology › Molecular Biology › Microbial Metabolic Engineering and Bioproduction
- Keywords
- gene regulatory networks, network inference, weighted gene co-expression network analysis, ARACNE, hub genes, sensitivity and specificity, Escherichia coli, method comparison
- MeSH terms
- Algorithms, Escherichia coli, Reproducibility of Results, Computational Biology, Protein Interaction Mapping, Escherichia coli Proteins, Gene Regulatory Networks, Protein Interaction Maps
About these checks
Registry, retraction, Cites and statistics results are computed, not judged, with one exception: a printed reference that no index lists is read once by a model before it counts as a citation error. Claims are extracted by a model and kept only when their quote appears verbatim in the text; each cited source is then checked, with a model’s help, for whether it says what the claim relies on. Those verdicts can be wrong — read the claim’s quote and the cited source before relying on one.
Statistics and arithmetic are recomputed, not judged.
Confidence bands are shown only for fields calibrated on our annotated test set. None is calibrated yet, so no band is shown.
What counts as a claim ›How we measure confidence ›How we check this ›
Are you an author, or do you see a problem with this page? Request a review
