Cited by 337

The DOI matches its Crossref record; 6 of the 6 references it cites were found in a registry or an index.

Direct Comparisons of Illumina vs. Roche 454 Sequencing Technologies on the Same Microbial Community DNA Sample

Luo, Chengwei, Tsementzi, Despina, Kyrpides, Nikos, Read, Timothy, Konstantinidis, Konstantinos T.·2012·PLoS ONE

Overview

The claims and statistics of this paper haven’t been checked yet.

Run the check — free, no account needed. It reads the open-access text and checks the sources it cites.

A few free checks a day · papers already verified open instantly · results are public

Integrity signals

Registry

Crossref · 10.1371/journal.pone.0030087

Cites

6 of 6 references verified0 citation errors · 0 not checkable

Statistics

Figures

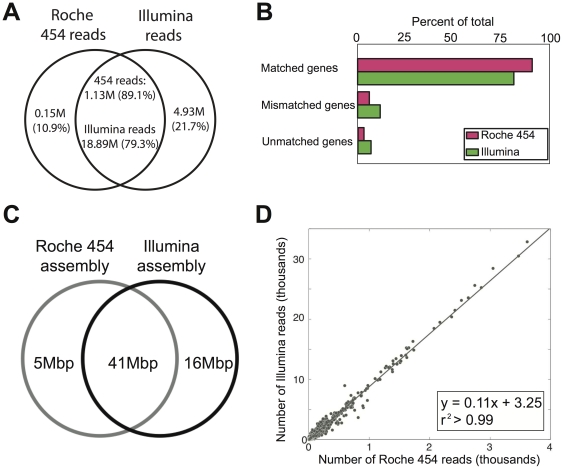
Figure 1 Genetic diversity and gene abundance in Roche 454 vs. Illumina data. (A) Venn diagram showing the extent of overlapping and platform-specific raw reads between the Lanier.454 and Lanier.Illumina datasets (without assembly). (B) Protein sequences annotated on raw (not assembled) reads matched genes in the reference assembly more frequently for the Roche 454 than the Illumina data. Conversely, protein sequences annotated on Illumina reads more frequently matched to the wrong protein sequence in the reference assembly (mismatched genes) or did not match any reference gene (unmatched genes). (C) Assemblies were obtained from 502 Mbp of Roche 454 and 2,460 Mbp of Illumina data using established protocols. Venn diagram showing the extent of overlapping and platform-specific sequences of assembled contigs longer than 500 bp. (D) Number of Roche 454 (x-axis) and Illumina (y-axis) reads mapping on the same contig shared between the two assemblies.
Figure 1 Genetic diversity and gene abundance in Roche 454 vs. Illumina data. (A) Venn diagram showing the extent of overlapping and platform-specific raw reads between the Lanier.454 and Lanier.Illumina datasets (without assembly). (B) Protein sequences annotated on raw (not assembled) reads matched genes in the reference assembly more frequently for the Roche 454 than the Illumina data. Conversely, protein sequences annotated on Illumina reads more frequently matched to the wrong protein sequence in the reference assembly (mismatched genes) or did not match any reference gene (unmatched genes). (C) Assemblies were obtained from 502 Mbp of Roche 454 and 2,460 Mbp of Illumina data using established protocols. Venn diagram showing the extent of overlapping and platform-specific sequences of assembled contigs longer than 500 bp. (D) Number of Roche 454 (x-axis) and Illumina (y-axis) reads mapping on the same contig shared between the two assemblies.CC BY · PubMed Central
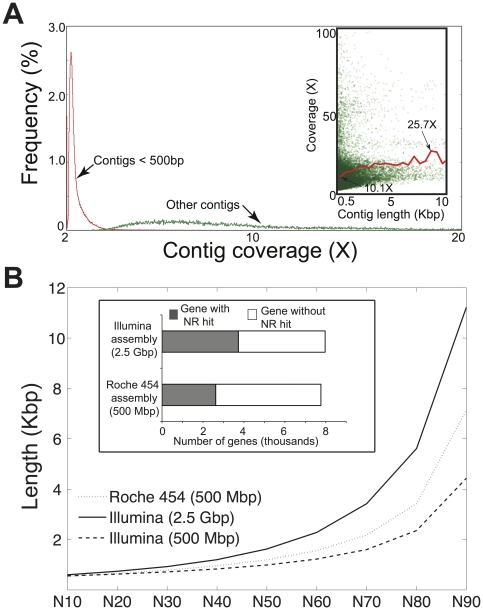
Figure 2 Average length and sequence accuracy comparisons of the Roche 454 and Illumina assembled contigs. (A) Length and coverage distribution of the contigs assembled from the Lanier.Illumina dataset. Note that contigs shorter than 500 bp (red) were numerically more abundant than longer contigs (green) but were characterized by substantially lower coverage (inset). (B) Graph shows the comparison of the contig length of three assemblies plotted against the N statistic of the assembly [for instance, N40 (x-axis) is equal to about 1 Kbp (y-axis), which means that (100−40 = 60) % of the entire assembly is contained in contigs no shorter than 1 Kbp]. Due to frameshifts caused primarily by homopolymer-associated errors in the derived consensus sequence of the contigs, genes from Roche 454 assembly had fewer complete matches in the NR database relatively to their Illumina counterparts (inset; results are based on a total of 72,709 gene sequences annotated on contigs that were shared between the two assemblies and were longer than 500 bp).
Figure 2 Average length and sequence accuracy comparisons of the Roche 454 and Illumina assembled contigs. (A) Length and coverage distribution of the contigs assembled from the Lanier.Illumina dataset. Note that contigs shorter than 500 bp (red) were numerically more abundant than longer contigs (green) but were characterized by substantially lower coverage (inset). (B) Graph shows the comparison of the contig length of three assemblies plotted against the N statistic of the assembly [for instance, N40 (x-axis) is equal to about 1 Kbp (y-axis), which means that (100−40 = 60) % of the entire assembly is contained in contigs no shorter than 1 Kbp]. Due to frameshifts caused primarily by homopolymer-associated errors in the derived consensus sequence of the contigs, genes from Roche 454 assembly had fewer complete matches in the NR database relatively to their Illumina counterparts (inset; results are based on a total of 72,709 gene sequences annotated on contigs that were shared between the two assemblies and were longer than 500 bp).CC BY · PubMed Central
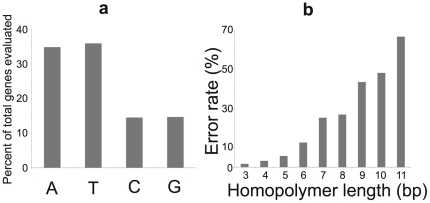
Figure 3 Characteristics of homopolymer-related sequence errors in Roche 454 metagenome assembly. (A) A's and T's contribute significantly more homopolymer errors than C's and G's. The average G+C% content of the metagenome was 47.4%; thus, our results are not simply attributable to higher abundance of A's and T's in the metagenome. (B) Error rate (as a percentage of the total genes evaluated, y-axis) increases as homopolymer length increases (x-axis).
Figure 3 Characteristics of homopolymer-related sequence errors in Roche 454 metagenome assembly. (A) A's and T's contribute significantly more homopolymer errors than C's and G's. The average G+C% content of the metagenome was 47.4%; thus, our results are not simply attributable to higher abundance of A's and T's in the metagenome. (B) Error rate (as a percentage of the total genes evaluated, y-axis) increases as homopolymer length increases (x-axis).CC BY · PubMed Central
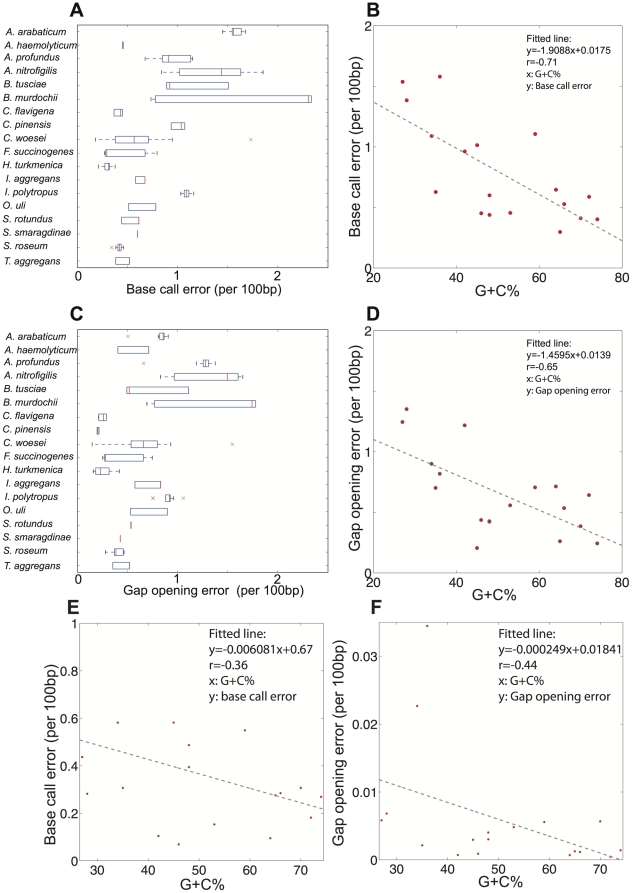
Figure 4 Roche 454 and Illumina GA II read sequence quality based on isolate genome data. Roche 454 sequencing quality is evaluated in panels A through D, which show: (A) base call error rate of individual reads (x-axis) for each genome evaluated (y-axis); (B) base call error rate (y-axis) plotted against the G+C% of the genome; (C) gap opening error rate of individual reads (x-axis) for each genome evaluated (y-axis); (D) gap opening error rate (y-axis) plotted against the G+C% of the genome. Illumina GA II sequencing quality is evaluated in panels E and F, which show: (E) base call error rate of individual reads plotted against the G+C% of the genome; and (F) gap opening error rate of individual reads plotted against the G+C% of the genome. Panels A and C represent the variation observed in reads from different (replicate) datasets of the same genome; red bars represent the median, the upper and lower box boundaries represent the upper and lower quartiles, and the upper and lower whiskers represent the largest and smallest observations. All 2D plots (panels B, D, E, and F) represent the arithmetic average of the medians of each dataset for the same genome; Illumina medians were identical among replicate datasets; therefore, only one value is shown in panel E. The results show that Illumina sequence quality was affected less than that of Roche 454 by the G+C% content of the sequenced DNA (note the lower r-squared value and the slope in E). Thus, the results reported for Illumina based on the metagenome of Lake Lanier (47 G+C%) should be also applicable to metagenomes with different G+C% contents.
Figure 4 Roche 454 and Illumina GA II read sequence quality based on isolate genome data. Roche 454 sequencing quality is evaluated in panels A through D, which show: (A) base call error rate of individual reads (x-axis) for each genome evaluated (y-axis); (B) base call error rate (y-axis) plotted against the G+C% of the genome; (C) gap opening error rate of individual reads (x-axis) for each genome evaluated (y-axis); (D) gap opening error rate (y-axis) plotted against the G+C% of the genome. Illumina GA II sequencing quality is evaluated in panels E and F, which show: (E) base call error rate of individual reads plotted against the G+C% of the genome; and (F) gap opening error rate of individual reads plotted against the G+C% of the genome. Panels A and C represent the variation observed in reads from different (replicate) datasets of the same genome; red bars represent the median, the upper and lower box boundaries represent the upper and lower quartiles, and the upper and lower whiskers represent the largest and smallest observations. All 2D plots (panels B, D, E, and F) represent the arithmetic average of the medians of each dataset for the same genome; Illumina medians were identical among replicate datasets; therefore, only one value is shown in panel E. The results show that Illumina sequence quality was affected less than that of Roche 454 by the G+C% content of the sequenced DNA (note the lower r-squared value and the slope in E). Thus, the results reported for Illumina based on the metagenome of Lake Lanier (47 G+C%) should be also applicable to metagenomes with different G+C% contents.CC BY · PubMed Central
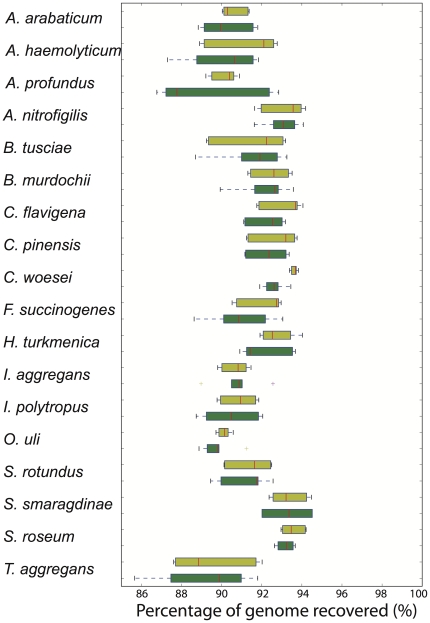
Figure 5 Percentage of reference genome recovered by Illumina (yellow) and Roche 454 (green) assemblies. Graph shows the variation observed in assemblies from different (replicate) datasets of the same genome; red bars represent the median, the upper and lower box boundaries represent the upper and lower quartiles, and the upper and lower whiskers represent the largest and smallest observations. Note that Illumina assemblies recovered a significantly larger fraction of the reference genome than Roche 454 assemblies (two tailed Whitney-Mann U test p-value = 0.014), which is consistent with the results from the metagenomes (Fig. 2). The results for the isolate genomes were based on Illumina input reads that were about 5 times as many as the Roche 454 input reads to provide a ratio that was similar to that of the metagenomic comparisons (5∶1).
Figure 5 Percentage of reference genome recovered by Illumina (yellow) and Roche 454 (green) assemblies. Graph shows the variation observed in assemblies from different (replicate) datasets of the same genome; red bars represent the median, the upper and lower box boundaries represent the upper and lower quartiles, and the upper and lower whiskers represent the largest and smallest observations. Note that Illumina assemblies recovered a significantly larger fraction of the reference genome than Roche 454 assemblies (two tailed Whitney-Mann U test p-value = 0.014), which is consistent with the results from the metagenomes (Fig. 2). The results for the isolate genomes were based on Illumina input reads that were about 5 times as many as the Roche 454 input reads to provide a ratio that was similar to that of the metagenomic comparisons (5∶1).CC BY · PubMed Central
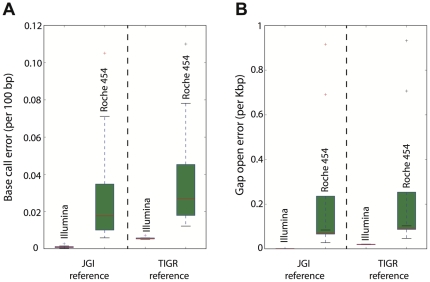
Figure 6 Comparisons of Illumina and Roche 454 assemblies against an independently sequenced reference genome. Nine Illumina and eight Roche 454 assemblies from independent replicate datasets of the Fibrobacter succinogenes subsp. succinogenes S85 genome sequenced at JGI were compared against the reference assemblies from the JGI and TIGR genome projects of Fibrobacter succinogenes subsp. succinogenes S85. Graphs show the calculated base call error rate (A) and gap open error rate (B) for each comparison (figure key). Red bars represent the median, the upper and lower box boundaries represent the upper and lower quartiles, and the upper and lower whiskers represent the largest and smallest observations.
Figure 6 Comparisons of Illumina and Roche 454 assemblies against an independently sequenced reference genome. Nine Illumina and eight Roche 454 assemblies from independent replicate datasets of the Fibrobacter succinogenes subsp. succinogenes S85 genome sequenced at JGI were compared against the reference assemblies from the JGI and TIGR genome projects of Fibrobacter succinogenes subsp. succinogenes S85. Graphs show the calculated base call error rate (A) and gap open error rate (B) for each comparison (figure key). Red bars represent the median, the upper and lower box boundaries represent the upper and lower quartiles, and the upper and lower whiskers represent the largest and smallest observations.CC BY · PubMed Central
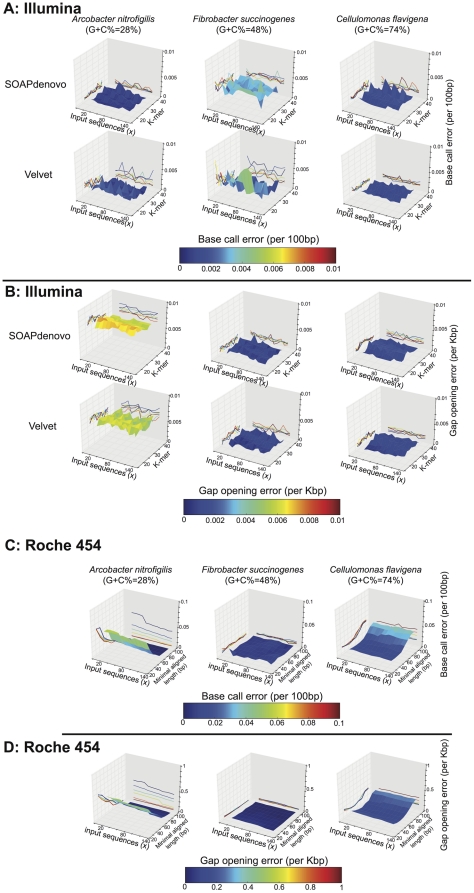
Figure 7 Dependence of the quality of assembled contigs on the parameters of the Illumina assembly. Assembly parameters (primary and secondary x-axes) were evaluated for low (Arcobacter nitrofigilis, 28%; left), medium (Fibrobacter succinogenes, 48%; middle), and high (Cellulomonas flavigena, 74%; right) G+C% genomes. For each genome, a 2D-grid assembly was performed, varying the size of input sequences (20×, 30×, 40×, …, 130×) and the K-mer (21, 23, 25, …, 37) of each of the assemblers used (SOAPdenovo and Velvet). The quality of the resulting contigs was examined in terms of base call error (A) and gap opening error (B), which revealed that the combination of the parameters of the assembly did not have a dramatic effect on the quality of the contigs (see projected contours on x-z and y-z space). Similarly for the Roche 454 data, a 2D-grid assembly was performed, varying the size of input sequences (20×, 30×, 40×, …, 130×) and the minimal aligned length to merge contigs or reads (30 bp, 40 bp, …, 100 bp) for Newbler. The quality of the resulting contigs was examined in terms of base call error (C) and gap opening error (D), which revealed that the combination of the parameters of the assembly did not have a dramatic effect on the quality of the contigs except in the extreme values of the minimal aligned length (see projected contours on x-z and y-z space), which were avoided in our direct comparisons of Illumina versus Roche 454 assemblies.
Figure 7 Dependence of the quality of assembled contigs on the parameters of the Illumina assembly. Assembly parameters (primary and secondary x-axes) were evaluated for low (Arcobacter nitrofigilis, 28%; left), medium (Fibrobacter succinogenes, 48%; middle), and high (Cellulomonas flavigena, 74%; right) G+C% genomes. For each genome, a 2D-grid assembly was performed, varying the size of input sequences (20×, 30×, 40×, …, 130×) and the K-mer (21, 23, 25, …, 37) of each of the assemblers used (SOAPdenovo and Velvet). The quality of the resulting contigs was examined in terms of base call error (A) and gap opening error (B), which revealed that the combination of the parameters of the assembly did not have a dramatic effect on the quality of the contigs (see projected contours on x-z and y-z space). Similarly for the Roche 454 data, a 2D-grid assembly was performed, varying the size of input sequences (20×, 30×, 40×, …, 130×) and the minimal aligned length to merge contigs or reads (30 bp, 40 bp, …, 100 bp) for Newbler. The quality of the resulting contigs was examined in terms of base call error (C) and gap opening error (D), which revealed that the combination of the parameters of the assembly did not have a dramatic effect on the quality of the contigs except in the extreme values of the minimal aligned length (see projected contours on x-z and y-z space), which were avoided in our direct comparisons of Illumina versus Roche 454 assemblies.CC BY · PubMed Central

Verification

Claims the paper makes

The claims and statistics of this paper haven’t been checked yet.

Run the check — free, no account needed. It reads the open-access text and checks the sources it cites.

A few free checks a day · papers already verified open instantly · results are public

Claims other papers make about this one

Each is checked against this paper’s own text: does it say what the citing paper says it does?

Self-check

Percentages, sums and reported differences re-computed from the paper’s own numbers.

The self-check needs the paper’s full text.

Citations

Cites

Show all 6 references

Research works printed but not linked: 25

  1. EF DeLong, 2006, Community genomics among stratified microbial assemblages in the ocean's interior., Science, 311, 496, 10.1126/science.1120250 · DOI
  2. KT Konstantinidis, 2009, Comparative metagenomic analysis of a microbial community residing at a depth of 4,000 meters at station ALOHA in the North Pacific subtropical gyre., Appl Environ Microbiol, 75, 5345, 10.1128/AEM.00473-09 · DOI
  3. M Margulies, 2005, Genome sequencing in microfabricated high-density picolitre reactors., Nature, 437, 376, 10.1038/nature03959 · DOI · Paper page
  4. S Bennett, 2004, Solexa Ltd., Pharmacogenomics, 5, 433, 10.1517/14622416.5.4.433 · DOI
  5. J Shendure, 2005, Accurate multiplex polony sequencing of an evolved bacterial genome., Science, 309, 1728, 10.1126/science.1117389 · DOI
  6. J McCarren, 2010, Microbial community transcriptomes reveal microbes and metabolic pathways associated with dissolved organic matter turnover in the sea., Proc Natl Acad Sci U S A, 107, 16420, 10.1073/pnas.1010732107 · DOI
  7. R Mackelprang, 2011, Metagenomic analysis of a permafrost microbial community reveals a rapid response to thaw., Nature
  8. C Quince, 2009, Accurate determination of microbial diversity from 454 pyrosequencing data., Nat Methods, 6, 639, 10.1038/nmeth.1361 · DOI
  9. V Gomez-Alvarez, 2009, Systematic artifacts in metagenomes from complex microbial communities., ISME J, 3, 1314, 10.1038/ismej.2009.72 · DOI
  10. Y Erlich, 2008, Alta-Cyclic: a self-optimizing base caller for next-generation sequencing., Nat Methods, 5, 679, 10.1038/nmeth.1230 · DOI
  11. PC Dolan, 2008, TileQC: a system for tile-based quality control of Solexa data., BMC Bioinformatics, 9, 250, 10.1186/1471-2105-9-250 · DOI
  12. J Schroder, 2010, Reference-free validation of short read data., PLoS One, 5, e12681, 10.1371/journal.pone.0012681 · DOI
  13. K Nakamura, 2011, Sequence-specific error profile of Illumina sequencers., Nucleic acids research, 39, e90, 10.1093/nar/gkr344 · DOI
  14. S Oh, 2011, Metagenomic insights into the evolution, function, and complexity of the planktonic microbial community of lake lanier, a temperate freshwater ecosystem., Appl Environ Microbiol, 77, 6000, 10.1128/AEM.00107-11 · DOI
  15. C Luo, 2011, Individual genome assembly from complex community short-read metagenomic datasets., The ISME Journal
  16. KT Konstantinidis, 2008, Genomic patterns of recombination, clonal divergence and environment in marine microbial populations., ISME J, 2, 1052, 10.1038/ismej.2008.62 · DOI
  17. B Rodriguez-Brito, 2010, Viral and microbial community dynamics in four aquatic environments., ISME J, 4, 739, 10.1038/ismej.2010.1 · DOI
  18. FJ Stewart, 2010, Development and quantitative analyses of a universal rRNA-subtraction protocol for microbial metatranscriptomics., ISME J, 4, 896, 10.1038/ismej.2010.18 · DOI
  19. J Eid, 2009, Real-time DNA sequencing from single polymerase molecules., Science, 323, 133, 10.1126/science.1162986 · DOI · Paper page
  20. DR Zerbino, 2008, Velvet: algorithms for de novo short read assembly using de Bruijn graphs., Genome Res, 18, 821, 10.1101/gr.074492.107 · DOI
  21. H Noguchi, 2006, MetaGene: prokaryotic gene finding from environmental genome shotgun sequences., Nucleic Acids Res, 34, 5623, 10.1093/nar/gkl723 · DOI
  22. M Rho, 2010, FragGeneScan: predicting genes in short and error-prone reads., Nucleic Acids Res, 38, e191, 10.1093/nar/gkq747 · DOI
  23. K Nakamura, 2011, Sequence-specific error profile of Illumina sequencers., Nucleic Acids Res, 39, e90, 10.1093/nar/gkr344 · DOI
  24. SF Altschul, 1997, Gapped BLAST and PSI-BLAST: a new generation of protein database search programs., Nucleic Acids Res, 25, 3389, 10.1093/nar/25.17.3389 · DOI · Paper page
  25. JD Thompson, 2002, Multiple sequence alignment using ClustalW and ClustalX., Curr Protoc Bioinformatics, Chapter 2, Unit 2 3

Cited by

Sorted by citations

Metadata

Authors
Luo, C., Tsementzi, D., Kyrpides, N., Read, T., & Konstantinidis, K. T.
Venue
PLoS ONE
Published
2012-02-10
Volume
7
Issue
2
Pages
e30087
ISSN
1932-6203
Cited by
337
References
6
Language
en

About these checks

Registry, retraction, Cites and statistics results are computed, not judged, with one exception: a printed reference that no index lists is read once by a model before it counts as a citation error. Claims are extracted by a model and kept only when their quote appears verbatim in the text; each cited source is then checked, with a model’s help, for whether it says what the claim relies on. Those verdicts can be wrong — read the claim’s quote and the cited source before relying on one.

Statistics and arithmetic are recomputed, not judged.

Confidence bands are shown only for fields calibrated on our annotated test set. None is calibrated yet, so no band is shown.

What counts as a claim ›How we measure confidence ›How we check this ›

Are you an author, or do you see a problem with this page? Request a review