

The DOI matches its Crossref record; 35 of the 35 references it cites were found in a registry or an index.
Correlation Functions Quantify Super-Resolution Images and Estimate Apparent Clustering Due to Over-Counting
Open accessAbstract
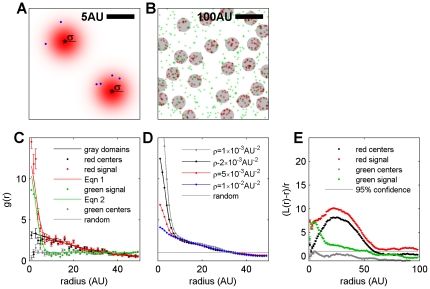
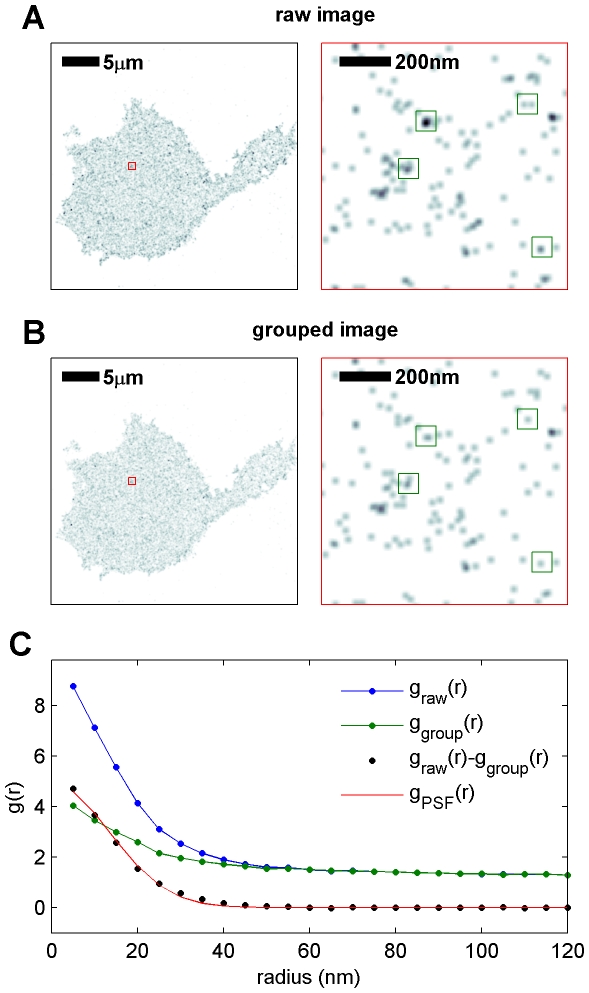
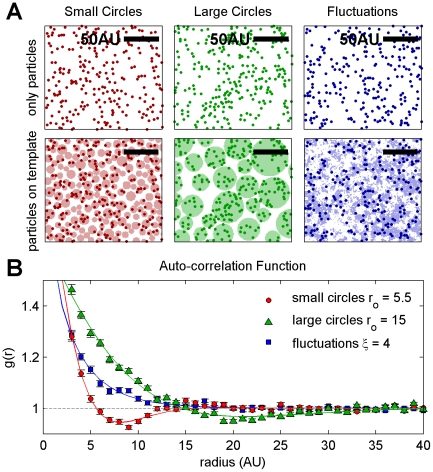
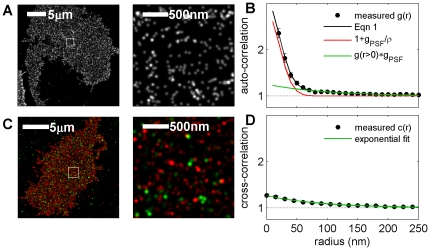
We present an analytical method using correlation functions to quantify clustering in super-resolution fluorescence localization images and electron microscopy images of static surfaces in two dimensions. We use this method to quantify how over-counting of labeled molecules contributes to apparent self-clustering and to calculate the effective lateral resolution of an image. This treatment applies to distributions of proteins and lipids in cell membranes, where there is significant interest in using electron microscopy and super-resolution fluorescence localization techniques to probe membrane heterogeneity. When images are quantified using pair auto-correlation functions, the magnitude of apparent clustering arising from over-counting varies inversely with the surface density of labeled molecules and does not depend on the number of times an average molecule is counted. In contrast, we demonstrate that over-counting does not give rise to apparent co-clustering in double label experiments when pair cross-correlation functions are measured. We apply our analytical method to quantify the distribution of the IgE receptor (FcεRI) on the plasma membranes of chemically fixed RBL-2H3 mast cells from images acquired using stochastic optical reconstruction microscopy (STORM/dSTORM) and scanning electron microscopy (SEM). We find that apparent clustering of FcεRI-bound IgE is dominated by over-counting labels on individual complexes when IgE is directly conjugated to organic fluorophores. We verify this observation by measuring pair cross-correlation functions between two distinguishably labeled pools of IgE-FcεRI on the cell surface using both imaging methods. After correcting for over-counting, we observe weak but significant self-clustering of IgE-FcεRI in fluorescence localization measurements, and no residual self-clustering as detected with SEM. We also apply this method to quantify IgE-FcεRI redistribution after deliberate clustering by crosslinking with two distinct trivalent ligands of defined architectures, and we evaluate contributions from both over-counting of labels and redistribution of proteins.
Overview
The claims and statistics of this paper haven’t been checked yet.
Run the check — free, no account needed. It reads the open-access text and checks the sources it cites.
Integrity signals
Registry
Cites
Statistics
Figures
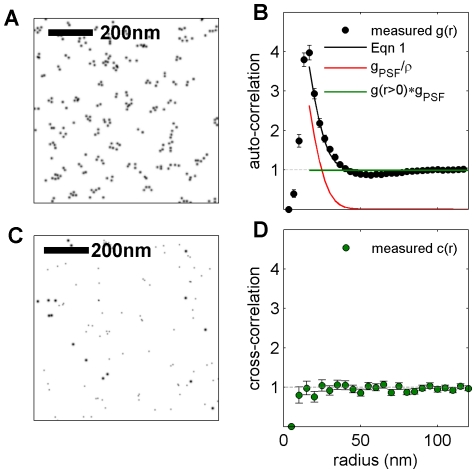
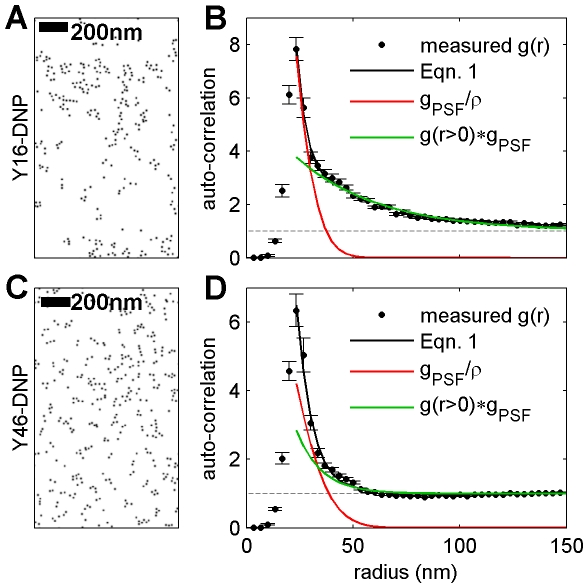
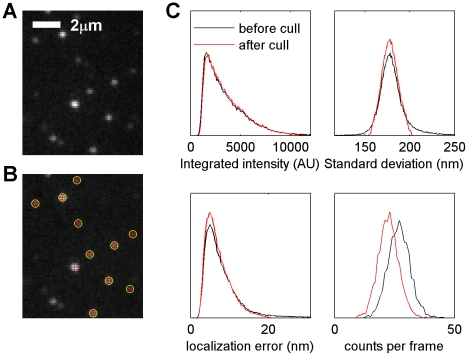
Verification
Claims the paper makes
The claims and statistics of this paper haven’t been checked yet.
Run the check — free, no account needed. It reads the open-access text and checks the sources it cites.
Claims other papers make about this one
Each is checked against this paper’s own text: does it say what the citing paper says it does?
The source backs part of the claim, not all of it — or backs it for a different population, condition or comparison.
In the citing paper
“Different from the ACF, overcounting has no effect on the PCF39.”
From A trans-synaptic nanocolumn aligns neurotransmitter release to receptors (2016) · cites this paper as [39]
Experimental — accuracy not yet measuredThe cited source says what the claim attributes to it.
In the citing paper
“The extent of ga(r) over 1, i.e. r0 for ga(r0) =1, is related to the pattern size of the internal heterogeneity (Extended Data Figure 2b–c)39.”
From A trans-synaptic nanocolumn aligns neurotransmitter release to receptors (2016) · cites this paper as [39]
Self-check
Percentages, sums and reported differences re-computed from the paper’s own numbers.
The self-check needs the paper’s full text.
Citations
Cites
The Fluid Mosaic Model of the Structure of Cell Membranes
Singer, S. J., & Nicolson, G. L. (1972) · Science · doi:10.1126/science.175.4023.720 · Cited by 9,158
Imaging Intracellular Fluorescent Proteins at Nanometer Resolution
Betzig, E., Patterson, G. H., Sougrat, R., Lindwasser, O. W., Olenych, S. G., Bonifacino, J. S., Davidson, M. W., Lippincott‐Schwartz, J., & Hess, H. F. (2006) · Science · doi:10.1126/science.1127344 · Cited by 8,941
Sub-diffraction-limit imaging by stochastic optical reconstruction microscopy (STORM)
Rust, M., Bates, M., & Zhuang, X. (2006) · Nature Methods · doi:10.1038/nmeth929 · Cited by 7,823
Crystal Statistics. I. A Two-Dimensional Model with an Order-Disorder Transition
Onsager, L. (1944) · Physical Review · doi:10.1103/physrev.65.117 · Cited by 6,634
Ultra-High Resolution Imaging by Fluorescence Photoactivation Localization Microscopy
Hess, S. T., Girirajan, T. P. K., & Mason, M. D. (2006) · Biophysical Journal · doi:10.1529/biophysj.106.091116 · Cited by 3,684
Subdiffraction‐Resolution Fluorescence Imaging with Conventional Fluorescent Probes
Heilemann, M., van de Linde, S., Schüttpelz, M., Kasper, R. T., Seefeldt, B., Mukherjee, A., Tinnefeld, P., & Sauer, M. (2008) · Angewandte Chemie International Edition · doi:10.1002/anie.200802376 · Cited by 1,870
Fluorescence microscopy with diffraction resolution barrier broken by stimulated emission
Klar, T. A., Jakobs, S., Dyba, M., Egner, A., & Hell, S. W. (2000) · Proceedings of the National Academy of Sciences · doi:10.1073/pnas.97.15.8206 · Cited by 1,869
Fast, three-dimensional super-resolution imaging of live cells
Jones, S. A., Shim, S., He, J., & Zhuang, X. (2011) · Nature Methods · doi:10.1038/nmeth.1605 · Cited by 757
Probing protein heterogeneity in the plasma membrane using PALM and pair correlation analysis
Sengupta, P., Jovanović‐Talisman, T., Skoko, D., Renz, M., Veatch, S. L., & Lippincott‐Schwartz, J. (2011) · Nature Methods · doi:10.1038/nmeth.1704 · Cited by 588
Self-citationStatistical Mechanics: Entropy, Order Parameters, and Complexity
Sethna, J. P. (2021) · doi:10.1093/oso/9780198865247.001.0001 · Cited by 495
Cited by
Sorted by citations
Single-molecule localization microscopy
Lelek, M., Gyparaki, M. T., Beliu, G., Schueder, F., Griffié, J., Manley, S., Jungmann, R., Sauer, M., Lakadamyali, M., & Zimmer, C. (2021) · Nature Reviews Methods Primers · doi:10.1038/s43586-021-00038-x · Cited by 1,017
Measuring image resolution in optical nanoscopy
Nieuwenhuizen, R. P. J., Lidke, K. A., Bates, M., Leyton-Puig, D., Grünwald, D., Stallinga, S., & Rieger, B. (2013) · Nature Methods · doi:10.1038/nmeth.2448 · Cited by 804
A trans-synaptic nanocolumn aligns neurotransmitter release to receptors
Tang, A.-H., Chen, H., Li, T. P., Metzbower, S. R., MacGillavry, H. D., & Blanpied, T. A. (2016) · Nature · doi:10.1038/nature19058 · Cited by 677
Phosphatidylserine Vesicles Enable Efficient En Bloc Transmission of Enteroviruses
Chen, Y.-H., Du, W., Hagemeijer, M. C., Takvorian, P. M., Pau, C., Cali, A., Brantner, C. A., Stempinski, E., Connelly, P. S., Ma, H.-C., et al. (2015) · Cell · doi:10.1016/j.cell.2015.01.032 · Cited by 470
ecDNA hubs drive cooperative intermolecular oncogene expression
Hung, K. L., Yost, K. E., Xie, L., Shi, Q., Helmsauer, K., Luebeck, J., Schöpflin, R., Lange, J. T., González, R. C., Weiser, N. E., et al. (2021) · Nature · doi:10.1038/s41586-021-04116-8 · Cited by 364
Metadata
- Authors
- Veatch, S. L., Machta, B. B., Shelby, S. A., Chiang, E. N., Holowka, D. A., & Baird, B. A.
- Affiliations
- Cornell University (US)
- Corresponding author
- Veatch, Sarah L.
- Venue
- PLoS ONE
- Publisher
- Public Library of Science (PLoS)
- Published
- 2012-02-27
- Volume
- 7
- Issue
- 2
- Pages
- e31457
- ISSN
- 1932-6203 (ISSN-L)
- PMC
- PMC3288038
- OpenAlex
- W2073576660
- Cited by
- 290
- References
- 35
- Citations by year
- 2026: 6 · 2025: 11 · 2024: 12 · 2023: 13 · 2022: 19 · 2021: 22 · 2020: 16 · 2019: 24 · 2018: 24 · 2017: 23 · 2016: 33 · 2015: 21 · 2014: 36 · 2013: 23 · 2012: 7
- FWCI
- 12.73
- Type
- journal article
- Language
- en
- Open access
- gold
- doi.org
- Locations
- PLoS ONE (publishedVersion, cc-by)
- PubMed Central (publishedVersion, cc-by)
- PubMed (publishedVersion)
- arXiv (Cornell University) (submittedVersion)
- RePEc: Research Papers in Economics (submittedVersion)
- DOAJ (DOAJ: Directory of Open Access Journals) (submittedVersion, cc-by-sa)
- arXiv (Cornell University)
- Funders
- National Institutes of Health
- National Institute of General Medical Sciences (R00GM087810)
- National Institute of Allergy and Infectious Diseases (R01-AI18306, R01AI018306)
- Topics
- Life Sciences › Biochemistry, Genetics and Molecular Biology › Biophysics › Advanced Fluorescence Microscopy Techniques
- Life Sciences › Biochemistry, Genetics and Molecular Biology › Biophysics › Cell Image Analysis Techniques
- Life Sciences › Biochemistry, Genetics and Molecular Biology › Molecular Biology › Lipid Membrane Structure and Behavior
- Keywords
- super-resolution imaging, storms, scanning electron microscopy, FcεRI, IgE receptor, mast cells, membrane protein clustering, protein redistribution, crosslinking
- MeSH terms
- Animals, Cell Line, Cell Membrane, Fluorescent Dyes, Fourier Analysis, Immunoglobulin E, Image Processing, Computer-Assisted, Ligands, Microscopy, Electron, Microscopy, Electron, Scanning, Stochastic Processes, Models, Statistical, Cluster Analysis, Normal Distribution, Poisson Distribution, Receptors, IgE, Rats
About these checks
Registry, retraction, Cites and statistics results are computed, not judged, with one exception: a printed reference that no index lists is read once by a model before it counts as a citation error. Claims are extracted by a model and kept only when their quote appears verbatim in the text; each cited source is then checked, with a model’s help, for whether it says what the claim relies on. Those verdicts can be wrong — read the claim’s quote and the cited source before relying on one.
Statistics and arithmetic are recomputed, not judged.
Confidence bands are shown only for fields calibrated on our annotated test set. None is calibrated yet, so no band is shown.
What counts as a claim ›How we measure confidence ›How we check this ›
Are you an author, or do you see a problem with this page? Request a review
