

The DOI matches its Crossref record; 2 of the 2 references it cites were found in a registry or an index.
Complete Mitochondrial Genomes Reveal Neolithic Expansion into Europe
Overview
The claims and statistics of this paper haven’t been checked yet.
Run the check — free, no account needed. It reads the open-access text and checks the sources it cites.
Integrity signals
Registry
Cites
Statistics
Figures
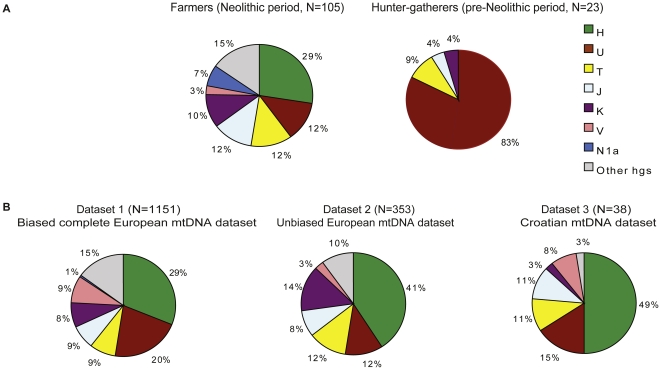
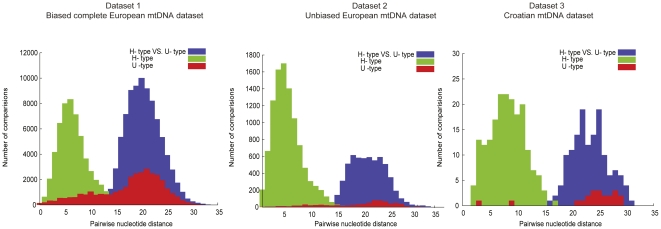
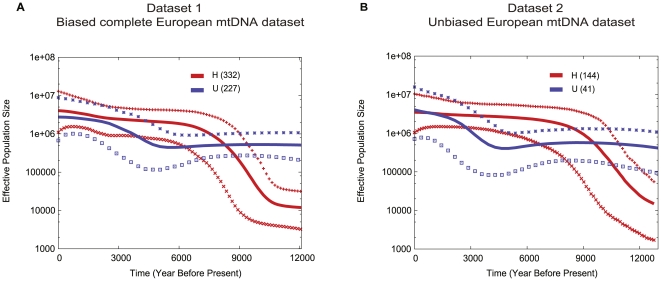
Verification
Claims the paper makes
The claims and statistics of this paper haven’t been checked yet.
Run the check — free, no account needed. It reads the open-access text and checks the sources it cites.
Claims other papers make about this one
Each is checked against this paper’s own text: does it say what the citing paper says it does?
In the citing paper
“In fact, most mitochondrial lineages in modern Europeans derive from first farmers, and have a Neolithic time-depth24.”
From Cultural hitchhiking and competition between patrilineal kin groups explain the post-Neolithic Y-chromosome bottleneck (2018) · cites this paper as [24]
Self-check
Percentages, sums and reported differences re-computed from the paper’s own numbers.
The self-check needs the paper’s full text.
Citations
Cites
Bayesian Selection of Continuous-Time Markov Chain Evolutionary Models
Suchard, M. A., Weiss, R. E., & Sinsheimer, J. S. (2001) · Molecular Biology and Evolution · doi:10.1093/oxfordjournals.molbev.a003872 · Cited by 791
Comment on "Ancient DNA from the First European Farmers in 7500-Year-Old Neolithic Sites"
Ammerman, A. J., Pinhasi, R., & Bánffy, E. (2006) · Science · doi:10.1126/science.1123936 · Cited by 56
Research works printed but not linked: 36
- M Zvelebil, 1989, On the transition to farming in Europe, or what was spreading with the Neolithic: a relay to Ammerman., Antiqutiy, 63, 379, 10.1017/S0003598X00076110 · DOI
- ML Sampietro, 2007, Palaeogenetic evidence supports a dual model of Neolithic spreading into Europe., Proceedings of the Royal Society B-Biological Sciences, 274, 2161, 10.1098/rspb.2007.0465 · DOI
- B Bramanti, 2009, Genetic Discontinuity Between Local Hunter-Gatherers and Central Europe's First Farmers., Science, 326, 137, 10.1126/science.1176869 · DOI · Paper page
- W Haak, 2010, Ancient DNA from European early neolithic farmers reveals their near eastern affinities., PLoS Biol, 8, e1000536, 10.1371/journal.pbio.1000536 · DOI · Paper page
- MF Deguilloux, 2011, News From the West: Ancient DNA From a French Megalithic Burial Chamber., American Journal of Physical Anthropology, 144, 108, 10.1002/ajpa.21376 · DOI
- M Lacan, 2011, Ancient DNA reveals male diffusion through the Neolithic Mediterranean route., Proceedings of the National Academy of Sciences of the United States of America, 108, 9788, 10.1073/pnas.1100723108 · DOI
- C Gamba, 2012, Ancient DNA from an Early Neolithic Iberian population supports a pioneer colonization by first farmers., Mol Ecol, 21, 45, 10.1111/j.1365-294X.2011.05361.x · DOI
- J Krause, 2010, A complete mtDNA genome of an early modern human from Kostenki, Russia., Curr Biol, 20, 231, 10.1016/j.cub.2009.11.068 · DOI · Paper page
- M Pala, 2009, Mitochondrial haplogroup U5b3: a distant echo of the epipaleolithic in Italy and the legacy of the early Sardinians., American Journal of Human Genetics, 84, 814, 10.1016/j.ajhg.2009.05.004 · DOI
- L Pereira, 2007, No evidence for an mtDNA role in sperm motility: Data from complete sequencing of asthenozoospermic males., Molecular Biology and Evolution, 24, 868, 10.1093/molbev/msm004 · DOI
- V Carelli, 2006, Haplogroup effects and recombination of mitochondrial DNA: Novel clues from the analysis of Leber hereditary optic neuropathy pedigrees., American Journal of Human Genetics, 78, 564, 10.1086/501236 · DOI
- B Malyarchuk, 2008, Mitochondrial DNA Phylogeny in Eastern and Western Slavs., Molecular Biology and Evolution, 25, 1651, 10.1093/molbev/msn114 · DOI
- C Herrnstadt, 2002, Reduced-median-network analysis of complete mitochondrial DNA coding-region sequences for the major African, Asian, and European haplogroups., American Journal of Human Genetics, 70, 1152, 10.1086/339933 · DOI
- AR Rogers, 1992, Population growth makes waves in the distribution of pairwise genetic differences., Molecular Biology and Evolution, 9, 552
- QD Atkinson, 2008, mtDNA Variation Predicts Population Size in Humans and Reveals a Major Southern Asian Chapter in Human Prehistory., Molecular Biology and Evolution, 25, 468, 10.1093/molbev/msm277 · DOI
- K Tambets, 2004, The Western and Eastern Roots of the Saami–the Story of Genetic “Outliers” Told by Mitochondrial DNA and Y Chromosomes., The American Journal of Human Genetics, 74, 661, 10.1086/383203 · DOI · Paper page
- K Tamura, 2007, MEGA4: Molecular Evolutionary Genetics Analysis (MEGA) software version 4.0., Molecular Biology and Evolution, 24, 1596, 10.1093/molbev/msm092 · DOI
- A Drummond, 2007, BEAST: Bayesian evolutionary analysis by sampling trees., BMC Evolutionary Biology, 7, 214, 10.1186/1471-2148-7-214 · DOI
- D Posada, 1998, MODELTEST: testing the model of DNA substitution., Bioinformatics, 14, 817, 10.1093/bioinformatics/14.9.817 · DOI · Paper page
- MA Newton, 1994, Approximate Bayesian-Inference with the Weighted Likelihood Bootstrap., Journal of the Royal Statistical Society Series B-Methodological, 56, 3, 10.1111/j.2517-6161.1994.tb01956.x · DOI
- AJ Drummond, 2007, BEAST: Bayesian evolutionary analysis by sampling trees., BMC Evol Biol, 7, 214, 10.1186/1471-2148-7-214 · DOI
- SY Ho, 2005, Time dependency of molecular rate estimates and systematic overestimation of recent divergence times., Molecular Biology and Evolution, 22, 1561, 10.1093/molbev/msi145 · DOI
- J Friedlaender, 2005, Expanding Southwest Pacific mitochondrial haplogroups P and Q., Molecular Biology and Evolution, 22, 1506, 10.1093/molbev/msi142 · DOI · Paper page
- A Schonberg, 2011, High-throughput sequencing of complete human mtDNA genomes from the Caucasus and West Asia: high diversity and demographic inferences., Eur J Hum Genet
- S Finnilä, 2001, Phylogenetic Network for European mtDNA., The American Journal of Human Genetics, 68, 1475, 10.1086/320591 · DOI
- R Pello, 2008, Mitochondrial DNA background modulates the assembly kinetics of OXPHOS complexes in a cellular model of mitochondrial disease., Hum Mol Genet, 17, 4001, 10.1093/hmg/ddn303 · DOI
- G Gasparre, 2007, Disruptive mitochondrial DNA mutations in complex I subunits are markers of oncocytic phenotype in thyroid tumors., Proc Natl Acad Sci U S A, 104, 9001, 10.1073/pnas.0703056104 · DOI
- C Fraumene, 2006, High Resolution Analysis and Phylogenetic Network Construction Using Complete mtDNA Sequences in Sardinian Genetic Isolates., Molecular Biology and Evolution, 23, 2101, 10.1093/molbev/msl084 · DOI
- A Achilli, 2004, The molecular dissection of mtDNA haplogroup H confirms that the Franco-Cantabrian glacial refuge was a major source for the European gene pool., American Journal of Human Genetics, 75, 910, 10.1086/425590 · DOI
- DM Behar, 2008, Counting the founders: the matrilineal genetic ancestry of the Jewish Diaspora., PLoS One, 3, e2062, 10.1371/journal.pone.0002062 · DOI
- H Ennafaa, 2009, Mitochondrial DNA haplogroup H structure in North Africa., BMC Genet, 10, 8, 10.1186/1471-2156-10-8 · DOI
- N Maca-Meyer, 2001, Major genomic mitochondrial lineages delineate early human expansions., BMC Genet, 2, 13, 10.1186/1471-2156-2-13 · DOI
- V Álvarez-Iglesias, 2009, New Population and Phylogenetic Features of the Internal Variation within Mitochondrial DNA Macro-Haplogroup R0., PLoS One, 4, e5112, 10.1371/journal.pone.0005112 · DOI
- A Maasz, 2008, Phenotypic variants of the deafness-associated mitochondrial DNA A7445G mutation., Curr Med Chem, 15, 1257, 10.2174/092986708784534910 · DOI
- F Brisighelli, 2009, The Etruscan timeline: a recent Anatolian connection., Eur J Hum Genet, 17, 693, 10.1038/ejhg.2008.224 · DOI
- A Achilli, 2005, Saami and Berbers An Unexpected Mitochondrial DNA Link., American Journal of Human Genetics, 76, 883, 10.1086/430073 · DOI · Paper page
Cited by
Zeng, T. C., Aw, A. J., & Feldman, M. W. (2018) · Nature Communications · doi:10.1038/s41467-018-04375-6 · Cited by 121
Fernández, E., Pérez-Pérez, A., Gamba, C., Prats, E., Cuesta, P., Anfruns, J., Molist, M., Arroyo-Pardo, E., & Turbón, D. (2014) · PLoS Genetics · doi:10.1371/journal.pgen.1004401 · Cited by 109
Metadata
- Authors
- Fu, Q., Rudan, P., Pääbo, S., & Krause, J.
- Venue
- PLoS ONE
- Publisher
- Public Library of Science (PLoS)
- Published
- 2012-03-13
- Volume
- 7
- Issue
- 3
- Pages
- e32473
- ISSN
- 1932-6203
- PMC
- PMC3302788
- Cited by
- 62
- References
- 2
- Language
- en
About these checks
Registry, retraction, Cites and statistics results are computed, not judged, with one exception: a printed reference that no index lists is read once by a model before it counts as a citation error. Claims are extracted by a model and kept only when their quote appears verbatim in the text; each cited source is then checked, with a model’s help, for whether it says what the claim relies on. Those verdicts can be wrong — read the claim’s quote and the cited source before relying on one.
Statistics and arithmetic are recomputed, not judged.
Confidence bands are shown only for fields calibrated on our annotated test set. None is calibrated yet, so no band is shown.
What counts as a claim ›How we measure confidence ›How we check this ›
Are you an author, or do you see a problem with this page? Request a review
How to cite
Cite CoChat for the checks on this page, and the paper for its own findings.
- This page
- CoChat. (2026). Citation check: Complete Mitochondrial Genomes Reveal Neolithic Expansion into Europe. https://app.cochat.ai/papers/10.1371/journal.pone.0032473
- The paper
- Fu, Q., Rudan, P., Pääbo, S., & Krause, J. (2012). Complete Mitochondrial Genomes Reveal Neolithic Expansion into Europe. PLoS ONE. https://doi.org/10.1371/journal.pone.0032473
