

The DOI matches its Crossref record; 95 of the 95 references it cites were found in a registry or an index.
Disrupted Small-World Brain Networks in Moderate Alzheimer's Disease: A Resting-State fMRI Study
Open accessAbstract
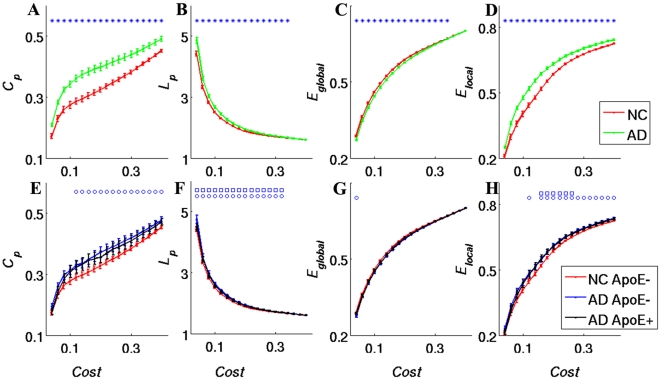
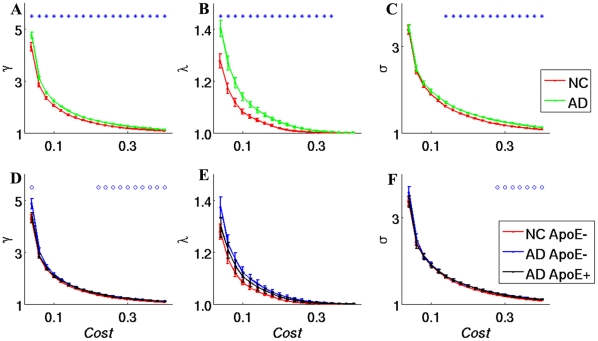
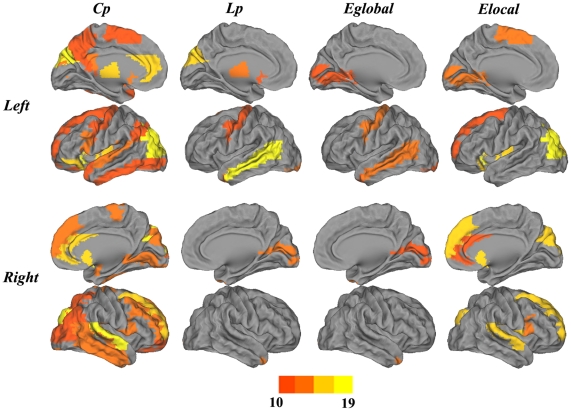
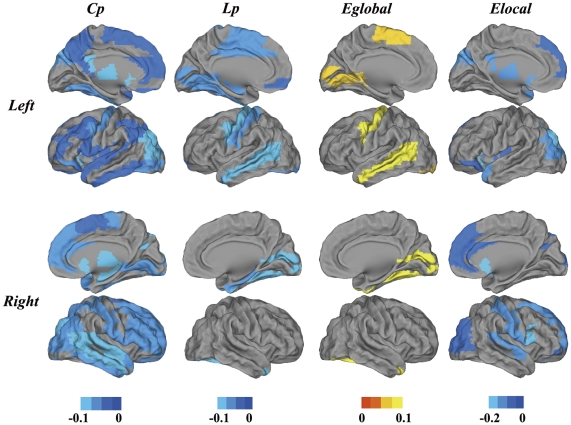
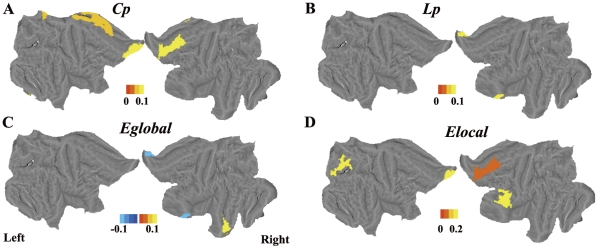
The small-world organization has been hypothesized to reflect a balance between local processing and global integration in the human brain. Previous multimodal imaging studies have consistently demonstrated that the topological architecture of the brain network is disrupted in Alzheimer's disease (AD). However, these studies have reported inconsistent results regarding the topological properties of brain alterations in AD. One potential explanation for these inconsistent results lies with the diverse homogeneity and distinct progressive stages of the AD involved in these studies, which are thought to be critical factors that might affect the results. We investigated the topological properties of brain functional networks derived from resting functional magnetic resonance imaging (fMRI) of carefully selected moderate AD patients and normal controls (NCs). Our results showed that the topological properties were found to be disrupted in AD patients, which showing increased local efficiency but decreased global efficiency. We found that the altered brain regions are mainly located in the default mode network, the temporal lobe and certain subcortical regions that are closely associated with the neuropathological changes in AD. Of note, our exploratory study revealed that the ApoE genotype modulates brain network properties, especially in AD patients.
Overview
The claims and statistics of this paper haven’t been checked yet.
Run the check — free, no account needed. It reads the open-access text and checks the sources it cites.
Integrity signals
Registry
Cites
Statistics
Figures
Verification
Claims the paper makes
The claims and statistics of this paper haven’t been checked yet.
Run the check — free, no account needed. It reads the open-access text and checks the sources it cites.
Claims other papers make about this one
Each is checked against this paper’s own text: does it say what the citing paper says it does?
The cited source says what the claim attributes to it.
In the citing paper
“Clinical studies of patients with AD have demonstrated higher characteristic path lengths of DTI- or fMRI-based connectomes (Lo et al., 2010; Wang et al., 2012; Zhao et al., 2012).”
From Functional and structural connectome properties in the 5XFAD transgenic mouse model of Alzheimer’s disease (2018) · cites this paper as Zhao et al., 2012
Self-check
Percentages, sums and reported differences re-computed from the paper’s own numbers.
The self-check needs the paper’s full text.
Citations
Cites
Collective dynamics of ‘small-world’ networks
Watts, D. J., & Strogatz, S. H. (1998) · Nature · doi:10.1038/30918 · Cited by 43,060
McKhann, G., Drachman, D., Folstein, M., Katzman, R., Price, D., & Stadlan, E. M. (1984) · Neurology · doi:10.1212/wnl.34.7.939 · Cited by 27,915
Tzourio-Mazoyer, N., Landeau, B., Papathanassiou, D., Crivello, F., Etard, O., Delcroix, N., Mazoyer, B., & Joliot, M. (2002) · NeuroImage · doi:10.1006/nimg.2001.0978 · Cited by 16,319
A default mode of brain function
Raichle, M. E., MacLeod, A. M., Snyder, A. Z., Powers, W. J., Gusnard, D. A., & Shulman, G. L. (2001) · Proceedings of the National Academy of Sciences · doi:10.1073/pnas.98.2.676 · Cited by 12,190
Complex brain networks: graph theoretical analysis of structural and functional systems
Bullmore, E., & Sporns, O. (2009) · Nature Reviews Neuroscience · doi:10.1038/nrn2575 · Cited by 11,820
The Clinical Dementia Rating (CDR): Current version and scoring rules
Morris, J. C. (1993) · Neurology · doi:10.1212/wnl.43.11.2412-a · Cited by 9,882
The Brain's Default Network: Anatomy, Function, and Relevance to Disease
Buckner, R. L., Andrews‐Hanna, J. R., & Schacter, D. L. (2008) · Annals of the New York Academy of Sciences · doi:10.1196/annals.1440.011 · Cited by 9,761
Corder, E. H., Saunders, A. M., Strittmatter, W. J., Schmechel, D. E., Gaskell, P. C., Small, G. W., Roses, A. D., Haines, J. L., & Pericak-Vance, M. A. (1993) · Science · doi:10.1126/science.8346443 · Cited by 9,429
Strogatz, S. H. (2001) · Nature · doi:10.1038/35065725 · Cited by 8,236
Sperling, R. A., Aisen, P. S., Beckett, L. A., Bennett, D. A., Craft, S., Fagan, A. M., Iwatsubo, T., Jack, C. R., Kaye, J., Montine, T. J., et al. (2011) · Alzheimer's & Dementia · doi:10.1016/j.jalz.2011.03.003 · Cited by 7,155
Cited by
Sorted by citations
Modern network science of neurological disorders
Stam, C. J. (2014) · Nature reviews. Neuroscience · doi:10.1038/nrn3801 · Cited by 1,327
Small-world human brain networks: Perspectives and challenges
Liao, X., Vasilakos, A. V., & Yong He, A. (2017) · Neuroscience & Biobehavioral Reviews · doi:10.1016/j.neubiorev.2017.03.018 · Cited by 443
Alzheimer's disease: connecting findings from graph theoretical studies of brain networks
Tijms, B. M., Wink, A. M., de Haan, W., van der Flier, W. M., Stam, C. J., Scheltens, P., & Barkhof, F. (2013) · Neurobiology of Aging · doi:10.1016/j.neurobiolaging.2013.02.020 · Cited by 416
Baronchelli, A., Ferrer‐i‐Cancho, R., Pastor‐Satorras, R., Chater, N., & Christiansen, M. H. (2013) · Trends in Cognitive Sciences · doi:10.1016/j.tics.2013.04.010 · Cited by 360
Vestibular processing during natural self-motion: implications for perception and action
Cullen, K. E. (2019) · Nature reviews. Neuroscience · doi:10.1038/s41583-019-0153-1 · Cited by 357
Metadata
- Authors
- Zhao, X., Liu, Y., Wang, X., Liu, B., Xi, Q., Guo, Q., Jiang, H., Jiang, T., & Wang, P.
- Affiliations
- Tongji University (CN)
- Chinese Academy of Sciences (CN)
- Shanghai Medical College of Fudan University (CN)
- University of Electronic Science and Technology of China (CN)
- Corresponding author
- Jiang, Tianzi
- Wang, Peijun
- Venue
- PLoS ONE
- Publisher
- Public Library of Science (PLoS)
- Published
- 2012-03-23
- Volume
- 7
- Issue
- 3
- Pages
- e33540
- ISSN
- 1932-6203 (ISSN-L)
- PMC
- PMC3311642
- OpenAlex
- W2003131754
- Cited by
- 215
- References
- 95
- Citations by year
- 2026: 6 · 2025: 5 · 2024: 9 · 2023: 9 · 2022: 9 · 2021: 24 · 2020: 16 · 2019: 17 · 2018: 24 · 2017: 21 · 2016: 21 · 2015: 19 · 2014: 16 · 2013: 16 · 2012: 3
- FWCI
- 8.85
- Type
- journal article
- Language
- en
- Open access
- gold
- doi.org
- Locations
- PLoS ONE (publishedVersion, cc-by)
- PubMed Central (publishedVersion, cc-by)
- PubMed (publishedVersion)
- DOAJ (DOAJ: Directory of Open Access Journals) (submittedVersion, cc-by-sa)
- Figshare (submittedVersion, cc-by)
- Funders
- National Natural Science Foundation of China (30770615, 30970818, 863 Program, 60831004, 2011CBA00408, 30970770)
- National High-tech Research and Development Program
- Topics
- Life Sciences › Neuroscience › Cognitive Neuroscience › Functional Brain Connectivity Studies
- Health Sciences › Medicine › Psychiatry and Mental health › Dementia and Cognitive Impairment Research
- Physical Sciences › Physics and Astronomy › Statistical and Nonlinear Physics › Complex Network Analysis Techniques
- Keywords
- Alzheimer's disease, small-world networks, functional brain networks, network topology, local efficiency, global efficiency, default mode network, temporal lobe, subcortical structures, APOE genotype, resting-state fMRI
- MeSH terms
- Aged, Alzheimer Disease, Apolipoproteins E, Brain, Female, Genotype, Humans, Magnetic Resonance Imaging, Male, Middle Aged, Case-Control Studies
About these checks
Registry, retraction, Cites and statistics results are computed, not judged, with one exception: a printed reference that no index lists is read once by a model before it counts as a citation error. Claims are extracted by a model and kept only when their quote appears verbatim in the text; each cited source is then checked, with a model’s help, for whether it says what the claim relies on. Those verdicts can be wrong — read the claim’s quote and the cited source before relying on one.
Statistics and arithmetic are recomputed, not judged.
Confidence bands are shown only for fields calibrated on our annotated test set. None is calibrated yet, so no band is shown.
What counts as a claim ›How we measure confidence ›How we check this ›
Are you an author, or do you see a problem with this page? Request a review
