

Making Robust Policy Decisions Using Global Biodiversity Indicators
Open accessThe DOI matches its Crossref record; 68 of the 70 references it cites were found in a registry or an index.
Abstract
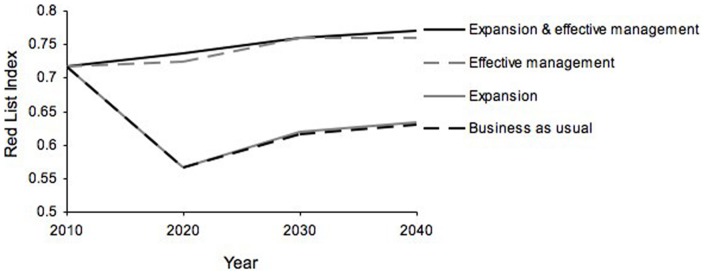
In order to influence global policy effectively, conservation scientists need to be able to provide robust predictions of the impact of alternative policies on biodiversity and measure progress towards goals using reliable indicators. We present a framework for using biodiversity indicators predictively to inform policy choices at a global level. The approach is illustrated with two case studies in which we project forwards the impacts of feasible policies on trends in biodiversity and in relevant indicators. The policies are based on targets agreed at the Convention on Biological Diversity (CBD) meeting in Nagoya in October 2010. The first case study compares protected area policies for African mammals, assessed using the Red List Index; the second example uses the Living Planet Index to assess the impact of a complete halt, versus a reduction, in bottom trawling. In the protected areas example, we find that the indicator can aid in decision-making because it is able to differentiate between the impacts of the different policies. In the bottom trawling example, the indicator exhibits some counter-intuitive behaviour, due to over-representation of some taxonomic and functional groups in the indicator, and contrasting impacts of the policies on different groups caused by trophic interactions. Our results support the need for further research on how to use predictive models and indicators to credibly track trends and inform policy. To be useful and relevant, scientists must make testable predictions about the impact of global policy on biodiversity to ensure that targets such as those set at Nagoya catalyse effective and measurable change.
Overview
The claims and statistics of this paper haven’t been checked yet.
Free: it reads the open-access text and checks the first 5 claims that cite a source we can check. Create a free account to check every claim.
Integrity signals
Registry
Cites
Statistics
Figures

Verification
Claims the paper makes
The claims and statistics of this paper haven’t been checked yet.
Free: it reads the open-access text and checks the first 5 claims that cite a source we can check. Create a free account to check every claim.
Claims other papers make about this one
Each is checked against this paper’s own text: does it say what the citing paper says it does?
The cited source says what the claim attributes to it.
In the citing paper
“Furthermore, the performance of biodiversity indicators such as the LPI can be compromised by the presence of bias in the data and limited in effectiveness as tools in measuring progress towards specific policy targets [1,14].”
From The Diversity-Weighted Living Planet Index: Controlling for Taxonomic Bias in a Global Biodiversity Indicator (2017) · cites this paper as [14]
Self-check
Percentages, sums and reported differences re-computed from the paper’s own numbers.
The self-check needs the paper’s full text.
Citations
Cites
Global Biodiversity: Indicators of Recent Declines
Butchart, S. H. M., Walpole, M., Collen, B., van Strien, A., Scharlemann, J. P. W., Almond, R. E. A., Baillie, J. E. M., Bomhard, B., Brown, C., Bruno, J., et al. (2010) · Science · doi:10.1126/science.1187512 · Cited by 4,892
Self-citationAdaptive Management of Renewable Resources.
Rutherford, A. A., & Walters, C. (1987) · Biometrics · doi:10.2307/2531565 · Cited by 3,308
Scenarios for Global Biodiversity in the 21st Century
Pereira, H. M., Leadley, P. W., Proença, V., Alkemade, R., Scharlemann, J. P. W., Fernandez-Manjarrés, J. F., Araújo, M. B., Balvanera, P., Biggs, R., Cheung, W. W. L., et al. (2010) · Science · doi:10.1126/science.1196624 · Cited by 2,077
Ecopath with Ecosim: Methods, capabilities and limitations
Christensen, V., & Walters, C. J. (2004) · Ecological Modelling · doi:10.1016/j.ecolmodel.2003.09.003 · Cited by 1,914
Jones, K. E., Bielby, J., Cardillo, M., Fritz, S. A., O'Dell, J., Orme, C. D. L., Safi, K., Sechrest, W., Boakes, E. H., Carbone, C., et al. (2009) · Ecology · doi:10.1890/08-1494.1 · Cited by 1,654
Self-citationMonitoring of biological diversity in space and time
Yoccoz, N. G., Nichols, J. D., & Boulinier, T. (2001) · Trends in Ecology & Evolution · doi:10.1016/s0169-5347(01)02205-4 · Cited by 1,432
Quantification of Extinction Risk: IUCN's System for Classifying Threatened Species
MACE, G. M., COLLAR, N. J., GASTON, K. J., HILTON‐TAYLOR, C., AKÇAKAYA, H. R., LEADER‐WILLIAMS, N., MILNER‐GULLAND, E. J., & STUART, S. N. (2008) · Conservation Biology · doi:10.1111/j.1523-1739.2008.01044.x · Cited by 1,400
Self-citationCollapse and conservation of shark populations in the Northwest Atlantic
Baum, J. K., Myers, R. A., Kehler, D. G., Worm, B., Harley, S. J., & Doherty, P. A. (2003) · Science · doi:10.1126/science.1079777 · Cited by 1,197
Chape, S., Harrison, J., Spalding, M., & Lysenko, I. (2005) · Philosophical Transactions of the Royal Society B: Biological Sciences · doi:10.1098/rstb.2004.1592 · Cited by 1,124
NICHOLS, J., & WILLIAMS, B. (2006) · Trends in Ecology & Evolution · doi:10.1016/j.tree.2006.08.007 · Cited by 1,104
Magurran, A. E., Baillie, S. R., Buckland, S. T., Dick, J. M., Elston, D. A., Scott, E. M., Smith, R. I., Somerfield, P. J., & Watt, A. D. (2010) · Trends in Ecology & Evolution · doi:10.1016/j.tree.2010.06.016 · Cited by 940
Thrush, S. F., & Dayton, P. K. (2002) · Annual Review of Ecology and Systematics · doi:10.1146/annurev.ecolsys.33.010802.150515 · Cited by 779
Secrétariat, C. S. L. D. B. (2010) · Cited by 770
Levin, P. S., Fogarty, M. J., Murawski, S. A., & Fluharty, D. (2009) · PLoS Biology · doi:10.1371/journal.pbio.1000014 · Cited by 716
Large mammal population declines in Africa’s protected areas
Craigie, I. D., Baillie, J. E. M., Balmford, A., Carbone, C., Collen, B., Green, R. E., & Hutton, J. M. (2010) · Biological Conservation · doi:10.1016/j.biocon.2010.06.007 · Cited by 685 · cited 9×
“Trends in mammal abundance in PAs vary greatly by region; for example, declines are greatest in West and Central Africa, with more moderate declines in East Africa, and increasing populations in Southern Africa [18].”
InfluentialSelf-citationWorld Database on Protected Areas (WDPA)
Kingston, N. (2013) · Cited by 658
Optimal Allocation of Resources among Threatened Species: a Project Prioritization Protocol
JOSEPH, L. N., MALONEY, R. F., & POSSINGHAM, H. P. (2009) · Conservation Biology · doi:10.1111/j.1523-1739.2008.01124.x · Cited by 595
Self-citationSerengeti II: Dynamics, management, and conservation of an ecosystem
Leader-Williams, N. (1996) · Trends in Ecology & Evolution · doi:10.1016/0169-5347(96)81103-7 · Cited by 500
Design of operational management strategies for achieving fishery ecosystem objectives
Sainsbury, K. (2000) · ICES Journal of Marine Science · doi:10.1006/jmsc.2000.0737 · Cited by 495
Counterfactual thinking and impact evaluation in environmental policy
Ferraro, P. J. (2009) · New Directions for Evaluation · doi:10.1002/ev.297 · Cited by 482
Cbd (2017) · Cited by 478
Monitoring Change in Vertebrate Abundance: the Living Planet Index
COLLEN, B., LOH, J., WHITMEE, S., McRAE, L., AMIN, R., & BAILLIE, J. E. M. (2009) · Conservation Biology · doi:10.1111/j.1523-1739.2008.01117.x · Cited by 441
Self-citationA framework for selecting a suite of indicators for fisheries management
Rice, J. C., & Rochet, M.-J. (2005) · ICES Journal of Marine Science · doi:10.1016/j.icesjms.2005.01.003 · Cited by 441
Serengeti II: Dynamics, Management and Conservation of an Ecosystem.
Deutsch, J. C., Sinclair, A. R. E., & Arcese, P. (1996) · The Journal of Applied Ecology · doi:10.2307/2404970 · Cited by 439
Towards the global monitoring of biodiversity change
PEREIRA, H., & DAVIDCOOPER, H. (2006) · Trends in Ecology & Evolution · doi:10.1016/j.tree.2005.10.015 · Cited by 432
Which ecological indicators can robustly detect effects of fishing?
FULTON, E., SMITH, A., & PUNT, A. (2005) · ICES Journal of Marine Science · doi:10.1016/j.icesjms.2004.12.012 · Cited by 407
Difficulties in tracking the long-term global trend in tropical forest area
Grainger, A. (2008) · Proceedings of the National Academy of Sciences · doi:10.1073/pnas.0703015105 · Cited by 400
The trophic fingerprint of marine fisheries
Branch, T. A., Watson, R., Fulton, E. A., Jennings, S., McGilliard, C. R., Pablico, G. T., Ricard, D., & Tracey, S. R. (2010) · Nature · doi:10.1038/nature09528 · Cited by 362
Improvements to the Red List Index
Butchart, S. H. M., Resit Akçakaya, H., Chanson, J., Baillie, J. E. M., Collen, B., Quader, S., Turner, W. R., Amin, R., Stuart, S. N., & Hilton-Taylor, C. (2007) · PLoS ONE · doi:10.1371/journal.pone.0000140 · Cited by 354
Self-citationConserving Africa’s rain forests: problems in protected areas and possible solutions
Struhsaker, T. T., Struhsaker, P. J., & Siex, K. S. (2005) · Biological Conservation · doi:10.1016/j.biocon.2004.10.007 · Cited by 326
The Biodiversity and Ecosystem Services Science-Policy Interface
Perrings, C., Duraiappah, A., Larigauderie, A., & Mooney, H. (2011) · Science · doi:10.1126/science.1202400 · Cited by 296
Uncertainty and adaptive management for biodiversity conservation
Keith, D. A., Martin, T. G., McDonald-Madden, E., & Walters, C. (2011) · Biological Conservation · doi:10.1016/j.biocon.2010.11.022 · Cited by 263
Ten common mistakes in designing biodiversity indicators for forest policy
Failing, L., & Gregory, R. (2003) · Journal of Environmental Management · doi:10.1016/s0301-4797(03)00014-8 · Cited by 237
Leadley, P., Pereira, H. M., Alkemade, R., Fernández-Manjarrés, J. F., Proença, V. M., Scharlemann, J. P. W., & Walpole, M. J. (2010) · Secretariat of the Convention on Biological Diversity eBooks · Cited by 234
Tracking Progress Toward the 2010 Biodiversity Target and Beyond
Walpole, M., Almond, R. E. A., Besançon, C., Butchart, S. H. M., Campbell-Lendrum, D., Carr, G. M., Collen, B., Collette, L., Davidson, N. C., Dulloo, E., et al. (2009) · Science · doi:10.1126/science.1175466 · Cited by 230
Self-citationLarigauderie, A., & Mooney, H. A. (2010) · Current Opinion in Environmental Sustainability · doi:10.1016/j.cosust.2010.02.006 · Cited by 221
Perrings, C., Naeem, S., Ahrestani, F., Bunker, D. E., Burkill, P., Canziani, G., Elmqvist, T., Ferrati, R., Fuhrman, J., Jaksic, F., et al. (2010) · Science · doi:10.1126/science.1196431 · Cited by 213
Scholes, B. (2010) · Secretariat of the Convention on Biological Diversity eBooks · Cited by 207
Using conceptual models as a planning and evaluation tool in conservation
Margoluis, R., Stem, C., Salafsky, N., & Brown, M. (2009) · Evaluation and Program Planning · doi:10.1016/j.evalprogplan.2008.09.007 · Cited by 184 · cited 2×
“Evidence-based modelling, both predictive (using scenarios and counterfactuals) and retrospective (using statistical models), allows different processes and causal relationships to be understood [32,55,56] and is essential to improving the value of biodiversity indicators for decision-making.”
Trophic flows in the southern Benguela during the 1980s and 1990s
Shannon, L. J., Moloney, C. L., Jarre, A., & Field, J. G. (2003) · Journal of Marine Systems · doi:10.1016/s0924-7963(02)00250-6 · Cited by 183
Management of populations in conservation, harvesting and control
Shea, K., & the NCEAS Working Group on Population Management (1998) · Trends in Ecology & Evolution · doi:10.1016/s0169-5347(98)01381-0 · Cited by 180
Shin, Y.-J., Shannon, L. J., Bundy, A., Coll, M., Aydin, K., Bez, N., Blanchard, J. L., Borges, M. D. F., Diallo, I., Diaz, E., et al. (2010) · ICES Journal of Marine Science · doi:10.1093/icesjms/fsp294 · Cited by 177
Self-citationBiodiversity targets after 2010
Mace, G. M., Cramer, W., Díaz, S., Faith, D. P., Larigauderie, A., Le Prestre, P., Palmer, M., Perrings, C., Scholes, R. J., Walpole, M., et al. (2010) · Current Opinion in Environmental Sustainability · doi:10.1016/j.cosust.2010.03.003 · Cited by 175
Reference points and reference directions for size-based indicators of community structure
Jennings, S., & Dulvy, N. K. (2005) · ICES Journal of Marine Science · doi:10.1016/j.icesjms.2004.07.030 · Cited by 168
Preventing the collapse of the Baltic cod stock through an ecosystem-based management approach
Lindegren, M., Möllmann, C., Nielsen, A., & Stenseth, N. C. (2009) · Proceedings of the National Academy of Sciences · doi:10.1073/pnas.0906620106 · Cited by 164
The Why, What, and How of Global Biodiversity Indicators Beyond the 2010 Target
JONES, J. P. G., COLLEN, B., ATKINSON, G., BAXTER, P. W. J., BUBB, P., ILLIAN, J. B., KATZNER, T. E., KEANE, A., LOH, J., MCDONALD‐MADDEN, E., et al. (2011) · Conservation Biology · doi:10.1111/j.1523-1739.2010.01605.x · Cited by 151
Self-citationDensities of mammals in partially protected areas: the Katavi ecosystem of western Tanzania
Caro, T. M. (1999) · Journal of Applied Ecology · doi:10.1046/j.1365-2664.1999.00392.x · Cited by 141
GREEN, R. E., BALMFORD, A., CRANE, P. R., MACE, G. M., REYNOLDS, J. D., & TURNER, R. K. (2005) · Conservation Biology · doi:10.1111/j.1523-1739.2005.00289.x · Cited by 138
Setsaas, T. H., Holmern, T., Mwakalebe, G., Stokke, S., & Røskaft, E. (2007) · Biological Conservation · doi:10.1016/j.biocon.2007.01.001 · Cited by 128
Habitat Suitability Models and the Shortfall in Conservation Planning for African Vertebrates
RONDININI, C., STUART, S., & BOITANI, L. (2005) · Conservation Biology · doi:10.1111/j.1523-1739.2005.00204.x · Cited by 123
Global biodiversity monitoring
Pereira, H. M., Belnap, J., Brummitt, N. A., Collen, B., Ding, H., González‐Espinosa, M., Gregory, R. D., Honrado, J. P., Jongman, R. H. G., Julliard, R., et al. (2010) · Frontiers in Ecology and the Environment · doi:10.1890/10.wb.23 · Cited by 107
Self-citationTrophic network model of the Northern Adriatic Sea: Analysis of an exploited and eutrophic ecosystem
Barausse, A., Duci, A., Mazzoldi, C., Artioli, Y., & Palmeri, L. (2009) · Estuarine Coastal and Shelf Science · doi:10.1016/j.ecss.2009.05.003 · Cited by 97
Self-citationLinked indicator sets for addressing biodiversity loss
Sparks, T. H., Butchart, S. H. M., Balmford, A., Bennun, L., Stanwell-Smith, D., Walpole, M., Bates, N. R., Bomhard, B., Buchanan, G. M., Chenery, A. M., et al. (2011) · Oryx · doi:10.1017/s003060531100024x · Cited by 90
Self-citationFlows of biomass and structure in an exploited benthic ecosystem in the gulf of California, Mexico
Arreguín-Sánchez, F., Arcos, E., & Chávez, E. A. (2002) · Ecological Modelling · doi:10.1016/s0304-3800(02)00159-x · Cited by 86
Simulating community effects of sea floor shading by plankton blooms over the West Florida Shelf
Okey, T. A. (2003) · Ecological Modelling · doi:10.1016/j.ecolmodel.2003.09.015 · Cited by 85
Do changes in environmental and fishing pressures impact marine communities? An empirical assessment
Rochet, M.-J., Trenkel, V. M., Carpentier, A., Coppin, F., de Sola, L. G., Léauté, J., Mahé, J.-C., Maiorano, P., Mannini, A., Murenu, M., et al. (2010) · Journal of Applied Ecology · doi:10.1111/j.1365-2664.2010.01841.x · Cited by 75
Trophic controls of jellyfish blooms and links with fisheries in the East China Sea
Jiang, H. T., Cheng, H., Xu, H., Arreguín-Sánchez, F., Zetina-Rejón, M. J., del Monte‐Luna, P., & Quesne, W. J. F. L. (2008) · Ecological Modelling · doi:10.1016/j.ecolmodel.2007.10.048 · Cited by 68
Larigauderie, A., & Mooney, H. A. (2010) · Current Opinion in Environmental Sustainability · doi:10.1016/j.cosust.2010.04.001 · Cited by 67
Ecosystem approach to fisheries management in the northern Benguela: the Namibian experience
Roux, J.-P., & Shannon, L. J. (2004) · African Journal of Marine Science · doi:10.2989/18142320409504051 · Cited by 67
Integrating fisheries approaches and household utility models for improved resource management
Milner‐Gulland, E. J. (2011) · Proceedings of the National Academy of Sciences · doi:10.1073/pnas.1010533108 · Cited by 57
Self-citationPiet, G. J., & Rice, J. C. (2004) · ICES Journal of Marine Science · doi:10.1016/j.icesjms.2004.08.009 · Cited by 57
Chee, Y. E., & Wintle, B. A. (2010) · Journal of Applied Ecology · doi:10.1111/j.1365-2664.2010.01877.x · Cited by 54
Ecosystem-based global fishing policy scenarios
Alder, J., Guénette, S., Beblow, J., Cheung, W. W. L., & Christensen, V. (2012) · Open Collections · doi:10.14288/1.0074764 · Cited by 20
Ecosystem models of the Western and Central Aleutian Islands in 1963, 1979 and 1991.
Heymans, S. (2005) · Cited by 12
(2008) · WORLD SCIENTIFIC eBooks · doi:10.1142/9789812790828_0013 · Cited by 3
Global Biodiversity Indicators: scenario modelling for fisheries policy
Sullivan, K. (2010) · Cited by 2
Self-citationEcosystem modelling of the great barrier reef: A balanced trophic biomass approach
Gribble, N. (2005) · Queensland Department of Agriculture and Fisheries archive of scientific and research publications (Queensland Department of Agriculture and Fisheries) · Cited by 2
Research works printed but not linked: 4
- CoP10 2010 Conference Of The Parties To The Convention On Biological Diversity: Updating And Revision Of The Strategic Plan For The Post-2010 Period, Nagoya, Japan, 18–29 October. Nagoya, Japan: Convention On Biological Diversity
- CoP10 2010 Conference Of The Parties To The Convention On Biological Diversity: Revised And Updated Strategic Plan: Technical Rationale And Suggested Milestones And Indicators UNEP/CBD/COP/10/9. Nagoya, Japan: Convention On Biological Diversity
- IUCN 2001 IUCN Red List Categories and Criteria: Version 3.1. Gland, Switzerland and Cambridge, U.K.: IUCN Species Survival Commission
- Cruz-Escalona VH 2005 Interdependencia ecotrófica entre la laguna de Alvarado, Veracruz y la plataforma continental adyacente. Tesis de Doctorado (PhD thesis). La Paz, Baja California Sur, Mexico: Centro interdisciplinario de Ciencias Marinas del IPN
Cited by
Reliable, verifiable and efficient monitoring of biodiversity via metabarcoding
Ji, Y., Ashton, L., Pedley, S. M., Edwards, D. P., Tang, Y., Nakamura, A., Kitching, R., Dolman, P. M., Woodcock, P., Edwards, F. A., et al. (2013) · Ecology Letters · doi:10.1111/ele.12162 · Cited by 662
Visconti, P., Bakkenes, M., Baisero, D., Brooks, T., Butchart, S. H. M., Joppa, L., Alkemade, R., Di Marco, M., Santini, L., Hoffmann, M., et al. (2016) · Conservation Letters · doi:10.1111/conl.12159 · Cited by 283
McRae, L., Deinet, S., & Freeman, R. (2017) · PLOS ONE · doi:10.1371/journal.pone.0169156 · Cited by 236
Self-citationHow to value biodiversity in environmental management?
Laurila-Pant, M., Lehikoinen, A., Uusitalo, L., & Venesjärvi, R. (2015) · Ecological Indicators · doi:10.1016/j.ecolind.2015.02.034 · Cited by 213
Using conservation science to advance corporate biodiversity accountability
Addison, P. F. E., Bull, J. W., & Milner‐Gulland, E. J. (2019) · Conservation Biology · doi:10.1111/cobi.13190 · Cited by 207
Self-citation
Metadata
- Authors
- Nicholson, E., Collen, B., Barausse, A., Blanchard, J. L., Costelloe, B. T., Sullivan, K. M. E., Underwood, F. M., Burn, R. W., Fritz, S., Jones, J. P. G., McRae, L., Possingham, H. P., & Milner-Gulland, E. J.
- Affiliations
- The University of Melbourne (AU)
- Zoological Society of London (GB)
- University of Padua (IT)
- Imperial College London (GB)
- University of Reading (GB)
- International Institute for Applied Systems Analysis (AT)
- Bangor University (GB)
- The University of Queensland (AU)
- Corresponding author
- Nicholson, Emily
- ORCID
- Venue
- PLoS ONE
- Publisher
- Public Library of Science (PLoS)
- Published
- 2012-07-18
- Volume
- 7
- Issue
- 7
- Pages
- e41128
- ISSN
- 1932-6203 (ISSN-L)
- PMC
- PMC3399804
- OpenAlex
- W1968283375
- Cited by
- 128
- References
- 70
- Citations by year
- 2026: 5 · 2025: 9 · 2024: 8 · 2023: 2 · 2022: 9 · 2021: 8 · 2020: 14 · 2019: 8 · 2018: 11 · 2017: 14 · 2016: 16 · 2015: 9 · 2014: 7 · 2013: 8
- FWCI
- 6.36
- Type
- journal article
- Language
- en
- Open access
- gold
- doi.org
- Locations
- PLoS ONE (publishedVersion, cc-by)
- Europe PMC (PubMed Central) (publishedVersion, cc-by)
- PubMed Central (publishedVersion, cc-by)
- PubMed (publishedVersion)
- CentAUR (University of Reading) (acceptedVersion)
- White Rose Research Online (University of Leeds, The University of Sheffield, University of York) (acceptedVersion)
- IIASA PURE (International Institute of Applied Systems Analysis) (acceptedVersion)
- Minerva Access (University of Melbourne) (submittedVersion, cc-by)
- Padua Research Archive (University of Padova) (submittedVersion, cc-by)
- eCite Digital Repository (University of Tasmania) (submittedVersion, cc-by)
- DOAJ (DOAJ: Directory of Open Access Journals) (submittedVersion, cc-by-sa)
- UCL Discovery (University College London) (submittedVersion)
- Figshare (submittedVersion, cc-by)
- Funders
- Rufford Foundation
- Centre of Excellence for Environmental Decisions, Australian Research Council
- Imperial College London
- University of Melbourne
- WWF International
- Natural Environment Research Council
- Australian Research Council
- Topics
- Physical Sciences › Environmental Science › Global and Planetary Change › Conservation, Biodiversity, and Resource Management
- Physical Sciences › Environmental Science › Nature and Landscape Conservation › Ecology and Vegetation Dynamics Studies
- Physical Sciences › Environmental Science › Management, Monitoring, Policy and Law › Sustainable Development and Environmental Policy
- Keywords
- biodiversity indicators, protected area policy, Red List Index, Living Planet Index, African mammals, bottom trawling, fisheries impacts, biodiversity policy, trophic interactions
- MeSH terms
- Africa, Animals, Conservation of Natural Resources, Environment, Humans, International Cooperation, Models, Theoretical, Public Policy, Research, Science, Time Factors, Ecosystem, Biomass, Biodiversity
About these checks
Registry, retraction, Cites and statistics results are computed, not judged, with one exception: a printed reference that no index lists is read once by a model before it counts as a citation error. Claims are extracted by a model and kept only when their quote appears verbatim in the text; each cited source is then checked, with a model’s help, for whether it says what the claim relies on. Those verdicts can be wrong — read the claim’s quote and the cited source before relying on one.
Statistics and arithmetic are recomputed, not judged.
Confidence bands are shown only for fields calibrated on our annotated test set. None is calibrated yet, so no band is shown.
What counts as a claim ›How we measure confidence ›How we check this ›
Are you an author, or do you see a problem with this page? Request a review
Data sources
Bibliographic data: Semantic Scholar, OpenAlex, Crossref.
Contains information from the Semantic Scholar Academic Graph Datasets, made available under the ODC Attribution License (ODC-BY 1.0).
Semantic Scholar’s data is described in: Kinney, R., et al. (2023). The Semantic Scholar Open Data Platform. arXiv:2301.10140.
