Student or educator? Sign up with your school email and get 6 months of Pro free.
Cited by 67

The DOI matches its Crossref record; 42 of the 42 references it cites were found in a registry or an index.

Re-Evaluation of a Bacterial Antifreeze Protein as an Adhesin with Ice-Binding Activity

Guo, Shuaiqi, Garnham, Christopher P., Whitney, John C., Graham, Laurie A., Davies, Peter L.·2012·PLoS ONE

Abstract

A novel role for antifreeze proteins (AFPs) may reside in an exceptionally large 1.5-MDa adhesin isolated from an Antarctic Gram-negative bacterium, Marinomonas primoryensis. MpAFP was purified from bacterial lysates by ice adsorption and gel electrophoresis. We have previously reported that two highly repetitive sequences, region II (RII) and region IV (RIV), divide MpAFP into five distinct regions, all of which require mM Ca(2+) levels for correct folding. Also, the antifreeze activity is confined to the 322-residue RIV, which forms a Ca(2+)-bound beta-helix containing thirteen Repeats-In-Toxin (RTX)-like repeats. RII accounts for approximately 90% of the mass of MpAFP and is made up of ∼120 tandem 104-residue repeats. Because these repeats are identical in DNA sequence, their number was estimated here by pulsed-field gel electrophoresis. Structural homology analysis by the Protein Homology/analogY Recognition Engine (Phyre2) server indicates that the 104-residue RII repeat adopts an immunoglobulin beta-sandwich fold that is typical of many secreted adhesion proteins. Additional RTX-like repeats in RV may serve as a non-cleavable signal sequence for the type I secretion pathway. Immunodetection shows both repeated regions are uniformly distributed over the cell surface. We suggest that the development of an AFP-like domain within this adhesin attached to the bacterial outer surface serves to transiently bind the host bacteria to ice. This association would keep the bacteria within the upper reaches of the water column where oxygen and nutrients are potentially more abundant. This novel envirotactic role would give AFPs a third function, after freeze avoidance and freeze tolerance: that of transiently binding an organism to ice.

Overview

The claims and statistics of this paper haven’t been checked yet.

Run the check — free, no account needed. It reads the open-access text and checks the sources it cites.

A few free checks a day · papers already verified open instantly · results are public

Integrity signals

Registry

Crossref · 10.1371/journal.pone.0048805

Cites

42 of 42 references verified0 citation errors · 0 not checkable

Statistics

Figures

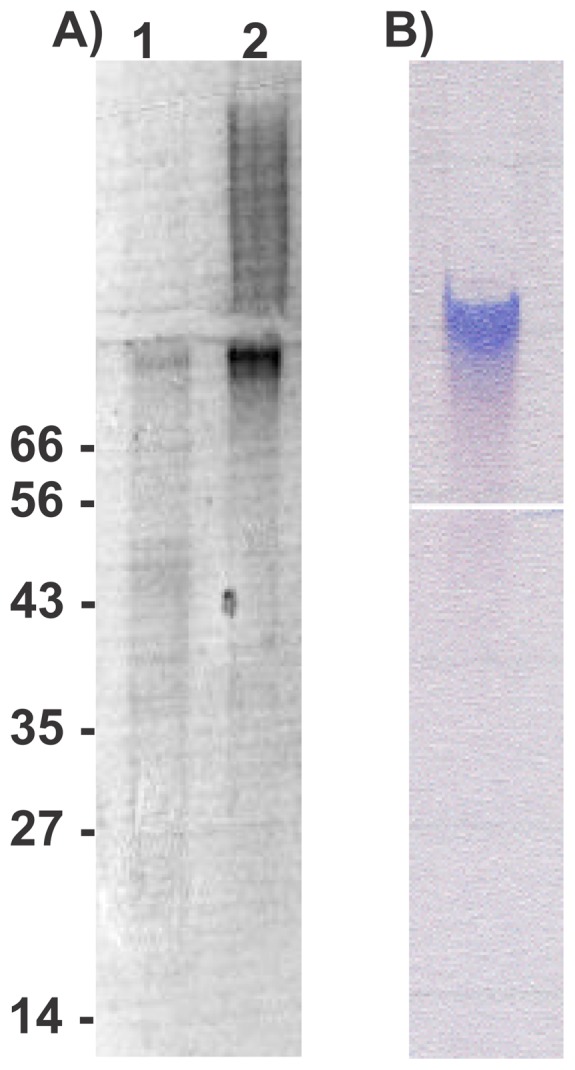
Figure 1 Polyacrylamide gel electrophoresis of MpAFP-enriched fractions. (A) The ice-bound fractions from one (lane 1) and two (lane 2) cycles of ice affinity purification were subjected to SDS-PAGE and stained with Coomassie blue. MpAFP barely entered the resolving section of the gel. The locations of molecular mass markers (kDa) are indicated on the left. A right-pointing arrow indicates the junction between the stacking and resolving. (B) The ice-bound fraction from the second cycle of ice affinity purification was electrophoresed on a non-denaturing gel and stained with Stains-all. MpAFP was still present within the stacking section of the gel when the bromophenol blue marker had reached the bottom of the separating gel. A left-pointing arrow indicates the junction between the stacking and resolving gels.
Figure 1 Polyacrylamide gel electrophoresis of MpAFP-enriched fractions. (A) The ice-bound fractions from one (lane 1) and two (lane 2) cycles of ice affinity purification were subjected to SDS-PAGE and stained with Coomassie blue. MpAFP barely entered the resolving section of the gel. The locations of molecular mass markers (kDa) are indicated on the left. A right-pointing arrow indicates the junction between the stacking and resolving. (B) The ice-bound fraction from the second cycle of ice affinity purification was electrophoresed on a non-denaturing gel and stained with Stains-all. MpAFP was still present within the stacking section of the gel when the bromophenol blue marker had reached the bottom of the separating gel. A left-pointing arrow indicates the junction between the stacking and resolving gels.CC BY · PubMed Central
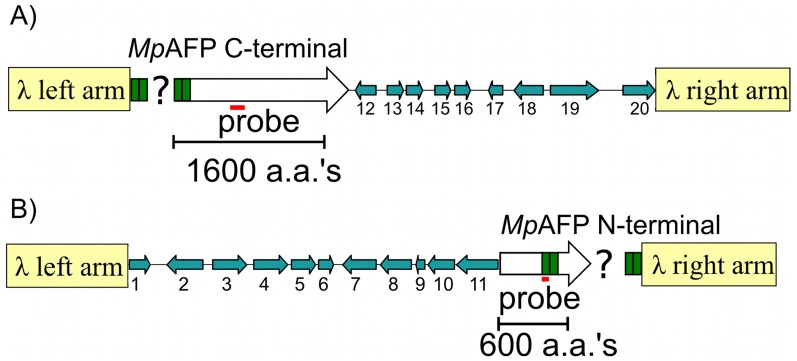
Figure 2 Lambda library clones encoding MpAFP. (A) Schematic layout of the lambda clone containing DNA coding for the C-terminal portion of MpAFP and nine downstream genes, 12–20. The flanking genes (blue arrows) are identified by their numbers in Table S2. The arrows point in the direction of transcription. The left and right arms of lambda phage (not to scale) are indicted by the tan-colored rectangles. Green boxes represent the tandem, identical 312-bp repeats of MpAFP. The question mark represents the unknown number of these repeats present within the clone. The location of the initial hybridization probe is indicated by the horizontal red line. The scale is indicated by the bracket representing DNA coding for 1600 amino acids (aa's). (B) Schematic layout of a second lambda clone that contains DNA coding for the N-terminal portion of MpAFP and eleven upstream genes (1–11). Symbols are as described in (A), with the bracket representing DNA coding for 600 amino acids and the red bar indicates the location of the second hybridization probe.
Figure 2 Lambda library clones encoding MpAFP. (A) Schematic layout of the lambda clone containing DNA coding for the C-terminal portion of MpAFP and nine downstream genes, 12–20. The flanking genes (blue arrows) are identified by their numbers in Table S2. The arrows point in the direction of transcription. The left and right arms of lambda phage (not to scale) are indicted by the tan-colored rectangles. Green boxes represent the tandem, identical 312-bp repeats of MpAFP. The question mark represents the unknown number of these repeats present within the clone. The location of the initial hybridization probe is indicated by the horizontal red line. The scale is indicated by the bracket representing DNA coding for 1600 amino acids (aa's). (B) Schematic layout of a second lambda clone that contains DNA coding for the N-terminal portion of MpAFP and eleven upstream genes (1–11). Symbols are as described in (A), with the bracket representing DNA coding for 600 amino acids and the red bar indicates the location of the second hybridization probe.CC BY · PubMed Central
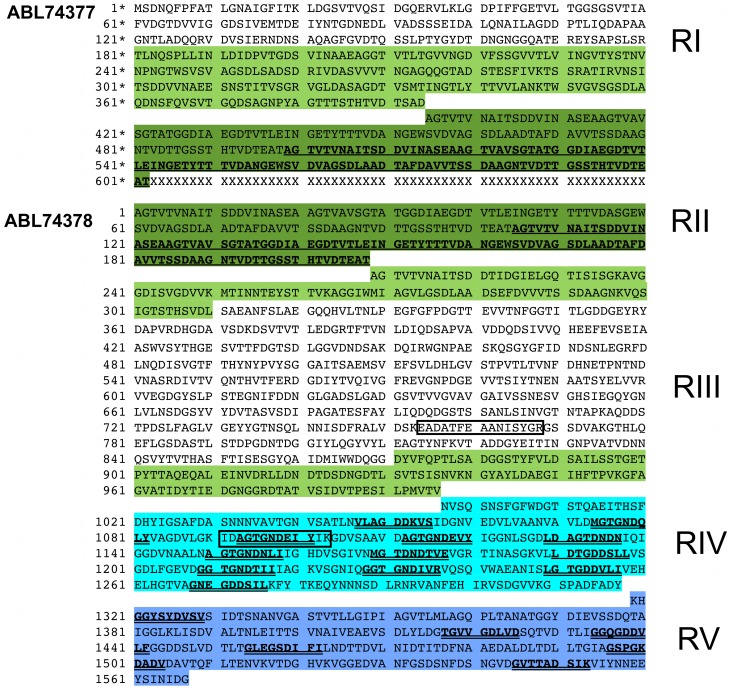
Figure 3 Amino acid sequence of MpAFP. The complete amino acid sequence of MpAFP is divided into five distinct regions (RI–RV). Because it was not possible to sequence through the DNA encoding the highly repetitive RII (∼120 identical 104-aa repeats), the protein was deposited in NCBI with two accession codes: ABL74377 and ABL74378. The two segments of MpAFP are separated by a line of “Xs”. The first segment of MpAFP contains RI and two 104-aa repeats of RII. The residues are identified with asterisks (1*–602*). The second segment begins with two 104-aa repeats of RII and continues through RIII, RIV and RV, with the residues identified by regular numbers (1–1567). The color scheme for the highlighted residues corresponds to that of Fig. 6. The second 104-aa repeat of RII is indicated in bold underlined letters in both segments of MpAFP. The nine-residue RTX-like repeats in RIV and RV are represented by bold double-underlined letters. The boxed sequences EADATFEAANISVGR and IDAGTGNDEIYIK are the two sequenced tryptic peptides identified by tandem MS/MS (Table S1) that were used to design degenerate PCR primers that amplified the first nucleic acid probe used for the isolation of the MpAFP gene.
Figure 3 Amino acid sequence of MpAFP. The complete amino acid sequence of MpAFP is divided into five distinct regions (RI–RV). Because it was not possible to sequence through the DNA encoding the highly repetitive RII (∼120 identical 104-aa repeats), the protein was deposited in NCBI with two accession codes: ABL74377 and ABL74378. The two segments of MpAFP are separated by a line of “Xs”. The first segment of MpAFP contains RI and two 104-aa repeats of RII. The residues are identified with asterisks (1*–602*). The second segment begins with two 104-aa repeats of RII and continues through RIII, RIV and RV, with the residues identified by regular numbers (1–1567). The color scheme for the highlighted residues corresponds to that of Fig. 6. The second 104-aa repeat of RII is indicated in bold underlined letters in both segments of MpAFP. The nine-residue RTX-like repeats in RIV and RV are represented by bold double-underlined letters. The boxed sequences EADATFEAANISVGR and IDAGTGNDEIYIK are the two sequenced tryptic peptides identified by tandem MS/MS (Table S1) that were used to design degenerate PCR primers that amplified the first nucleic acid probe used for the isolation of the MpAFP gene.CC BY · PubMed Central
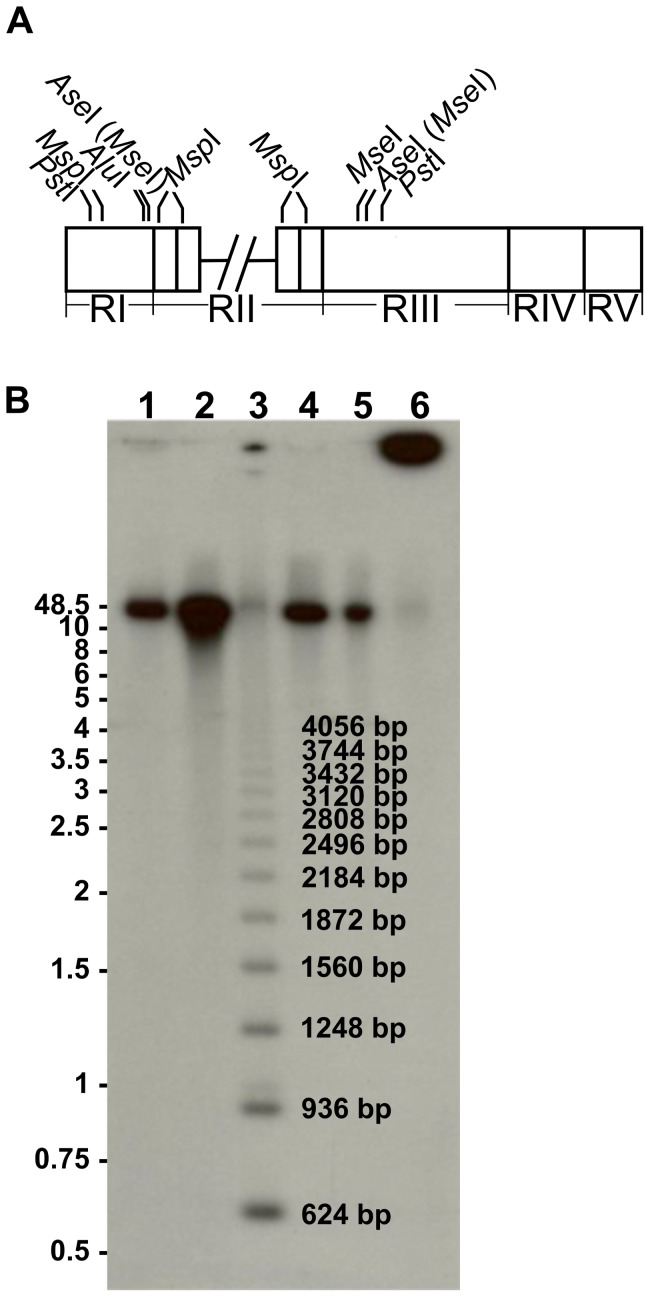
Figure 4 Estimation of 312-bp repeat copy number by Southern blotting. (A) Schematic diagram of the MpAFP coding region illustrating the relative positions of restriction enzyme cut sites. Cross-hatched lines indicate the break between the two segments of MpAFP coding region described in Fig. 3. Four restriction enzymes, including MseI, AseI, PstI and AluI cut only outside the 312-bp repeats. Since the cut site of MseI (T/TAA) is present within that of AseI (AT/TAAT), MseI is indicated in parentheses beside AseI. MspI is the only restriction enzyme in this set that cuts within the 312-bp repeats in RII, and it also cuts once in RI. (B) Southern blot of the digests using a 2×312-bp repeat from RII as the probe. Undigested DNA (lane 6) remained near the well, whereas the four restriction enzymes AluI, PstI, AseI and MseI (lane 1, 2, 4 and 5) that cut outside the repeats produced a fragment of approximately 37,500 bp in length. The MspI (lane 3) partial digest produced a ladder of bands at 312-bp intervals and those containing between 2 (624 bp) and 13 (4056 bp) repeats are marked on this blot. DNA length markers (kb) are indicated on the left of the blot.
Figure 4 Estimation of 312-bp repeat copy number by Southern blotting. (A) Schematic diagram of the MpAFP coding region illustrating the relative positions of restriction enzyme cut sites. Cross-hatched lines indicate the break between the two segments of MpAFP coding region described in Fig. 3. Four restriction enzymes, including MseI, AseI, PstI and AluI cut only outside the 312-bp repeats. Since the cut site of MseI (T/TAA) is present within that of AseI (AT/TAAT), MseI is indicated in parentheses beside AseI. MspI is the only restriction enzyme in this set that cuts within the 312-bp repeats in RII, and it also cuts once in RI. (B) Southern blot of the digests using a 2×312-bp repeat from RII as the probe. Undigested DNA (lane 6) remained near the well, whereas the four restriction enzymes AluI, PstI, AseI and MseI (lane 1, 2, 4 and 5) that cut outside the repeats produced a fragment of approximately 37,500 bp in length. The MspI (lane 3) partial digest produced a ladder of bands at 312-bp intervals and those containing between 2 (624 bp) and 13 (4056 bp) repeats are marked on this blot. DNA length markers (kb) are indicated on the left of the blot.CC BY · PubMed Central
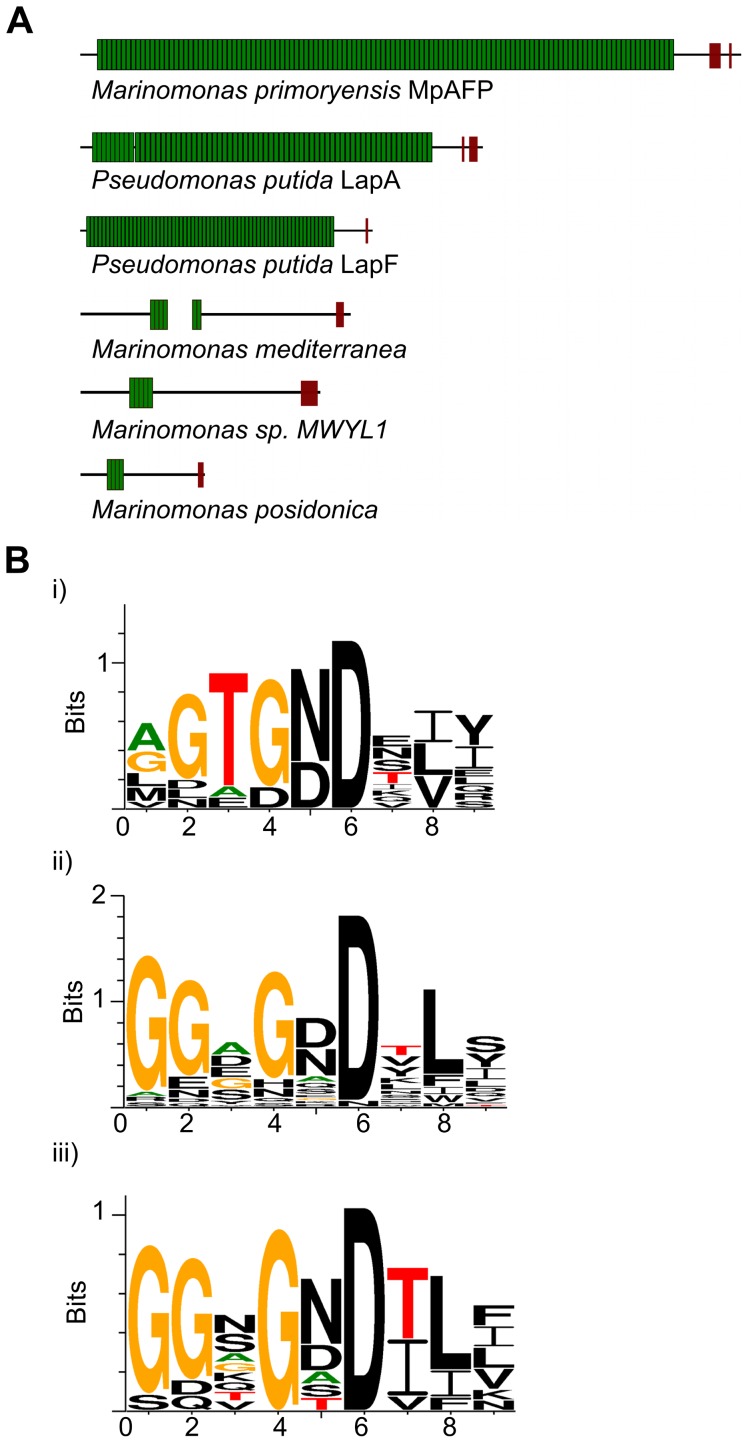
Figure 5 Schematic representations of MpAFP and other large adhesion proteins. (A) Proteins are drawn to scale. Each Ig-like unit of the large repetitive region is shown as a green rectangle. The RTX-repeats in the C-terminal region are illustrated as brown blocks. The schematic diagrams are based on the following sequences from NCBI: Pseudomonas putida KT2440 LapA (NP_742337) and LapF (NP_742967), M. sp. MWYL1 hemolysin-type calcium-binding protein (YP_001340713), M. posidonica outer membrane adhesin-like protein (YP_004481992) and the M. mediterranea homologues (YP_004313542+YP_004313541) that are separated by one nucleotide preceding an irregular GTG start codon. (B) Weblogo representations of 9-aa RTX repeats. Consensus plots are shown for: i) 12 RTX repeats in MpAFP_RIV; ii) 29 RTX repeats from homologs of MpAFP from three other Marinomonas species shown in Fig. 5A; iii) 10 RTX repeats in adhesion proteins LapA and LapF. As shown in the weblogo plots, the RTX repeats from the three homologs of MpAFP and the LAPs follow the consensus of the conventional nine-residue RTX repeats of GGxGxDxUx (Fig. 5Bii and 5Biii). The RTX-like repeats in MpAFP_RIV deviate from the conventional RTX repeats by introducing conserved ice-binding residues at positions 3 and 5 (Thr and Asx, Fig. 5Bi). Residues are colored black except for Gly (orange), Thr (red), and Ala (green).
Figure 5 Schematic representations of MpAFP and other large adhesion proteins. (A) Proteins are drawn to scale. Each Ig-like unit of the large repetitive region is shown as a green rectangle. The RTX-repeats in the C-terminal region are illustrated as brown blocks. The schematic diagrams are based on the following sequences from NCBI: Pseudomonas putida KT2440 LapA (NP_742337) and LapF (NP_742967), M. sp. MWYL1 hemolysin-type calcium-binding protein (YP_001340713), M. posidonica outer membrane adhesin-like protein (YP_004481992) and the M. mediterranea homologues (YP_004313542+YP_004313541) that are separated by one nucleotide preceding an irregular GTG start codon. (B) Weblogo representations of 9-aa RTX repeats. Consensus plots are shown for: i) 12 RTX repeats in MpAFP_RIV; ii) 29 RTX repeats from homologs of MpAFP from three other Marinomonas species shown in Fig. 5A; iii) 10 RTX repeats in adhesion proteins LapA and LapF. As shown in the weblogo plots, the RTX repeats from the three homologs of MpAFP and the LAPs follow the consensus of the conventional nine-residue RTX repeats of GGxGxDxUx (Fig. 5Bii and 5Biii). The RTX-like repeats in MpAFP_RIV deviate from the conventional RTX repeats by introducing conserved ice-binding residues at positions 3 and 5 (Thr and Asx, Fig. 5Bi). Residues are colored black except for Gly (orange), Thr (red), and Ala (green).CC BY · PubMed Central
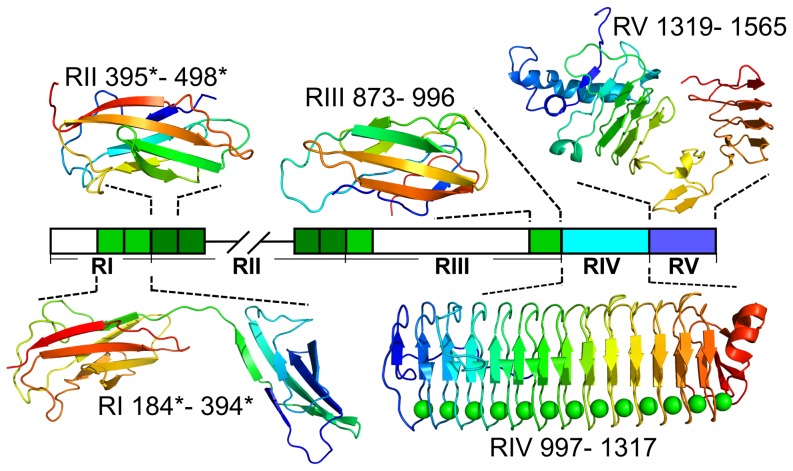
Figure 6 Homology models produced for domains of MpAFP using Phyre2. The linear map of the regions of MpAFP is colored as in Fig. 3. Hatched lines indicate the break between the two contiguously sequenced segments of MpAFP. Uncolored regions could only be modeled ab initio by the Phyre2 server and did not produce reliable results. Colored regions were modeled at greater than 90% confidence and their structures in ribbon representation are shown above and below the map of MpAFP. The X-ray crystal structure of RIV is shown [9]. Residues for each model/structure are numbered according to the sequence in Fig. 3. The protein folds are shown in the colors of the rainbow from the N terminus (blue) to the C terminus (red).
Figure 6 Homology models produced for domains of MpAFP using Phyre2. The linear map of the regions of MpAFP is colored as in Fig. 3. Hatched lines indicate the break between the two contiguously sequenced segments of MpAFP. Uncolored regions could only be modeled ab initio by the Phyre2 server and did not produce reliable results. Colored regions were modeled at greater than 90% confidence and their structures in ribbon representation are shown above and below the map of MpAFP. The X-ray crystal structure of RIV is shown [9]. Residues for each model/structure are numbered according to the sequence in Fig. 3. The protein folds are shown in the colors of the rainbow from the N terminus (blue) to the C terminus (red).CC BY · PubMed Central
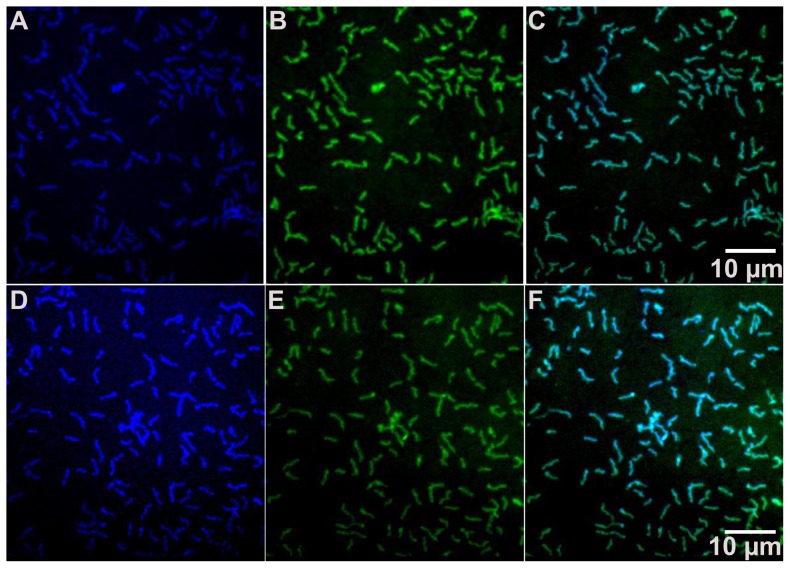
Figure 7 Localization of MpAFP by immunofluorescence. Immobilized M. primoryensis cells were fixed in 1% paraformaldehyde before being incubated with anti-RII (A, B and C) or anti-RIV (D, E and F) polyclonal antibodies, followed by Alexa Fluor 350 - conjugated goat anti-rabbit secondary antibody (blue in A and D) and SYTO 9 (green in B and E). Images (C) and (F) are composite images of (A) and (B), and (D) and (E), respectively. A 10-micron scale marker is shown by the white horizontal line in panels C and F.
Figure 7 Localization of MpAFP by immunofluorescence. Immobilized M. primoryensis cells were fixed in 1% paraformaldehyde before being incubated with anti-RII (A, B and C) or anti-RIV (D, E and F) polyclonal antibodies, followed by Alexa Fluor 350 - conjugated goat anti-rabbit secondary antibody (blue in A and D) and SYTO 9 (green in B and E). Images (C) and (F) are composite images of (A) and (B), and (D) and (E), respectively. A 10-micron scale marker is shown by the white horizontal line in panels C and F.CC BY · PubMed Central

Verification

Claims the paper makes

The claims and statistics of this paper haven’t been checked yet.

Run the check — free, no account needed. It reads the open-access text and checks the sources it cites.

A few free checks a day · papers already verified open instantly · results are public

Claims other papers make about this one

Each is checked against this paper’s own text: does it say what the citing paper says it does?

Self-check

Percentages, sums and reported differences re-computed from the paper’s own numbers.

The self-check needs the paper’s full text.

Citations

Cites

Show all 42 references

Research works printed but not linked: 2

  1. S Orkin, 1990, Molecular-Cloning - a Laboratory Manual, 2nd Edition - Sambrook,J, Fritsch,Ef, Maniatis,T, Nature, 343, 604
  2. JE Hixson, 1990, Short Protocols in Molecular-Biology - Ausubel,Fm, Brent,R, Kingston,Re, Moore,Dd, Seidman,Jg, Smith,Ja, Struhl,K, Wangiverson,P, Bonitz,Sg, Am J Hum Biol, 2, 172

Cited by

Metadata

Authors
Guo, S., Garnham, C. P., Whitney, J. C., Graham, L. A., & Davies, P. L.
Venue
PLoS ONE
Published
2012-11-07
Volume
7
Issue
11
Pages
e48805
ISSN
1932-6203
Cited by
67
References
42
Language
en

About these checks

Registry, retraction, Cites and statistics results are computed, not judged, with one exception: a printed reference that no index lists is read once by a model before it counts as a citation error. Claims are extracted by a model and kept only when their quote appears verbatim in the text; each cited source is then checked, with a model’s help, for whether it says what the claim relies on. Those verdicts can be wrong — read the claim’s quote and the cited source before relying on one.

Statistics and arithmetic are recomputed, not judged.

Confidence bands are shown only for fields calibrated on our annotated test set. None is calibrated yet, so no band is shown.

What counts as a claim ›How we measure confidence ›How we check this ›

Are you an author, or do you see a problem with this page? Request a review

Data sources

Bibliographic data: Semantic Scholar, OpenAlex, Crossref.

Contains information from the Semantic Scholar Academic Graph Datasets, made available under the ODC Attribution License (ODC-BY 1.0).

Semantic Scholar’s data is described in: Kinney, R., et al. (2023). The Semantic Scholar Open Data Platform. arXiv:2301.10140.