Cited by 14

The DOI matches its Crossref record; 4 of the 4 references it cites were found in a registry or an index.

Characterization of Growth Suppressive Functions of a Splice Variant of Cyclin D2

Wafa, Karim, MacLean, Jessica, Zhang, Feixiong, Pasumarthi, Kishore B. S.·2013·PLoS ONE

Overview

The claims and statistics of this paper haven’t been checked yet.

Run the check — free, no account needed. It reads the open-access text and checks the sources it cites.

A few free checks a day · papers already verified open instantly · results are public

Integrity signals

Registry

Crossref · 10.1371/journal.pone.0053503

Cites

4 of 4 references verified0 citation errors · 0 not checkable

Statistics

Figures

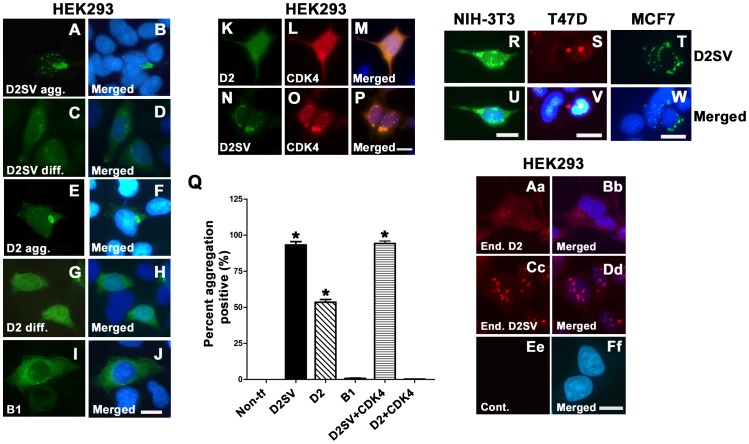
Figure 1 Characterization of cycD2SV aggregation in immortalized cell lines. HEK293 cells transfected with cycD2SVmyc (A–D), cycD2myc (E–H) and cycB1 (I, J) processed for myc (A, C, E, G) and cycB1 (I) immunostaining and nuclear stain (B, D, F, H, J). HEK293 cells co-transfected with cycD2myc and CDK4 (K–M) and cycD2SVmyc and CDK4 (N–P) processed for cycD2SV (K), cycD2 (N) and CDK4 (L, O). NIH-3T3 (R, U), T47D (S, V) and MCF7 (T, W) cells transfected with cycD2SVmyc and processed for myc (R, S, T) immunostaining and nuclear stain (U, V, W). The percentage of HEK293 cells positive for protein aggregation was determined for cycD2SVmyc, cycD2myc, cycB1, cycD2SV plus CDK4 and cycD2 plus CDK4 transfected cells (Q). Cells positive for protein aggregates were quantified and expressed as a percent of total counted cells (Q). Non-transfected (Non-tf) cells stained with myc antibodies were used as a control for protein aggregation. Values are expressed as mean ± SEM. One way ANOVA, *p<0.05 compared to non-transfected control, approximately 1000 cells were counted for each group from three independent experiments (N = 3). Endogenous cycD2 (Aa, Bb) and cycD2SV (Cc, Dd) expression was analyzed in untransfected HEK283 cells. Cells were processed for cycD2 (Aa) and cycD2SV (Cc) immunostaining and nuclear stain (Bb, Dd, and Ff). Primary antibody was omitted as a control (Ee, Ff). Scale bar is 20 µm (A–J; K–P; R, U; S, V; T, W; Aa–Ff).
Figure 1 Characterization of cycD2SV aggregation in immortalized cell lines. HEK293 cells transfected with cycD2SVmyc (A–D), cycD2myc (E–H) and cycB1 (I, J) processed for myc (A, C, E, G) and cycB1 (I) immunostaining and nuclear stain (B, D, F, H, J). HEK293 cells co-transfected with cycD2myc and CDK4 (K–M) and cycD2SVmyc and CDK4 (N–P) processed for cycD2SV (K), cycD2 (N) and CDK4 (L, O). NIH-3T3 (R, U), T47D (S, V) and MCF7 (T, W) cells transfected with cycD2SVmyc and processed for myc (R, S, T) immunostaining and nuclear stain (U, V, W). The percentage of HEK293 cells positive for protein aggregation was determined for cycD2SVmyc, cycD2myc, cycB1, cycD2SV plus CDK4 and cycD2 plus CDK4 transfected cells (Q). Cells positive for protein aggregates were quantified and expressed as a percent of total counted cells (Q). Non-transfected (Non-tf) cells stained with myc antibodies were used as a control for protein aggregation. Values are expressed as mean ± SEM. One way ANOVA, *p<0.05 compared to non-transfected control, approximately 1000 cells were counted for each group from three independent experiments (N = 3). Endogenous cycD2 (Aa, Bb) and cycD2SV (Cc, Dd) expression was analyzed in untransfected HEK283 cells. Cells were processed for cycD2 (Aa) and cycD2SV (Cc) immunostaining and nuclear stain (Bb, Dd, and Ff). Primary antibody was omitted as a control (Ee, Ff). Scale bar is 20 µm (A–J; K–P; R, U; S, V; T, W; Aa–Ff).CC BY · PubMed Central
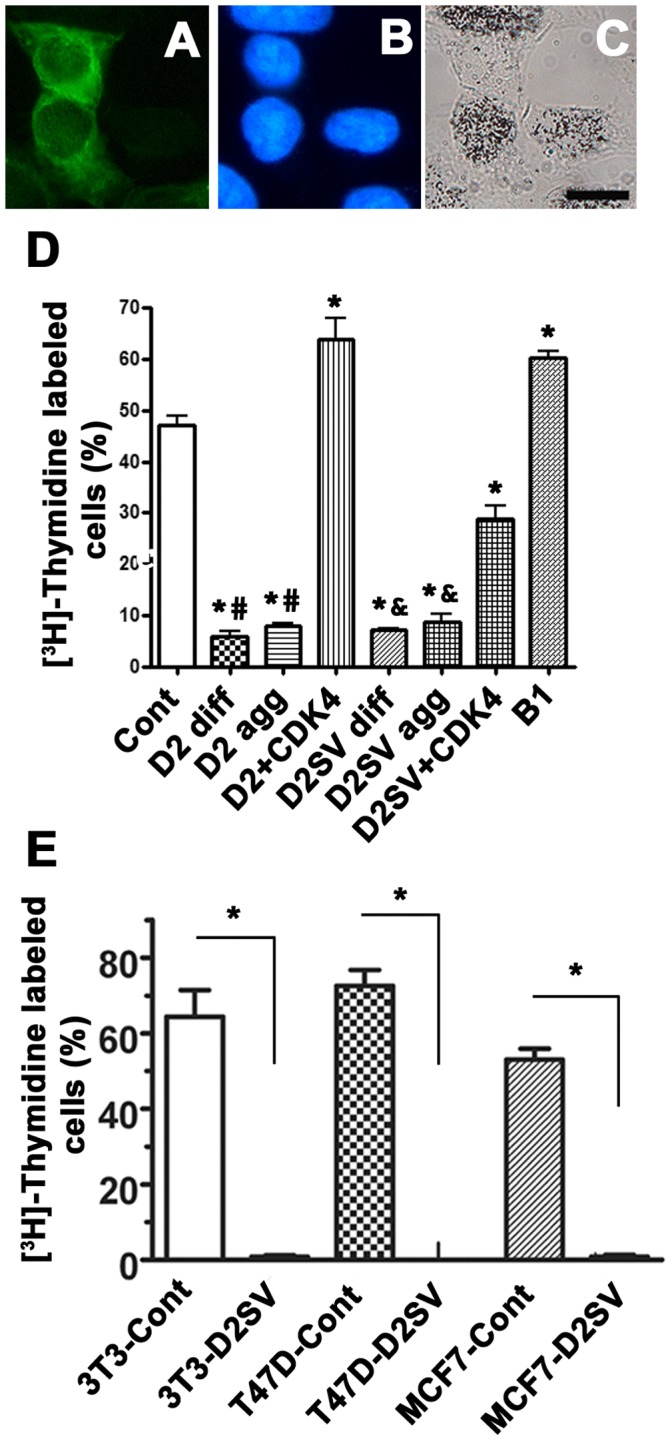
Figure 2 CycD2SV expression decreases the number of cells entering S-phase in immortalized cell lines. Photomicrographs depict examples of [3H]-thymidine labelling assay (A–C). Scale bar is 20 µm. HEK293 cells transfected with cycB1 and labeled with [3H]-thymidine were visualized by cycB1 immunostaining (A), nuclear stain (B) and [3H]-thymidine autoradiography (C). Cells positive for [3H]-thymidine contained nuclear silver grains in the nucleus and were visualized under bright field microscopy (C). HEK293 cells transfected with cycB1, cycD2 or cycD2SV were quantified and [3H]-thymidine positive cells were expressed as a percent of total counted cells (D). [3H]-thymidine counts for cells transfected with cycD2 and cycD2SV were completed for cells with diffused staining (diff.) and those containing protein aggregates (agg.). [3H]-thymidine labeling index was also completed for 3T3-NIH, T47D and MCF7 cells overexpressing cycD2SV (E). pcDNA 3.1 vector transfected cells were used for control (cont). Additionally, [3H]-thymidine labeling index was completed for cycD2 and cycD2SV cells co-transfected with CDK4. Cells were pulsed with [3H]-thymidine for 6hrs (D) or 24 hrs (E). Values are expressed as mean ± SEM. For panel D, statistical analysis was performed using one-way ANOVA; *p<0.05 compared to the LI of control cells, #p<0.05 compared to the LI of cycD2 co-transfected with CDK4 and &p<0.05 compared to the LI of cycD2SV co-transfected with CDK4. For panel E, analysis was performed using unpaired two-tail t-test, *p<0.05 compared to the LI of control cells, approximately 1000 cells were counted for each group from three independent experiments (N = 3).
Figure 2 CycD2SV expression decreases the number of cells entering S-phase in immortalized cell lines. Photomicrographs depict examples of [3H]-thymidine labelling assay (A–C). Scale bar is 20 µm. HEK293 cells transfected with cycB1 and labeled with [3H]-thymidine were visualized by cycB1 immunostaining (A), nuclear stain (B) and [3H]-thymidine autoradiography (C). Cells positive for [3H]-thymidine contained nuclear silver grains in the nucleus and were visualized under bright field microscopy (C). HEK293 cells transfected with cycB1, cycD2 or cycD2SV were quantified and [3H]-thymidine positive cells were expressed as a percent of total counted cells (D). [3H]-thymidine counts for cells transfected with cycD2 and cycD2SV were completed for cells with diffused staining (diff.) and those containing protein aggregates (agg.). [3H]-thymidine labeling index was also completed for 3T3-NIH, T47D and MCF7 cells overexpressing cycD2SV (E). pcDNA 3.1 vector transfected cells were used for control (cont). Additionally, [3H]-thymidine labeling index was completed for cycD2 and cycD2SV cells co-transfected with CDK4. Cells were pulsed with [3H]-thymidine for 6hrs (D) or 24 hrs (E). Values are expressed as mean ± SEM. For panel D, statistical analysis was performed using one-way ANOVA; *p<0.05 compared to the LI of control cells, #p<0.05 compared to the LI of cycD2 co-transfected with CDK4 and &p<0.05 compared to the LI of cycD2SV co-transfected with CDK4. For panel E, analysis was performed using unpaired two-tail t-test, *p<0.05 compared to the LI of control cells, approximately 1000 cells were counted for each group from three independent experiments (N = 3).CC BY · PubMed Central
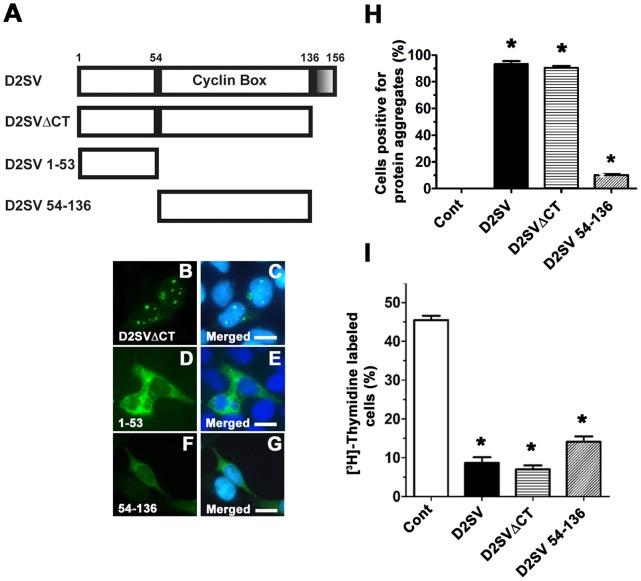
Figure 3 Effects of cycD2SV 54–136 and cycD2SVΔCT overexpression on cell cycle regulation. A schematic representation of D2SVΔCT, D2SV 1–53 and D2SV 54–136 deletions in comparison to full length D2SV (A). Shaded box (136–156 amino acids) in cycD2SV represents the unique CT sequence. HEK293 cells transfected with D2SVΔCTmyc (B, C), D2SV 1–53 (D, E) and D2SV 54–136 myc (F, G) were processed for myc (B, D, F) immunostaining and nuclear stain (C, E, G). Scale bar is 20 µm. HEK293 cells transfected with D2SV, D2SVΔCT and D2SV 54–136 were labeled with [3H]-thymidine and processed for immunostaining and [3H]-thymidine autoradiography. The percentage of cells positive for protein aggregation (H) and [3H]-thymidine (I) were quantified and expressed as a percent of total transfected cells. Cells transfected with pcDNA 3.1 vector were used as a control (cont). Values are expressed as mean ± SEM. One way ANOVA, *p<0.05 compared to control, approximately 1000 cells were counted for each group from three independent experiments (N = 3).
Figure 3 Effects of cycD2SV 54–136 and cycD2SVΔCT overexpression on cell cycle regulation. A schematic representation of D2SVΔCT, D2SV 1–53 and D2SV 54–136 deletions in comparison to full length D2SV (A). Shaded box (136–156 amino acids) in cycD2SV represents the unique CT sequence. HEK293 cells transfected with D2SVΔCTmyc (B, C), D2SV 1–53 (D, E) and D2SV 54–136 myc (F, G) were processed for myc (B, D, F) immunostaining and nuclear stain (C, E, G). Scale bar is 20 µm. HEK293 cells transfected with D2SV, D2SVΔCT and D2SV 54–136 were labeled with [3H]-thymidine and processed for immunostaining and [3H]-thymidine autoradiography. The percentage of cells positive for protein aggregation (H) and [3H]-thymidine (I) were quantified and expressed as a percent of total transfected cells. Cells transfected with pcDNA 3.1 vector were used as a control (cont). Values are expressed as mean ± SEM. One way ANOVA, *p<0.05 compared to control, approximately 1000 cells were counted for each group from three independent experiments (N = 3).CC BY · PubMed Central
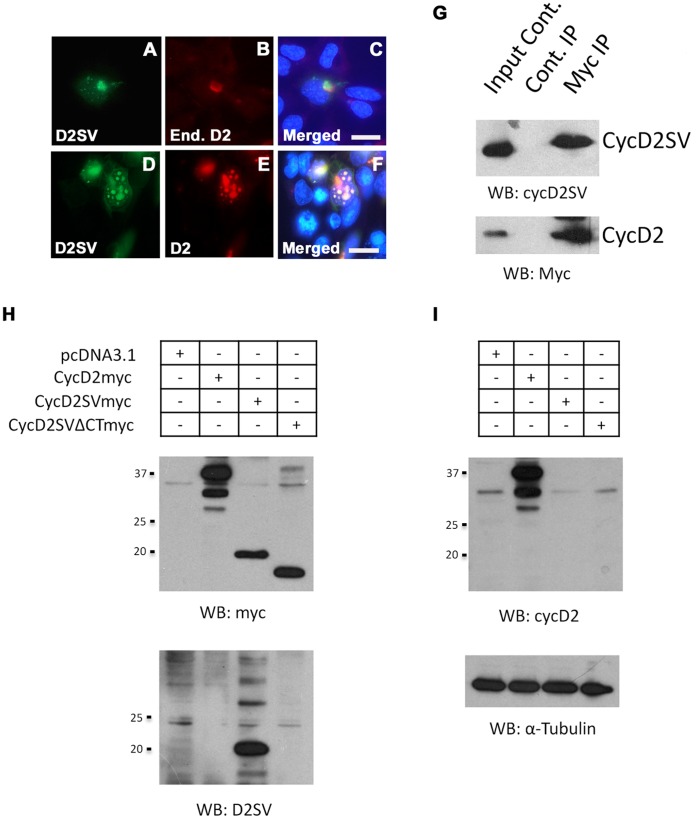
Figure 4 Interaction of cycD2SV with cyclin D2. Overexpressed cycD2SV co-localizes with endogenous and co-transfected cycD2. HEK293 cells transfected with cycD2SVmyc alone (A–C) or co-transfected with cycD2myc (D–F) were processed for myc (A, E), D2SV (D), cycD2 (B) immunostaining and nuclear stain (C, F). Scale bar is 20 µm. Immunoprecipitation analysis of interactions between cycD2SV and cycD2 (G). Western blot (WB) analysis performed on HEK293 cells transfected with pcDNA, cycD2myc, cycD2SVmyc and cycD2SVΔCTmyc using myc and D2SV antibodies (H) as well as cycD2 and α-tubulin antibodies (I). Results in panels H and I indicate the specificity of cycD2SV and cycD2 antibodies and rule out any cross-reactivity.
Figure 4 Interaction of cycD2SV with cyclin D2. Overexpressed cycD2SV co-localizes with endogenous and co-transfected cycD2. HEK293 cells transfected with cycD2SVmyc alone (A–C) or co-transfected with cycD2myc (D–F) were processed for myc (A, E), D2SV (D), cycD2 (B) immunostaining and nuclear stain (C, F). Scale bar is 20 µm. Immunoprecipitation analysis of interactions between cycD2SV and cycD2 (G). Western blot (WB) analysis performed on HEK293 cells transfected with pcDNA, cycD2myc, cycD2SVmyc and cycD2SVΔCTmyc using myc and D2SV antibodies (H) as well as cycD2 and α-tubulin antibodies (I). Results in panels H and I indicate the specificity of cycD2SV and cycD2 antibodies and rule out any cross-reactivity.CC BY · PubMed Central
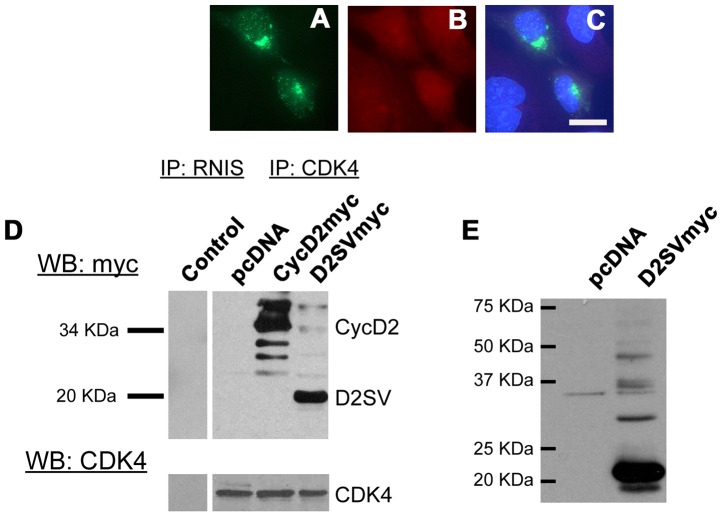
Figure 5 Interaction of cycD2SV with CDK4. HEK293 cells transfected with cycD2SVmyc (A–C) processed for myc (A), CDK4 (B) immunostaining and nuclear stain (C). Interaction of transfected cycD2SV with endogenous CDK4 was determined by CDK4 immunoprecipitation (D). Endogenous CDK4 was immunoprecipitated from pcDNA (negative control), cycD2myc (positive control) and D2SVmyc transfected cells using CDK4 antibodies. An additional immunoprecipitation negative control was completed using rabbit non-immune serum (RNIS, control) on cycD2SVmyc transfected HEK293 cells. Immunoprecipitated samples were resolved by western blot and the nitrocellulose blot was probed with myc and CDK4 antibodies. Western blot analysis of HEK293 cells transfected with pcDNA (control), empty vector, and D2SVmyc using cycD2SV antibodies (E). IP, immunoprecipitation; WB, western blot; End., endogenous.
Figure 5 Interaction of cycD2SV with CDK4. HEK293 cells transfected with cycD2SVmyc (A–C) processed for myc (A), CDK4 (B) immunostaining and nuclear stain (C). Interaction of transfected cycD2SV with endogenous CDK4 was determined by CDK4 immunoprecipitation (D). Endogenous CDK4 was immunoprecipitated from pcDNA (negative control), cycD2myc (positive control) and D2SVmyc transfected cells using CDK4 antibodies. An additional immunoprecipitation negative control was completed using rabbit non-immune serum (RNIS, control) on cycD2SVmyc transfected HEK293 cells. Immunoprecipitated samples were resolved by western blot and the nitrocellulose blot was probed with myc and CDK4 antibodies. Western blot analysis of HEK293 cells transfected with pcDNA (control), empty vector, and D2SVmyc using cycD2SV antibodies (E). IP, immunoprecipitation; WB, western blot; End., endogenous.CC BY · PubMed Central
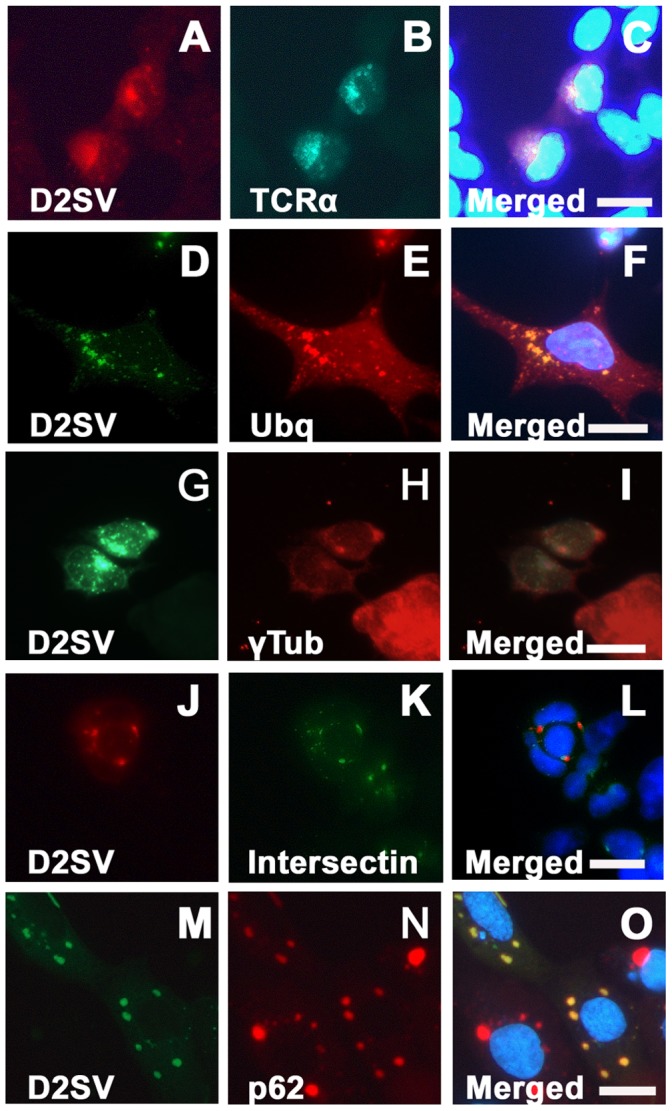
Figure 6 Co-localization of transfected cycD2SV with markers of ER stress and autophagy. HEK293 cells co-transfected with cycD2SVmyc and TCRα-GFP (A–C), cycD2SVmyc and ubiquitin (D–F), cycD2SVmyc and YFP-intersectin (J–L) and cycD2SV-EGFP and mcherry-p62 (M–O) were processed for myc (A, D, G), HA (E) immunostaining and nuclear stain (C, F, I, L). Co-localization of singly transected cycD2SV aggregates in γ-tubulin positive MTOC (G–I). HEK293 cells transfected with cycD2SVmyc (G–I) processed for myc (G), γ-tubulin (H) immunostaining and nuclear stain (E). Scale bar is 20 µm.
Figure 6 Co-localization of transfected cycD2SV with markers of ER stress and autophagy. HEK293 cells co-transfected with cycD2SVmyc and TCRα-GFP (A–C), cycD2SVmyc and ubiquitin (D–F), cycD2SVmyc and YFP-intersectin (J–L) and cycD2SV-EGFP and mcherry-p62 (M–O) were processed for myc (A, D, G), HA (E) immunostaining and nuclear stain (C, F, I, L). Co-localization of singly transected cycD2SV aggregates in γ-tubulin positive MTOC (G–I). HEK293 cells transfected with cycD2SVmyc (G–I) processed for myc (G), γ-tubulin (H) immunostaining and nuclear stain (E). Scale bar is 20 µm.CC BY · PubMed Central
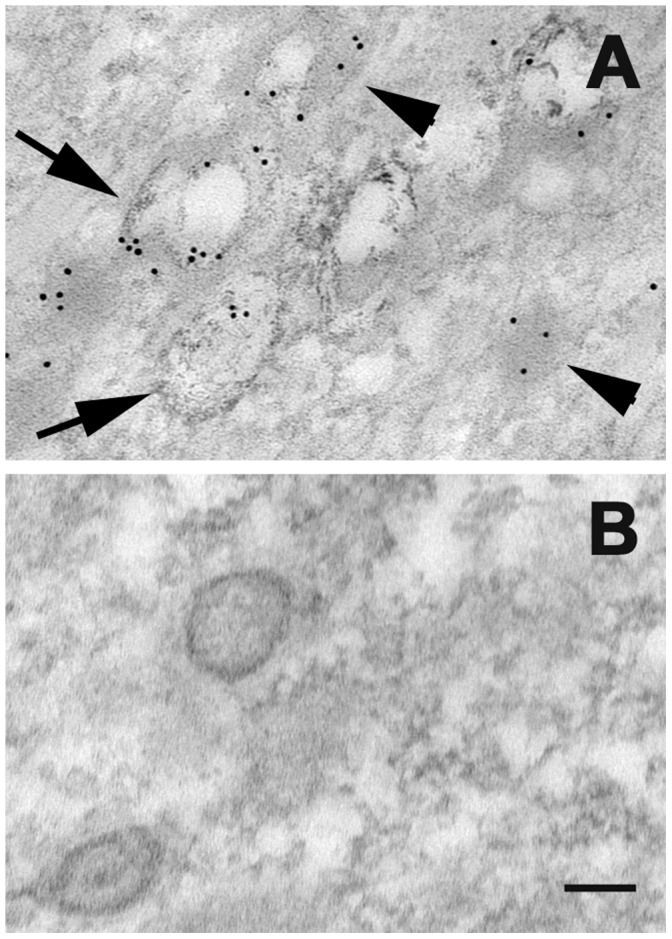
Figure 7 Localization of cycD2SV in electron-dense lysosome (arrowhead) and autophagosome structures (arrows; A, B). HEK293 cells transfected with D2SVmyc (A, B) were fixed, embedded in resin and sectioned (approximately 80 nm). Sections were processed for electron microscopy and probed with cycD2SV antibodies (A). As a control primary antibodies were omitted (B). Scale bar is 100 nm.
Figure 7 Localization of cycD2SV in electron-dense lysosome (arrowhead) and autophagosome structures (arrows; A, B). HEK293 cells transfected with D2SVmyc (A, B) were fixed, embedded in resin and sectioned (approximately 80 nm). Sections were processed for electron microscopy and probed with cycD2SV antibodies (A). As a control primary antibodies were omitted (B). Scale bar is 100 nm.CC BY · PubMed Central
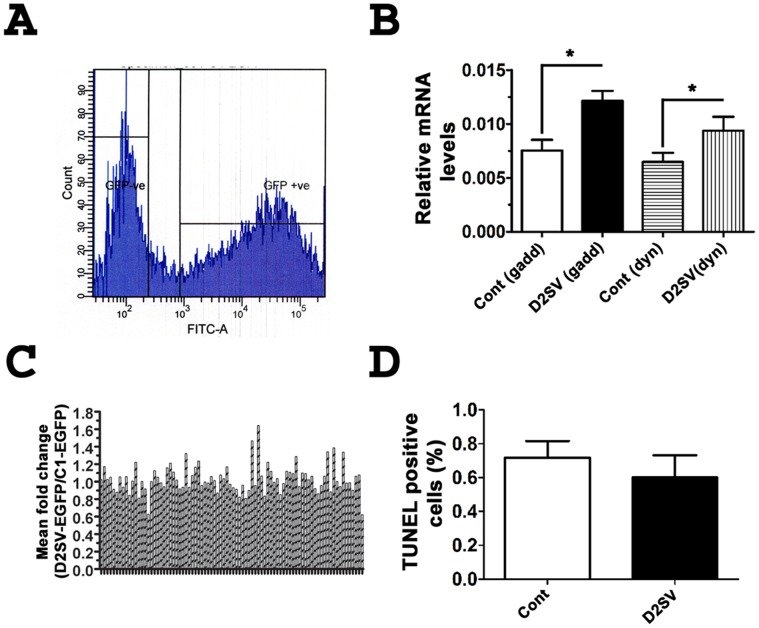
Figure 8 Cell cycle array analysis on cells expressing EGFP-D2SV. Gating for sorting of HEK293 cells transfected with EGFP-D2SV cells during FACS analysis (A). Relative mRNA levels of GADD45α and dynamitin 2 in EGFP-D2SV FACS sorted cells compared to control EGFP-C1 sorted cells (B). A profile of the fold changes of 86 cell cycle genes completed for EGFP-D2SV FACS sorted cells relative to EGFP-C1 control cells (C). Values are expressed as mean ± SEM. Unpaired two-tail t-test, *p<0.05 compared to EGFP-C1, three separate arrays from three independent experiments were analysed (N = 3). HEK293 Cells transfected with cycD2SVmyc were processed for immunostaining using myc antibody followed by TUNNEL staining. TUNNEL positive cells were counted and expressed as a fraction of total cells counted (D). Values are expressed as mean ± SEM. Panel B: Unpaired two-tail t-test, *p<0.05 compared to the LI of untransfected cells, approximately 1000 cells were counted for each group from three independent experiments (N = 3). Panel A: No significant difference was found between groups.
Figure 8 Cell cycle array analysis on cells expressing EGFP-D2SV. Gating for sorting of HEK293 cells transfected with EGFP-D2SV cells during FACS analysis (A). Relative mRNA levels of GADD45α and dynamitin 2 in EGFP-D2SV FACS sorted cells compared to control EGFP-C1 sorted cells (B). A profile of the fold changes of 86 cell cycle genes completed for EGFP-D2SV FACS sorted cells relative to EGFP-C1 control cells (C). Values are expressed as mean ± SEM. Unpaired two-tail t-test, *p<0.05 compared to EGFP-C1, three separate arrays from three independent experiments were analysed (N = 3). HEK293 Cells transfected with cycD2SVmyc were processed for immunostaining using myc antibody followed by TUNNEL staining. TUNNEL positive cells were counted and expressed as a fraction of total cells counted (D). Values are expressed as mean ± SEM. Panel B: Unpaired two-tail t-test, *p<0.05 compared to the LI of untransfected cells, approximately 1000 cells were counted for each group from three independent experiments (N = 3). Panel A: No significant difference was found between groups.CC BY · PubMed Central
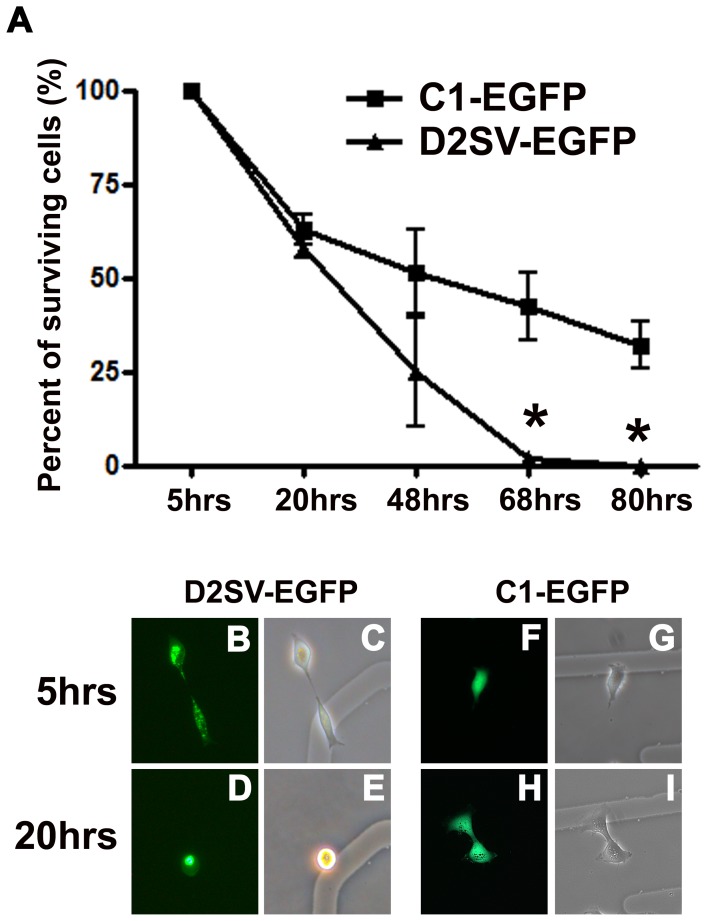
Figure 9 Analysis of D2SV-EGFP induced cell death in collaboration with trypsinization. HEK293 cells transfected with D2SV-EGFP or C1-EGFP were trypsinized and reseeded on gridded coverslips. In each experiment, cells were followed for 80 hrs to determine long term cell viability after trypsinization. Surviving cells were quantified and expressed as a percent of total counted cells (A). Values are expressed as mean ± SEM. One-way ANOVA, *p<0.05, seven to twenty cells were followed from three independent experiments (N = 3). Photomicrographs depict examples of D2SV-EGFP (B–E) and C1-EGFP (F–I) cells at 5 hrs (B, C, F, G) and 20 hrs (D, E, H, I). Note all EGFP-D2SV transfected cells disappeared from culture by 68 hrs post trypsinization (A). Examples of cell death in EGFP-D2SV transfected cells as observed in live cultures by fluorescence microscopy (B–E).
Figure 9 Analysis of D2SV-EGFP induced cell death in collaboration with trypsinization. HEK293 cells transfected with D2SV-EGFP or C1-EGFP were trypsinized and reseeded on gridded coverslips. In each experiment, cells were followed for 80 hrs to determine long term cell viability after trypsinization. Surviving cells were quantified and expressed as a percent of total counted cells (A). Values are expressed as mean ± SEM. One-way ANOVA, *p<0.05, seven to twenty cells were followed from three independent experiments (N = 3). Photomicrographs depict examples of D2SV-EGFP (B–E) and C1-EGFP (F–I) cells at 5 hrs (B, C, F, G) and 20 hrs (D, E, H, I). Note all EGFP-D2SV transfected cells disappeared from culture by 68 hrs post trypsinization (A). Examples of cell death in EGFP-D2SV transfected cells as observed in live cultures by fluorescence microscopy (B–E).CC BY · PubMed Central
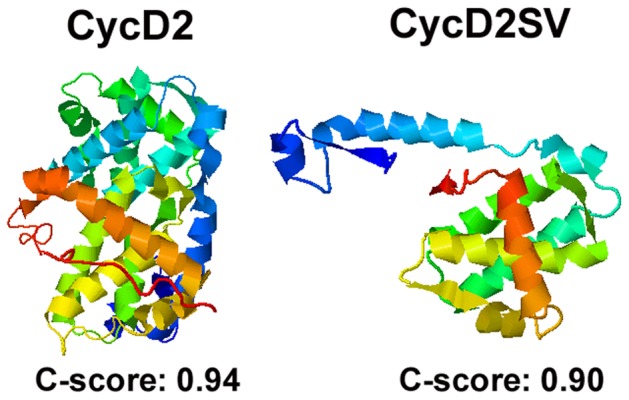
Figure 10 Three-dimensional (3D) protein structure predictions for cycD2 and cycD2SV. Protein structures were determined by the iterative threading assembly refinement (I-TASSER) server, an internet based 3D protein structure prediction engine. The N-terminus of the presented protein structures is denoted by blue and the C-terminus is denoted by red.
Figure 10 Three-dimensional (3D) protein structure predictions for cycD2 and cycD2SV. Protein structures were determined by the iterative threading assembly refinement (I-TASSER) server, an internet based 3D protein structure prediction engine. The N-terminus of the presented protein structures is denoted by blue and the C-terminus is denoted by red.CC BY · PubMed Central

Verification

Claims the paper makes

The claims and statistics of this paper haven’t been checked yet.

Run the check — free, no account needed. It reads the open-access text and checks the sources it cites.

A few free checks a day · papers already verified open instantly · results are public

Claims other papers make about this one

Each is checked against this paper’s own text: does it say what the citing paper says it does?

Self-check

Percentages, sums and reported differences re-computed from the paper’s own numbers.

The self-check needs the paper’s full text.

Citations

Cites

Research works printed but not linked: 49

  1. DG Johnson, 1999, Cyclins and cell cycle checkpoints, Annu Rev Pharmacol Toxicol, 39, 295, 10.1146/annurev.pharmtox.39.1.295 · DOI
  2. C Denicourt, 2003, Gris1, a new common integration site in Graffi murine leukemia virus-induced leukemias: overexpression of a truncated cyclin D2 due to alternative splicing, J Virol, 77, 37, 10.1128/JVI.77.1.37-44.2003 · DOI
  3. C Denicourt, 2008, Human and mouse cyclin D2 splice variants: transforming activity and subcellular localization, Oncogene, 27, 1253, 10.1038/sj.onc.1210750 · DOI
  4. Q Sun, 2009, A splice variant of cyclin D2 regulates cardiomyocyte cell cycle through a novel protein aggregation pathway, J Cell Sci, 122, 1563, 10.1242/jcs.047738 · DOI
  5. B DeLaBarre, 2006, Central pore residues mediate the p97/VCP activity required for ERAD, Mol Cell, 22, 451, 10.1016/j.molcel.2006.03.036 · DOI
  6. M Meyyappan, 1998, Increased expression of cyclin D2 during multiple states of growth arrest in primary and established cells, Mol Cell Biol, 18, 3163, 10.1128/MCB.18.6.3163 · DOI
  7. T Lamark, 2003, Interaction codes within the family of mammalian Phox and Bem1p domain-containing proteins, J Biol Chem, 278, 34568, 10.1074/jbc.M303221200 · DOI
  8. S Pankiv, 2007, p62/SQSTM1 binds directly to Atg8/LC3 to facilitate degradation of ubiquitinated protein aggregates by autophagy, J Biol Chem, 282, 24131, 10.1074/jbc.M702824200 · DOI · Paper page
  9. RP Mohney, 2003, Intersectin activates Ras but stimulates transcription through an independent pathway involving JNK, J Biol Chem, 278, 47038, 10.1074/jbc.M303895200 · DOI
  10. KJ Livak, 2001, Analysis of relative gene expression data using real-time quantitative PCR and the 2(-Delta Delta C(T)) Method, Methods, 25, 402, 10.1006/meth.2001.1262 · DOI · Paper page
  11. NM McMullen, 2009, Functional characterization of cardiac progenitor cells and their derivatives in the embryonic heart post-chamber formation, Dev Dyn, 238, 2787, 10.1002/dvdy.22112 · DOI
  12. F Zhang, 2007, Ultrastructural and immunocharacterization of undifferentiated myocardial cells in the developing mouse heart, J Cell Mol Med, 11, 552, 10.1111/j.1582-4934.2007.00044.x · DOI
  13. A Roy, 2010, I-TASSER: a unified platform for automated protein structure and function prediction, Nat Protoc, 5, 725, 10.1038/nprot.2010.5 · DOI
  14. Y Zhang, 2008, I-TASSER server for protein 3D structure prediction, BMC Bioinformatics, 9, 40, 10.1186/1471-2105-9-40 · DOI · Paper page
  15. J Zwicker, 1999, Functional domains in cyclin D1: pRb-kinase activity is not essential for transformation, Oncogene, 18, 19, 10.1038/sj.onc.1202286 · DOI
  16. K Kajitani, 2010, Developmental expression of the cyclin D2 splice variant in postnatal Purkinje cells of the mouse cerebellum, Neurosci Lett, 477, 100, 10.1016/j.neulet.2010.04.042 · DOI
  17. NF Bence, 2001, Impairment of the ubiquitin-proteasome system by protein aggregation, Science, 292, 1552, 10.1126/science.292.5521.1552 · DOI
  18. V Kirkin, 2009, A role for ubiquitin in selective autophagy, Mol Cell, 34, 259, 10.1016/j.molcel.2009.04.026 · DOI
  19. M Razi, 2009, Early endosomes and endosomal coatomer are required for autophagy, J Cell Biol, 185, 305, 10.1083/jcb.200810098 · DOI
  20. S Waelter, 2001, Accumulation of mutant huntingtin fragments in aggresome-like inclusion bodies as a result of insufficient protein degradation, Mol Biol Cell, 12, 1393, 10.1091/mbc.12.5.1393 · DOI
  21. XW Wang, 1999, GADD45 induction of a G2/M cell cycle checkpoint, Proc Natl Acad Sci U S A, 96, 3706, 10.1073/pnas.96.7.3706 · DOI · Paper page
  22. DA Liebermann, 2007, Gadd45 in the response of hematopoietic cells to genotoxic stress, Blood Cells Mol Dis, 39, 329, 10.1016/j.bcmd.2007.06.006 · DOI
  23. Q Zhan, 1999, Association with Cdc2 and inhibition of Cdc2/Cyclin B1 kinase activity by the p53-regulated protein Gadd45, Oncogene, 18, 2892, 10.1038/sj.onc.1202667 · DOI
  24. DL Evans, 1990, Effects of phorbol esters and calcium ionophore on nonspecific cytotoxic cells, Dev Comp Immunol, 14, 223, 10.1016/0145-305X(90)90093-T · DOI
  25. GJ Praefcke, 2004, The dynamin superfamily: universal membrane tubulation and fission molecules?, Nat Rev Mol Cell Biol, 5, 133, 10.1038/nrm1313 · DOI
  26. KN Fish, 2000, Evidence that dynamin-2 functions as a signal-transducing GTPase, J Cell Biol, 150, 145, 10.1083/jcb.150.1.145 · DOI
  27. Williams O (2004) Apoptosis Methods and Protocols; Brady HJM, editor. Totowa, NJ: Humana Press Inc. 31–42 p.
  28. MA Ciemerych, 2005, Cell cycle in mouse development, Oncogene, 24, 2877, 10.1038/sj.onc.1208608 · DOI
  29. S Wei, 1999, Expression of catalytically active telomerase does not prevent premature senescence caused by overexpression of oncogenic Ha-Ras in normal human fibroblasts, Cancer Res, 59, 1539
  30. R Garcia-Mata, 2002, Hassles with taking out the garbage: aggravating aggresomes, Traffic, 3, 388, 10.1034/j.1600-0854.2002.30602.x · DOI
  31. PB Wedegaertner, 2002, Characterization of subcellular localization and stability of a splice variant of G alpha i2, BMC Cell Biol, 3, 12, 10.1186/1471-2121-3-12 · DOI
  32. JA Diehl, 1997, A dominant-negative cyclin D1 mutant prevents nuclear import of cyclin-dependent kinase 4 (CDK4) and its phosphorylation by CDK-activating kinase, Mol Cell Biol, 17, 7362, 10.1128/MCB.17.12.7362 · DOI
  33. DI Lin, 2006, Phosphorylation-dependent ubiquitination of cyclin D1 by the SCF(FBX4-alphaB crystallin) complex, Mol Cell, 24, 355, 10.1016/j.molcel.2006.09.007 · DOI · Paper page
  34. A Kida, 2007, Glycogen synthase kinase-3beta and p38 phosphorylate cyclin D2 on Thr280 to trigger its ubiquitin/proteasome-dependent degradation in hematopoietic cells, Oncogene, 26, 6630, 10.1038/sj.onc.1210490 · DOI
  35. H Okabe, 2006, A critical role for FBXW8 and MAPK in cyclin D1 degradation and cancer cell proliferation, PLoS One, 1, e128, 10.1371/journal.pone.0000128 · DOI
  36. DJ Klionsky, 2010, The autophagy connection, Dev Cell, 19, 11, 10.1016/j.devcel.2010.07.005 · DOI
  37. J Moscat, 2009, p62 at the crossroads of autophagy, apoptosis, and cancer, Cell, 137, 1001, 10.1016/j.cell.2009.05.023 · DOI · Paper page
  38. M Komatsu, 2010, Physiological significance of selective degradation of p62 by autophagy, FEBS Lett, 584, 1374, 10.1016/j.febslet.2010.02.017 · DOI
  39. EG Reynaud, 2000, Dimerization of the amino terminal domain of p57Kip2 inhibits cyclin D1-cdk4 kinase activity, Oncogene, 19, 1147, 10.1038/sj.onc.1203403 · DOI
  40. T Takaki, 2009, The structure of CDK4/cyclin D3 has implications for models of CDK activation, Proc Natl Acad Sci U S A, 106, 4171, 10.1073/pnas.0809674106 · DOI
  41. P Sumrejkanchanakij, 2003, Role of cyclin D1 cytoplasmic sequestration in the survival of postmitotic neurons, Oncogene, 22, 8723, 10.1038/sj.onc.1206870 · DOI · Paper page
  42. JP Alao, 2006, The cyclin D1 proto-oncogene is sequestered in the cytoplasm of mammalian cancer cell lines, Mol Cancer, 5, 7, 10.1186/1476-4598-5-7 · DOI
  43. MC Hollander, 2002, Genomic instability, centrosome amplification, cell cycle checkpoints and Gadd45a, Oncogene, 21, 6228, 10.1038/sj.onc.1205774 · DOI
  44. HL Huang, 2010, Trypsin-induced proteome alteration during cell subculture in mammalian cells, J Biomed Sci, 17, 36, 10.1186/1423-0127-17-36 · DOI
  45. MS von Bergwelt-Baildon, 2011, The cyclins: a family of widely expressed tumor antigens?, Expert Rev Vaccines, 10, 389, 10.1586/erv.10.170 · DOI
  46. EK Han, 1999, Roles of cyclin D1 and related genes in growth inhibition, senescence and apoptosis, Apoptosis, 4, 213, 10.1023/A:1009618824145 · DOI
  47. I Garkavtsev, 1998, Molecular aspects of the relationship between cancer and aging: tumor suppressor activity during cellular senescence, Exp Gerontol, 33, 81, 10.1016/S0531-5565(97)00086-7 · DOI
  48. S Matsuoka, 1994, D-type cyclin-binding regions of proliferating cell nuclear antigen, J Biol Chem, 269, 11030, 10.1016/S0021-9258(19)78087-9 · DOI · Paper page
  49. P Atadja, 1995, Overexpression of cyclin D1 blocks proliferation of normal diploid fibroblasts, Exp Cell Res, 217, 205, 10.1006/excr.1995.1080 · DOI

Cited by

Sorted by citations

See all 14

Metadata

Authors
Wafa, K., MacLean, J., Zhang, F., & Pasumarthi, K. B. S.
Venue
PLoS ONE
Published
2013-01-10
Volume
8
Issue
1
Pages
e53503
ISSN
1932-6203
Cited by
14
References
4
Language
en

About these checks

Registry, retraction, Cites and statistics results are computed, not judged, with one exception: a printed reference that no index lists is read once by a model before it counts as a citation error. Claims are extracted by a model and kept only when their quote appears verbatim in the text; each cited source is then checked, with a model’s help, for whether it says what the claim relies on. Those verdicts can be wrong — read the claim’s quote and the cited source before relying on one.

Statistics and arithmetic are recomputed, not judged.

Confidence bands are shown only for fields calibrated on our annotated test set. None is calibrated yet, so no band is shown.

What counts as a claim ›How we measure confidence ›How we check this ›

Are you an author, or do you see a problem with this page? Request a review