

The DOI matches its Crossref record; 29 of the 30 references it cites were found in a registry or an index.
The Twitter of Babel: Mapping World Languages through Microblogging Platforms
Open accessAbstract
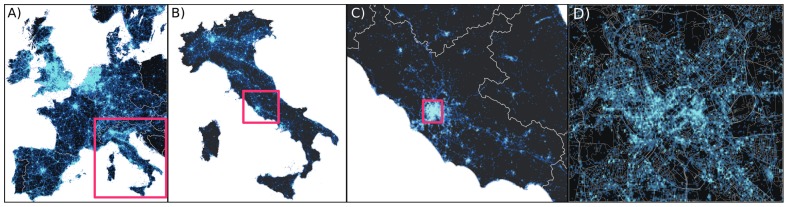
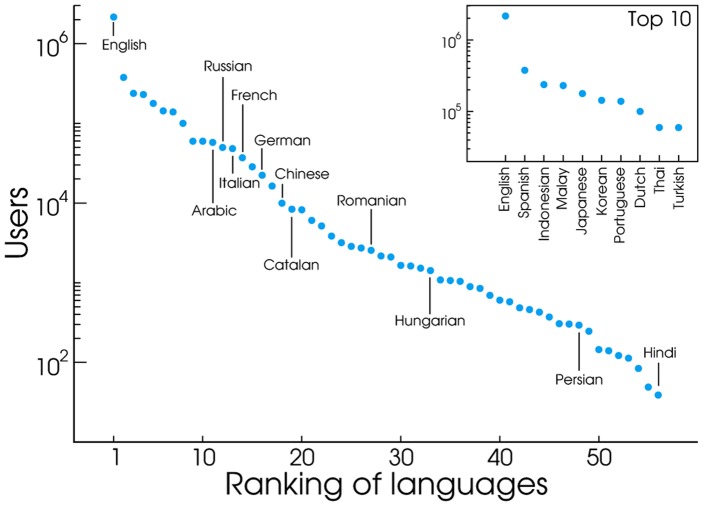
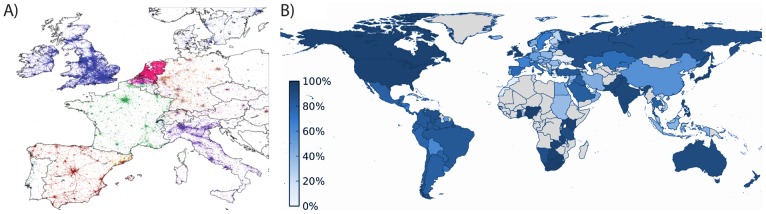
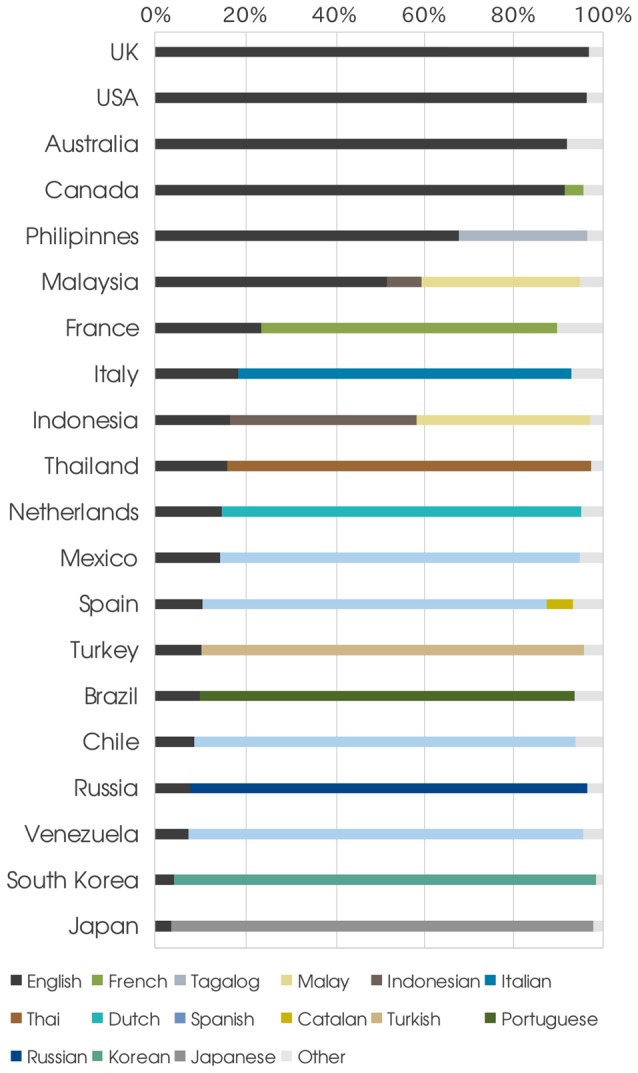
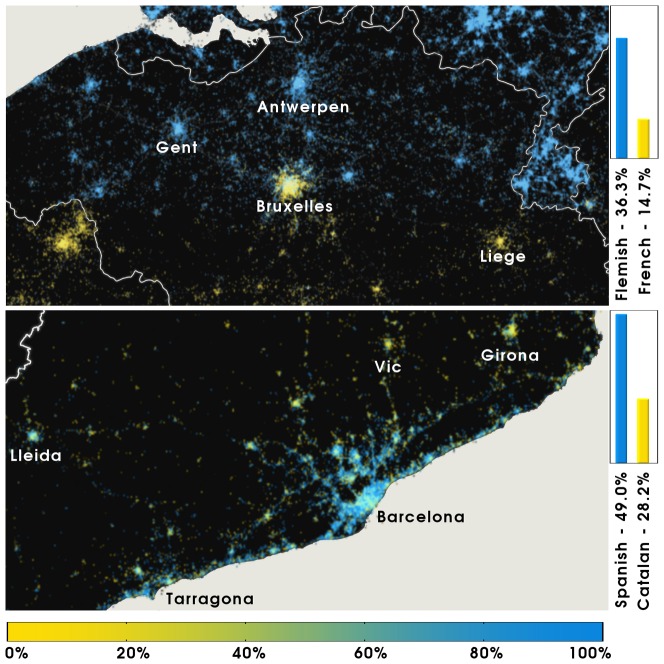
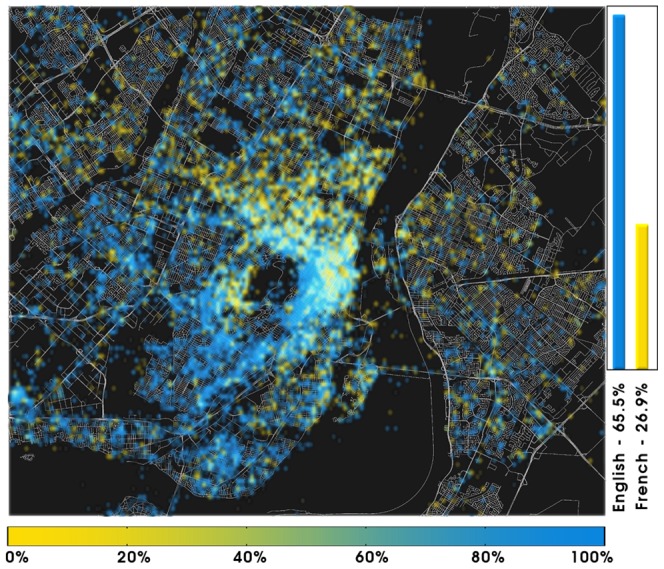
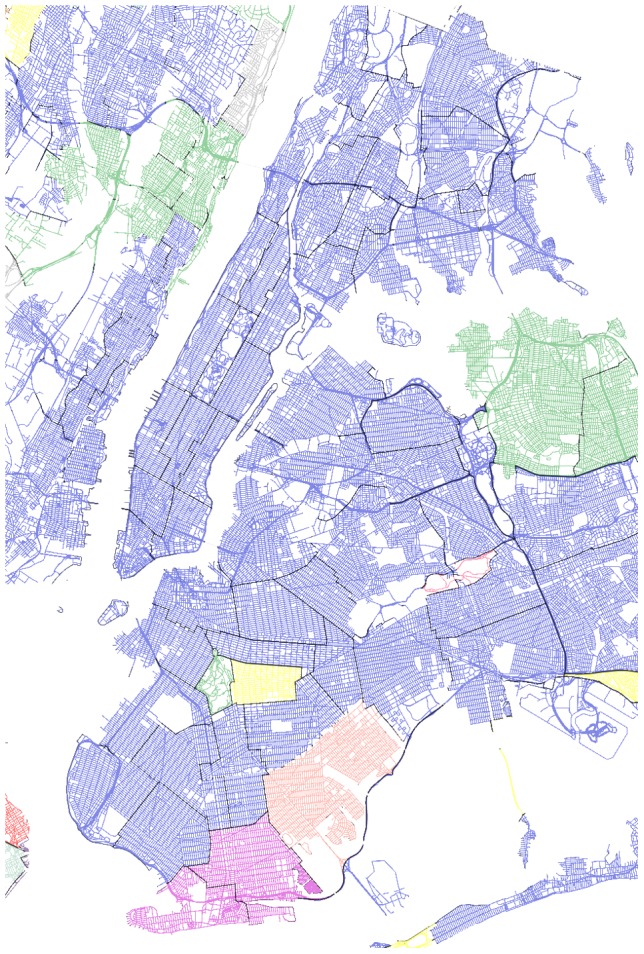
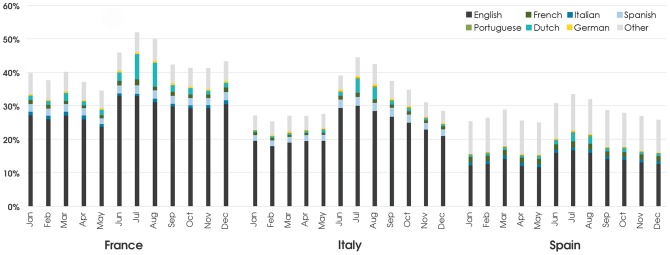
Large scale analysis and statistics of socio-technical systems that just a few short years ago would have required the use of consistent economic and human resources can nowadays be conveniently performed by mining the enormous amount of digital data produced by human activities. Although a characterization of several aspects of our societies is emerging from the data revolution, a number of questions concerning the reliability and the biases inherent to the big data "proxies" of social life are still open. Here, we survey worldwide linguistic indicators and trends through the analysis of a large-scale dataset of microblogging posts. We show that available data allow for the study of language geography at scales ranging from country-level aggregation to specific city neighborhoods. The high resolution and coverage of the data allows us to investigate different indicators such as the linguistic homogeneity of different countries, the touristic seasonal patterns within countries and the geographical distribution of different languages in multilingual regions. This work highlights the potential of geolocalized studies of open data sources to improve current analysis and develop indicators for major social phenomena in specific communities.
Overview
The claims and statistics of this paper haven’t been checked yet.
Run the check — free, no account needed. It reads the open-access text and checks the sources it cites.
Integrity signals
Registry
Cites
Statistics
Figures
Verification
Claims the paper makes
The claims and statistics of this paper haven’t been checked yet.
Run the check — free, no account needed. It reads the open-access text and checks the sources it cites.
Claims other papers make about this one
Each is checked against this paper’s own text: does it say what the citing paper says it does?
The source backs part of the claim, not all of it — or backs it for a different population, condition or comparison.
In the citing paper
“By mapping the use of languages across countries, Mocanu et al. (2013) observed seasonal variations in the linguistic composition of each country, as well as between geographical areas at different granularity scales, even at the level of city neighborhoods.”
From Social Data: Biases, Methodological Pitfalls, and Ethical Boundaries (2019) · cites this paper as Mocanu et al., 2013
Experimental — accuracy not yet measured
Self-check
Percentages, sums and reported differences re-computed from the paper’s own numbers.
The self-check needs the paper’s full text.
Citations
Cites
Understanding individual human mobility patterns
González, M. C., Hidalgo, C. A., & Barabási, A.-Ĺ. (2008) · Nature · doi:10.1038/nature06958 · Cited by 6,186
Predicting Elections with Twitter: What 140 Characters Reveal about Political Sentiment
Tumasjan, A., Sprenger, T. O., Sandner, P., & Welpe, I. M. (2010) · Proceedings of the International AAAI Conference on Web and Social Media · doi:10.1609/icwsm.v4i1.14009 · Cited by 2,647
Structure and tie strengths in mobile communication networks
Onnela, J.-P. “., Saramäki, J., Hyvönen, J., Szabó, G., Lazer, D., Kaski, K. K., Kertész, J., & Barabási, A.-Ĺ. (2007) · Proceedings of the National Academy of Sciences · doi:10.1073/pnas.0610245104 · Cited by 1,945
Talking about tactile experiences
Obrist, M., Seah, S. A., & Subramanian, S. (2013) · CHI Conference on Human Factors in Computing Systems · doi:10.1145/2470654.2466220 · Cited by 1,634
Understanding the Demographics of Twitter Users
Mislove, A. E., Lehmann, S., Ahn, Y., Onnela, J.-P. “., & Rosenquist, J. (2021) · Proceedings of the International AAAI Conference on Web and Social Media · doi:10.1609/icwsm.v5i1.14168 · Cited by 761
Modeling Users' Activity on Twitter Networks: Validation of Dunbar's Number
Gonçalves, B., Perra, N., & Vespignani, A. (2011) · PLoS ONE · doi:10.1371/journal.pone.0022656 · Cited by 638
Self-citationTowards detecting influenza epidemics by analyzing Twitter messages
Culotta, A. (2010) · doi:10.1145/1964858.1964874 · Cited by 631
Takhteyev, Y., Gruzd, A. A., & Wellman, B. (2011) · Social Networks · doi:10.1016/j.socnet.2011.05.006 · Cited by 617
Predicting the Political Alignment of Twitter Users
Conover, M. D., Goncalves, B., Ratkiewicz, J., Flammini, A., & Menczer, F. (2011) · 2011 IEEE Third Int'l Conference on Privacy, Security, Risk and Trust and 2011 IEEE Third Int'l Conference on Social Computing · doi:10.1109/passat/socialcom.2011.34 · Cited by 588
Self-citationRatkiewicz (2011) · doi:10.1145/1963192.1963301 · Cited by 541
Self-citation
Research works printed but not linked: 1
- Mislove A, Lehmann S, Ahn YY, Onnela JP, Rosenquist JN (2011) Understanding the demographics of twitter users. In: In Proceedings of the Fifth International AAAI Conference on Weblogs and Social Media.
Cited by
Sorted by citations
Online Human-Bot Interactions: Detection, Estimation, and Characterization
Varol, O., Ferrara, E., Davis, C., Menczer, F., & Flammini, A. (2017) · Proceedings of the International AAAI Conference on Web and Social Media · doi:10.1609/icwsm.v11i1.14871 · Cited by 981
Social Data: Biases, Methodological Pitfalls, and Ethical Boundaries
Olteanu, A., Castillo, C., Diaz, F., & Kıcıman, E. (2019) · Frontiers in Big Data · doi:10.3389/fdata.2019.00013 · Cited by 763
“By mapping the use of languages across countries, Mocanu et al. (2013) observed seasonal variations in the linguistic composition of each country, as well as between geographical areas at different granularity scales, even at the level of city neighborhoods.”
BackgroundBig data for development: a review of promises and challenges
Hilbert, M. (2016) · Development Policy Review · doi:10.1111/dpr.12142 · Cited by 679
Geo-located Twitter as proxy for global mobility patterns
Hawelka, B., Sitko, I., Beinat, E., Sobolevsky, S. L., Kazakopoulos, P., & Ratti, C. (2014) · Cartography and Geographic Information Science · doi:10.1080/15230406.2014.890072 · Cited by 696
Science vs Conspiracy: Collective Narratives in the Age of Misinformation
Bessi, A., Coletto, M., Davidescu, G. A., Scala, A., Caldarelli, G., & Quattrociocchi, W. (2015) · PLOS ONE · doi:10.1371/journal.pone.0118093 · Cited by 645
Metadata
- Authors
- Mocanu, D., Baronchelli, A., Perra, N., Gonçalves, B., Zhang, Q., & Vespignani, A.
- Affiliations
- Northeastern University (US)
- Centre National de la Recherche Scientifique (FR)
- Corresponding author
- Vespignani, Alessandro
- Venue
- PLoS ONE
- Publisher
- Public Library of Science (PLoS)
- Published
- 2013-04-18
- Volume
- 8
- Issue
- 4
- Pages
- e61981
- ISSN
- 1932-6203 (ISSN-L)
- PMC
- PMC3630228
- OpenAlex
- W2044734026
- Cited by
- 293
- References
- 30
- Citations by year
- 2026: 5 · 2025: 8 · 2024: 10 · 2023: 13 · 2022: 16 · 2021: 21 · 2020: 17 · 2019: 26 · 2018: 31 · 2017: 38 · 2016: 38 · 2015: 36 · 2014: 23 · 2013: 10
- FWCI
- 151.78
- Type
- journal article
- Language
- en
- Open access
- gold
- doi.org
- Locations
- PLoS ONE (publishedVersion, cc-by)
- Europe PMC (PubMed Central) (publishedVersion, other-oa)
- PubMed Central (publishedVersion, cc-by)
- PubMed (publishedVersion)
- Greenwich Academic Literature Archive (University of Greenwich) (acceptedVersion)
- City Research Online (City University London) (acceptedVersion)
- arXiv (Cornell University) (submittedVersion)
- HAL (submittedVersion, cc-by)
- RePEc: Research Papers in Economics (submittedVersion)
- DOAJ (DOAJ: Directory of Open Access Journals) (submittedVersion, cc-by-sa)
- arXiv (Cornell University)
- Funders
- National Science Foundation (1101743)
- Intelligence Advanced Research Projects Activity (D12PC00285)
- Topics
- Social Sciences › Linguistics and Language › Linguistic and Sociocultural Studies
- Social Sciences › Transportation › Human Mobility and Location-Based Analysis
- Social Sciences › Arts and Humanities › Literature and Literary Theory › Digital Humanities and Scholarship
- Keywords
- dialect geography, microblogging, Twitter, multilingual regions, linguistic homogeneity, language use patterns
- MeSH terms
- Humans, Language, Linguistics, Internet, Blogging, Data Mining, Social Media
About these checks
Registry, retraction, Cites and statistics results are computed, not judged, with one exception: a printed reference that no index lists is read once by a model before it counts as a citation error. Claims are extracted by a model and kept only when their quote appears verbatim in the text; each cited source is then checked, with a model’s help, for whether it says what the claim relies on. Those verdicts can be wrong — read the claim’s quote and the cited source before relying on one.
Statistics and arithmetic are recomputed, not judged.
Confidence bands are shown only for fields calibrated on our annotated test set. None is calibrated yet, so no band is shown.
What counts as a claim ›How we measure confidence ›How we check this ›
Are you an author, or do you see a problem with this page? Request a review
