

The DOI matches its Crossref record; 70 of the 70 references it cites were found in a registry or an index.
Cholecalciferol (Vitamin D3) Improves Myelination and Recovery after Nerve Injury
Open accessAbstract
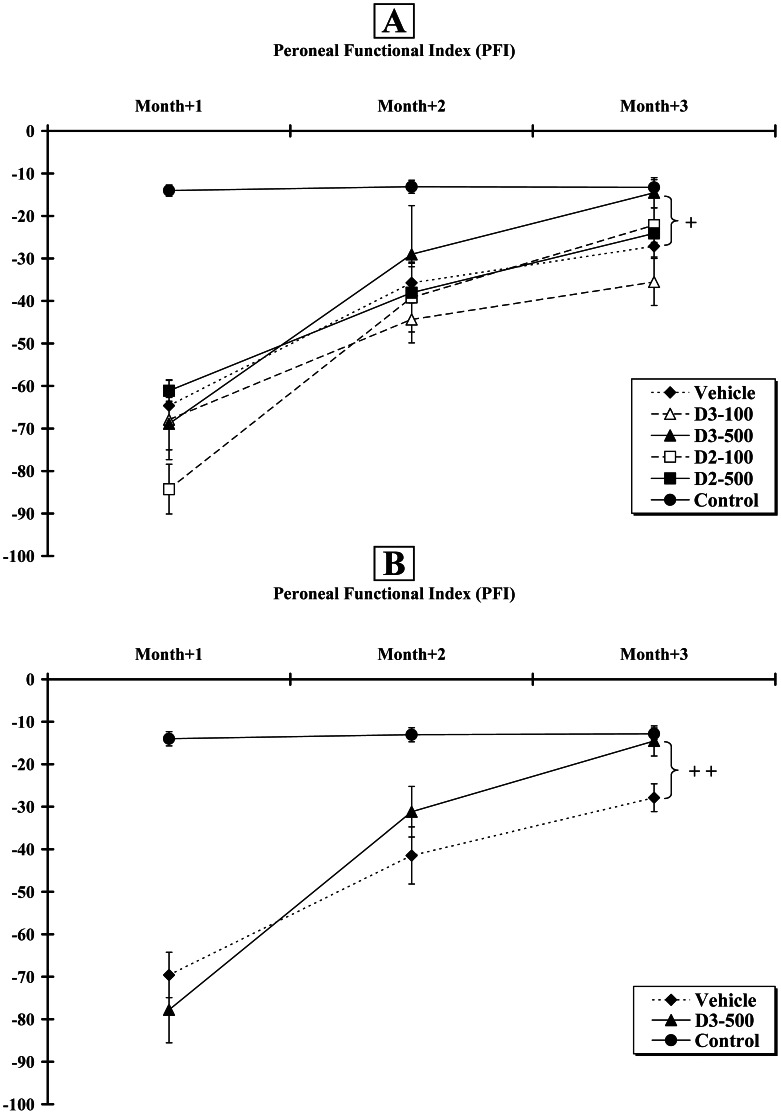
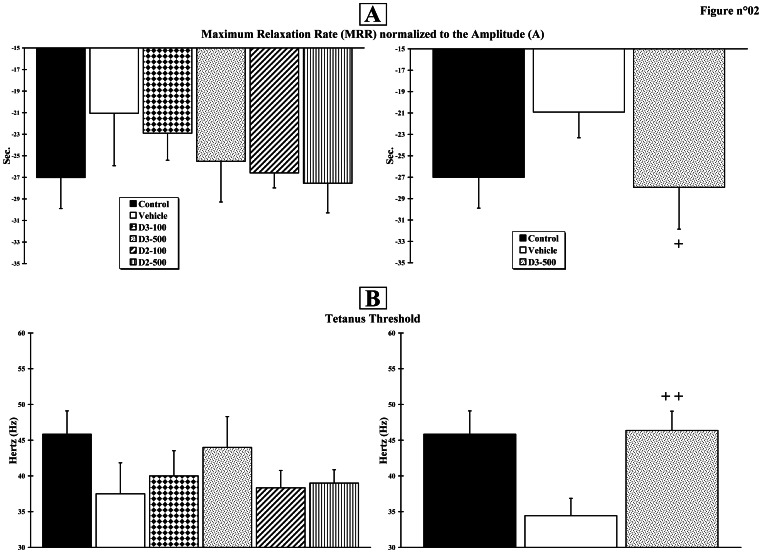
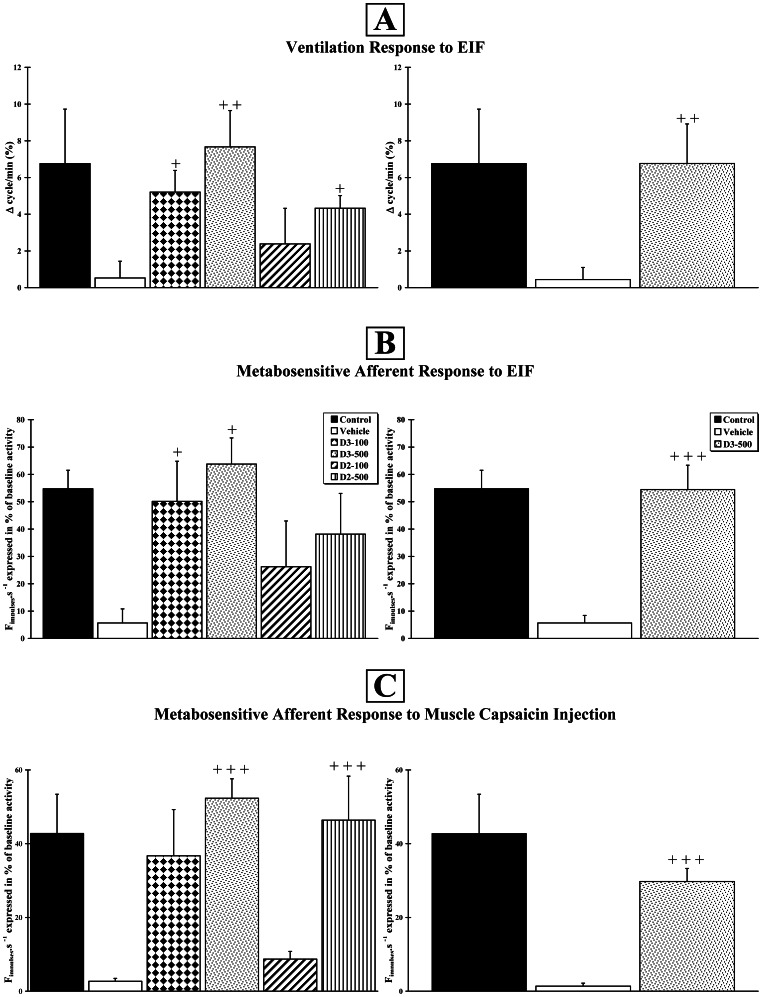
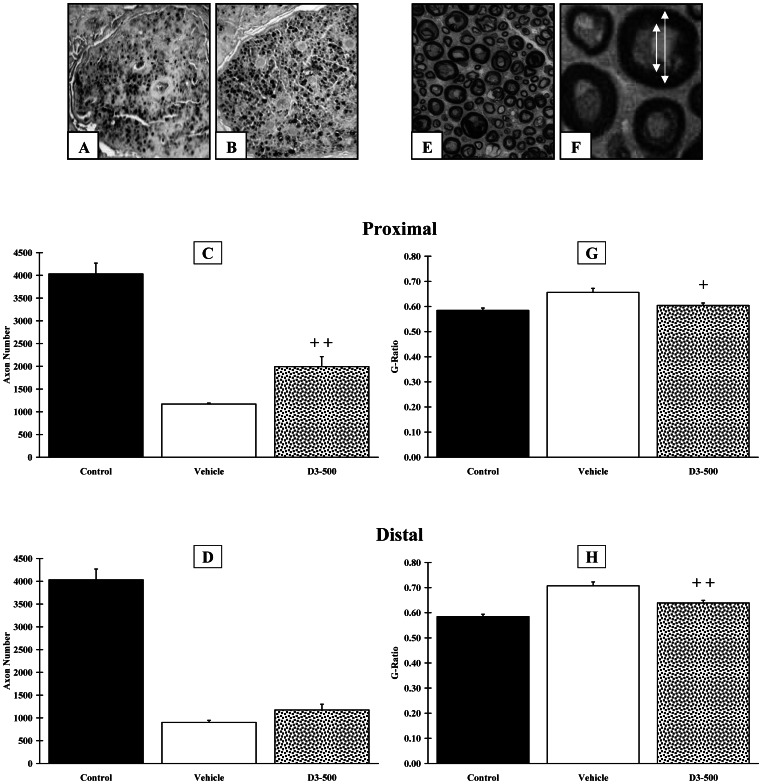
Previously, we demonstrated i) that ergocalciferol (vitamin D2) increases axon diameter and potentiates nerve regeneration in a rat model of transected peripheral nerve and ii) that cholecalciferol (vitamin D3) improves breathing and hyper-reflexia in a rat model of paraplegia. However, before bringing this molecule to the clinic, it was of prime importance i) to assess which form - ergocalciferol versus cholecalciferol - and which dose were the most efficient and ii) to identify the molecular pathways activated by this pleiotropic molecule. The rat left peroneal nerve was cut out on a length of 10 mm and autografted in an inverted position. Animals were treated with either cholecalciferol or ergocalciferol, at the dose of 100 or 500 IU/kg/day, or excipient (Vehicle), and compared to unlesioned rats (Control). Functional recovery of hindlimb was measured weekly, during 12 weeks, using the peroneal functional index. Ventilatory, motor and sensitive responses of the regenerated axons were recorded and histological analysis was performed. In parallel, to identify the genes regulated by vitamin D in dorsal root ganglia and/or Schwann cells, we performed an in vitro transcriptome study. We observed that cholecalciferol is more efficient than ergocalciferol and, when delivered at a high dose (500 IU/kg/day), cholecalciferol induces a significant locomotor and electrophysiological recovery. We also demonstrated that cholecalciferol increases i) the number of preserved or newly formed axons in the proximal end, ii) the mean axon diameter in the distal end, and iii) neurite myelination in both distal and proximal ends. Finally, we found a modified expression of several genes involved in axogenesis and myelination, after 24 hours of vitamin supplementation. Our study is the first to demonstrate that vitamin D acts on myelination via the activation of several myelin-associated genes. It paves the way for future randomised controlled clinical trials for peripheral nerve or spinal cord repair.
Overview
The claims and statistics of this paper haven’t been checked yet.
Run the check — free, no account needed. It reads the open-access text and checks the sources it cites.
Integrity signals
Registry
Cites
Statistics
Figures
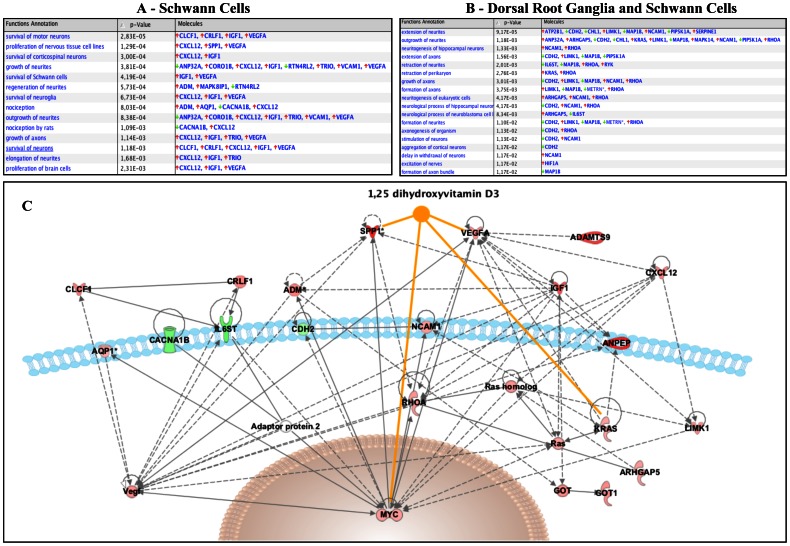
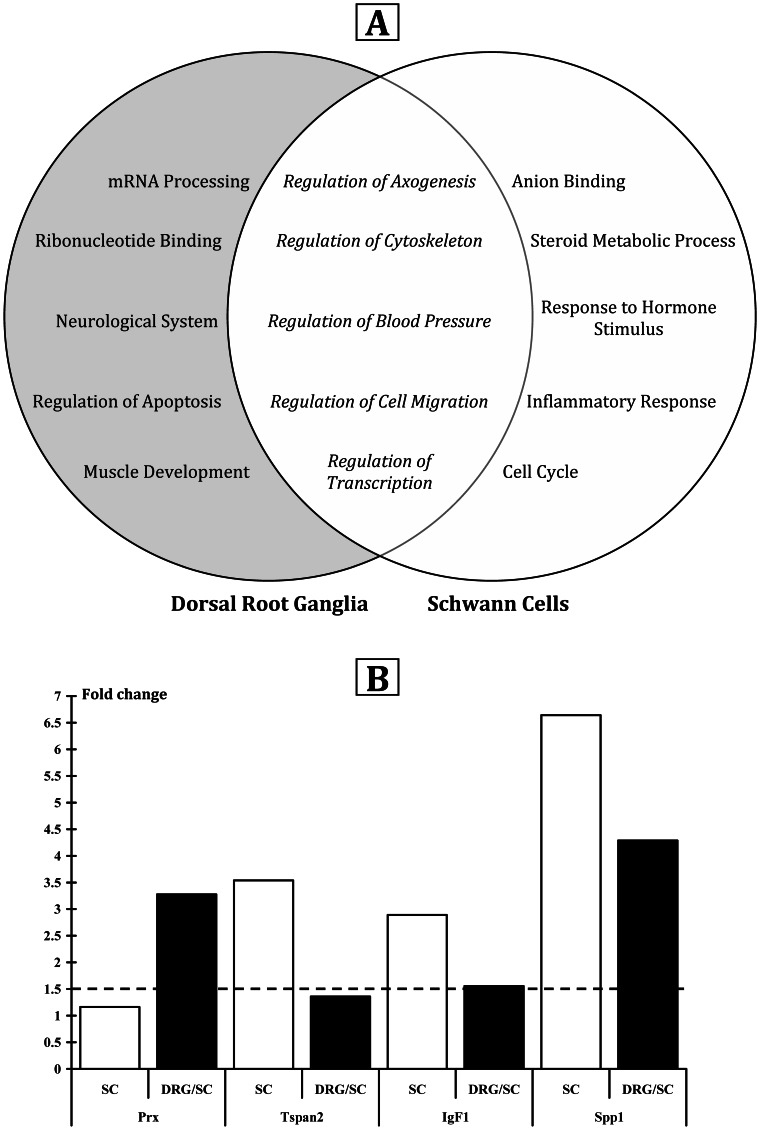
Verification
Claims the paper makes
The claims and statistics of this paper haven’t been checked yet.
Run the check — free, no account needed. It reads the open-access text and checks the sources it cites.
Claims other papers make about this one
Each is checked against this paper’s own text: does it say what the citing paper says it does?
In the citing paper
“Vitamin D has also been shown to modify the expression of several genes involved in axogenesis and myelination [173].”
From Vitamin D and Autism Spectrum Disorder: A Literature Review (2016) · cites this paper as [173]
Self-check
Percentages, sums and reported differences re-computed from the paper’s own numbers.
The self-check needs the paper’s full text.
Citations
Cites
1 retracted
Satō, Y., Iwamoto, J., Kanoko, T., & Satoh, K. (2005) · Cerebrovascular Diseases · doi:10.1159/000087203 · Cited by 410
RetractedSystematic and integrative analysis of large gene lists using DAVID bioinformatics resources
Huang, D. W., Sherman, B. T., & Lempicki, R. A. (2009) · Nature Protocols · doi:10.1038/nprot.2008.211 · Cited by 35,890
Norman, A. W. (1979) · Cited by 3,769
Vitamin D supplementation, 25-hydroxyvitamin D concentrations, and safety
Vieth, R. (1999) · American Journal of Clinical Nutrition · doi:10.1093/ajcn/69.5.842 · Cited by 1,511
Distribution of the vitamin D receptor and 1α-hydroxylase in human brain
Eyles, D. W., Smith, S., Kinobe, R., Hewison, M., & McGrath, J. J. (2005) · Journal of Chemical Neuroanatomy · doi:10.1016/j.jchemneu.2004.08.006 · Cited by 1,444
Functional Evaluation of Complete Sciatic, Peroneal, and Posterior Tibial Nerve Lesions in the Rat
Bain, J. R., Mackinnon, S. E., & Hunter, D. A. (1989) · Plastic & Reconstructive Surgery · doi:10.1097/00006534-198901000-00024 · Cited by 1,262
Vitamin D2Is Much Less Effective than Vitamin D3in Humans
Armas, L. A. G., Hollis, B. W., & Heaney, R. P. (2004) · The Journal of Clinical Endocrinology & Metabolism · doi:10.1210/jc.2004-0360 · Cited by 1,124
The influence of the proinflammatory cytokine, osteopontin, on autoimmune demyelinating disease
Chabas, D., Baranzini, S. E., Mitchell, D., Bernard, C. C. A., Rittling, S. R., Denhardt, D. T., Sobel, R. A., Lock, C., Karpuj, M., Pedotti, R., et al. (2001) · Science · doi:10.1126/science.1062960 · Cited by 829 · cited 1×
“immune disease [66].”
THE INFLUENCE OF THE PROINFLAMMATORY CYTOKINE, OSTEOPONTIN, ON AUTOIMMUNE DEMYELINATING DISEASE
Chabas, D., Baranzini, S. E., Mitchell, D. J., Bernard, C. C. A., Rittling, S. R., Denhardt, D. T., Sobel, R. A., Lock, C., Karpuj, M. V., Pedotti, R., et al. (2002) · International Conference on Osteopontin and SIBLING Proteins · doi:10.1100/tsw.2002.326 · Cited by 729
Beck, K. D., Powell-Braxtont, L., Widmer, H.-R., Valverde, J., & Hefti, F. (1995) · Neuron · doi:10.1016/0896-6273(95)90216-3 · Cited by 636
Cited by
Sorted by citations
Vitamin D and the brain: Genomic and non-genomic actions
Cui, X., Gooch, H. M., Petty, A. E., McGrath, J. J., & Eyles, D. W. (2017) · Molecular and Cellular Endocrinology · doi:10.1016/j.mce.2017.05.035 · Cited by 252
Owens, D. J., Sharples, A. P., Polydorou, I., Alwan, N., Donovan, T. F., TANG, J. C. Y., Fraser, W. D., Cooper, R. G., Morton, J. P., Stewart, C. E., et al. (2015) · American Journal of Physiology-Endocrinology and Metabolism · doi:10.1152/ajpendo.00375.2015 · Cited by 156
Vitamin D Improves Neurogenesis and Cognition in a Mouse Model of Alzheimer’s Disease
Morello, M., Landel, V., Lacassagne, E., Baranger, K., Annweiler, C., Feron, F. P., & Millet, P. (2018) · Molecular Neurobiology · doi:10.1007/s12035-017-0839-1 · Cited by 160
Self-citationde la Fuente, A. G., Errea, O., van Wijngaarden, P., González, G. A., Kerninon, C., Jarjour, A. A., Lewis, H. J., Jones, C. A., Nait‐Oumesmar, B., Zhao, C., et al. (2015) · The Journal of Cell Biology · doi:10.1083/jcb.201505119 · Cited by 158
Differential expression of vitamin D-associated enzymes and receptors in brain cell subtypes
Landel, V., Stephan, D., Cui, X., Eyles, D. W., & Feron, F. P. (2017) · The Journal of Steroid Biochemistry and Molecular Biology · doi:10.1016/j.jsbmb.2017.09.008 · Cited by 119
Self-citation
Metadata
- Authors
- Chabas, J.-F., Stephan, D., Marqueste, T., Garcia, S., Lavaut, M.-N., Nguyen, C., Legre, R., Khrestchatisky, M., Decherchi, P., & Feron, F.
- Affiliations
- Centre National de la Recherche Scientifique (FR)
- Inserm (FR)
- Corresponding author
- Decherchi, Patrick
- Feron, Francois
- ORCID
- Venue
- PLoS ONE
- Publisher
- Public Library of Science (PLoS)
- Published
- 2013-05-31
- Volume
- 8
- Issue
- 5
- Pages
- e65034
- ISSN
- 1932-6203 (ISSN-L)
- PMC
- PMC3669361
- OpenAlex
- W2063567891
- Cited by
- 159
- References
- 70
- Citations by year
- 2026: 8 · 2025: 10 · 2024: 12 · 2023: 12 · 2022: 11 · 2021: 17 · 2020: 22 · 2019: 15 · 2018: 13 · 2017: 11 · 2016: 9 · 2015: 14 · 2014: 4 · 2013: 1
- FWCI
- 4.58
- Type
- journal article
- Language
- en
- Open access
- gold
- doi.org
- Locations
- PLoS ONE (publishedVersion, cc-by)
- Europe PMC (PubMed Central) (publishedVersion, other-oa)
- PubMed Central (publishedVersion, cc-by)
- PubMed (publishedVersion)
- HAL (submittedVersion, cc-by)
- DOAJ (DOAJ: Directory of Open Access Journals) (submittedVersion, cc-by-sa)
- Funders
- Aix-Marseille Université
- Centre National de la Recherche Scientifique
- Topics
- Life Sciences › Neuroscience › Cellular and Molecular Neuroscience › Nerve injury and regeneration
- Health Sciences › Medicine › Endocrinology, Diabetes and Metabolism › Vitamin D Research Studies
- Health Sciences › Medicine › Clinical Neurology › Peripheral Neuropathies and Disorders
- Keywords
- vitamin D3, vitamin D2, peripheral nerve regeneration, nerve transection, myelination, Schwann cells, dorsal root ganglia, axon diameter, functional recovery, peroneal nerve, transcriptome, axogenesis, spinal cord repair
- MeSH terms
- Animals, Axons, Cholecalciferol, Gene Expression Regulation, Male, Motor Activity, Myelin Sheath, Nerve Regeneration, Organ Size, Peroneal Nerve, Time Factors, Signal Transduction, Muscle, Skeletal, Muscle Fibers, Skeletal, Gene Expression Profiling, Rats, Gene Regulatory Networks, Neurogenesis, Peripheral Nerve Injuries
About these checks
Registry, retraction, Cites and statistics results are computed, not judged, with one exception: a printed reference that no index lists is read once by a model before it counts as a citation error. Claims are extracted by a model and kept only when their quote appears verbatim in the text; each cited source is then checked, with a model’s help, for whether it says what the claim relies on. Those verdicts can be wrong — read the claim’s quote and the cited source before relying on one.
Statistics and arithmetic are recomputed, not judged.
Confidence bands are shown only for fields calibrated on our annotated test set. None is calibrated yet, so no band is shown.
What counts as a claim ›How we measure confidence ›How we check this ›
Are you an author, or do you see a problem with this page? Request a review
