

The DOI matches its Crossref record; 44 of the 44 references it cites were found in a registry or an index.
Efficient, Long Term Production of Monocyte-Derived Macrophages from Human Pluripotent Stem Cells under Partly-Defined and Fully-Defined Conditions
Open accessAbstract
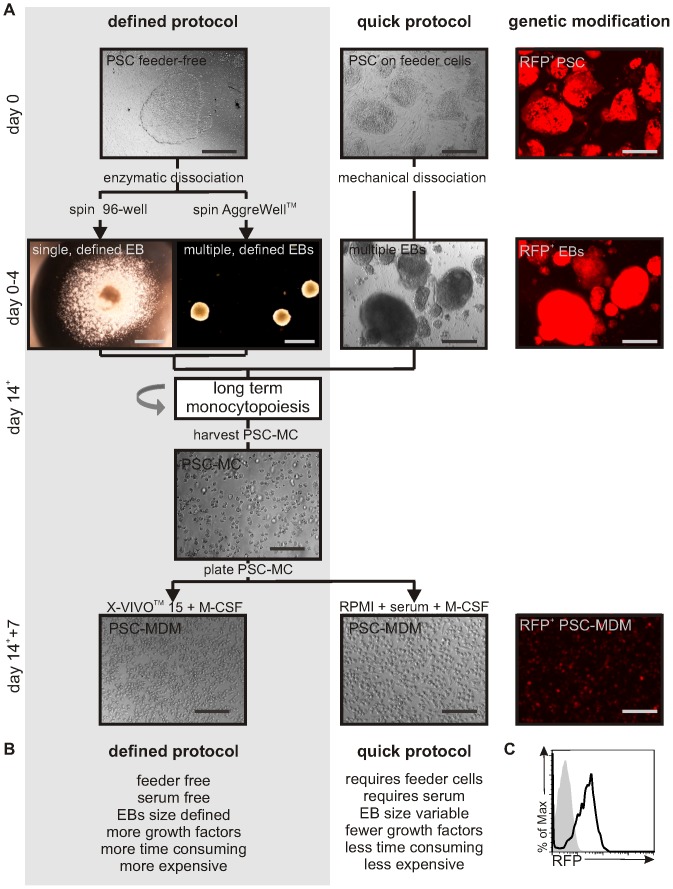
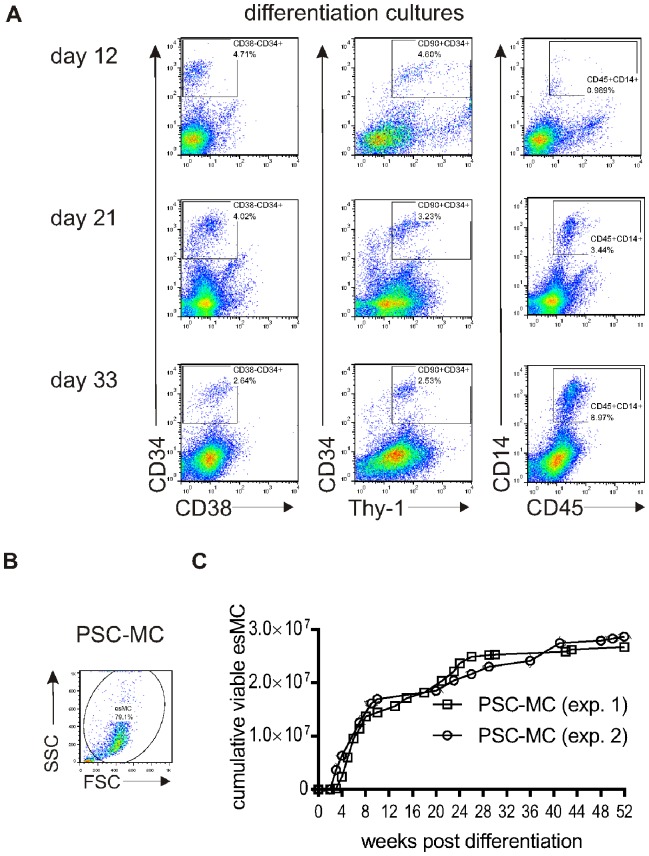
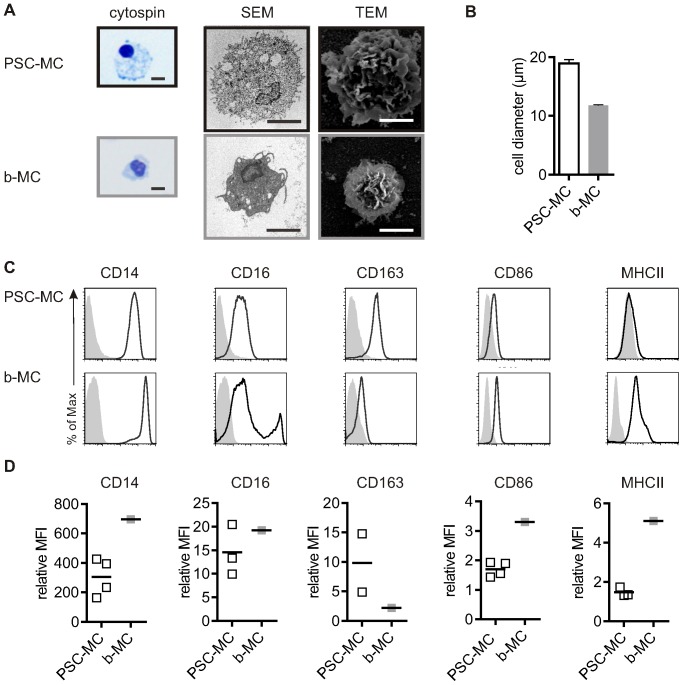
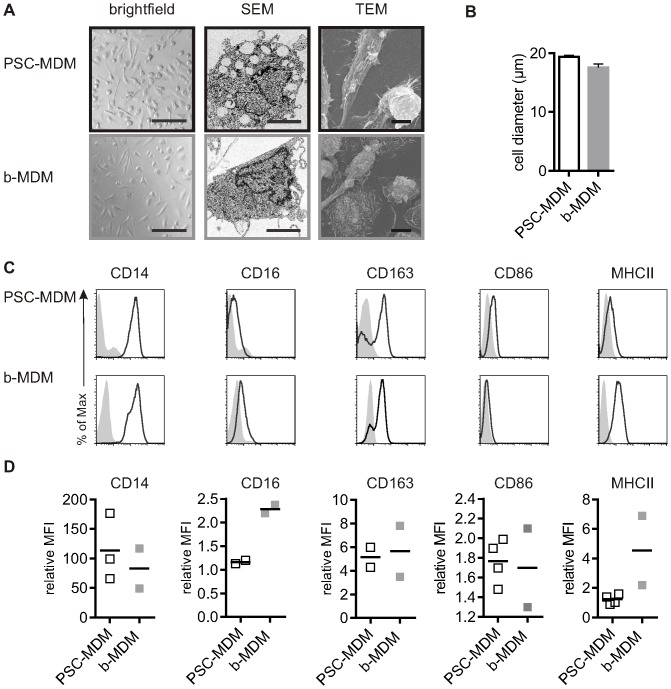
Human macrophages are specialised hosts for HIV-1, dengue virus, Leishmania and Mycobacterium tuberculosis. Yet macrophage research is hampered by lack of appropriate cell models for modelling infection by these human pathogens, because available myeloid cell lines are, by definition, not terminally differentiated like tissue macrophages. We describe here a method for deriving monocytes and macrophages from human Pluripotent Stem Cells which improves on previously published protocols in that it uses entirely defined, feeder- and serum-free culture conditions and produces very consistent, pure, high yields across both human Embryonic Stem Cell (hESC) and multiple human induced Pluripotent Stem Cell (hiPSC) lines over time periods of up to one year. Cumulatively, up to ∼3×10(7) monocytes can be harvested per 6-well plate. The monocytes produced are most closely similar to the major blood monocyte (CD14(+), CD16(low), CD163(+)). Differentiation with M-CSF produces macrophages that are highly phagocytic, HIV-1-infectable, and upon activation produce a pro-inflammatory cytokine profile similar to blood monocyte-derived macrophages. Macrophages are notoriously hard to genetically manipulate, as they recognise foreign nucleic acids; the lentivector system described here overcomes this, as pluripotent stem cells can be relatively simply genetically manipulated for efficient transgene expression in the differentiated cells, surmounting issues of transgene silencing. Overall, the method we describe here is an efficient, effective, scalable system for the reproducible production and genetic modification of human macrophages, facilitating the interrogation of human macrophage biology.
Overview
The claims and statistics of this paper haven’t been checked yet.
Run the check — free, no account needed. It reads the open-access text and checks the sources it cites.
Integrity signals
Registry
Cites
Statistics
Figures
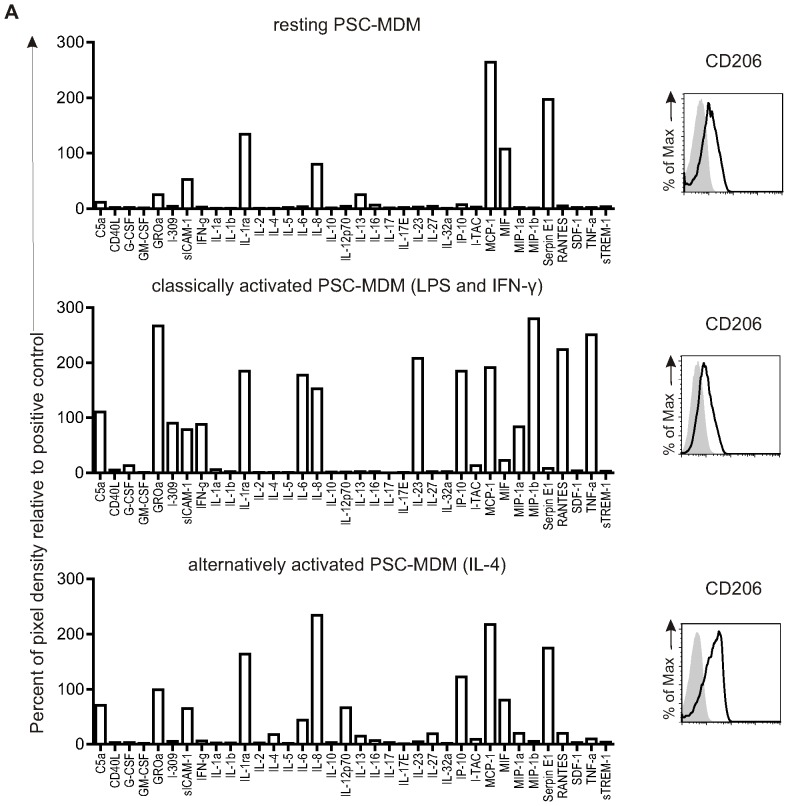
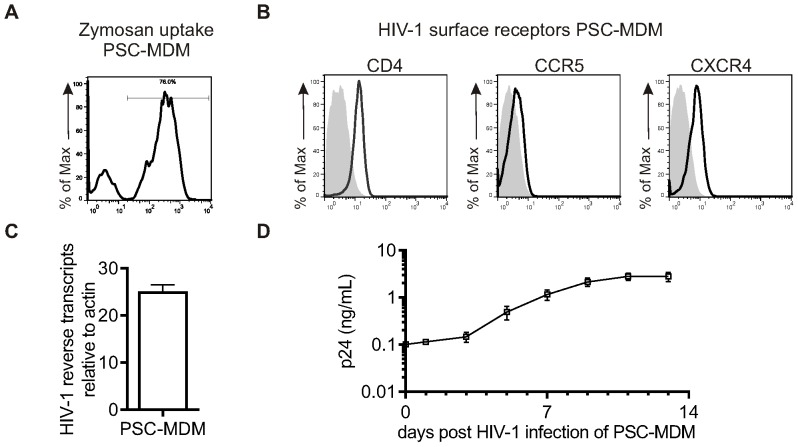
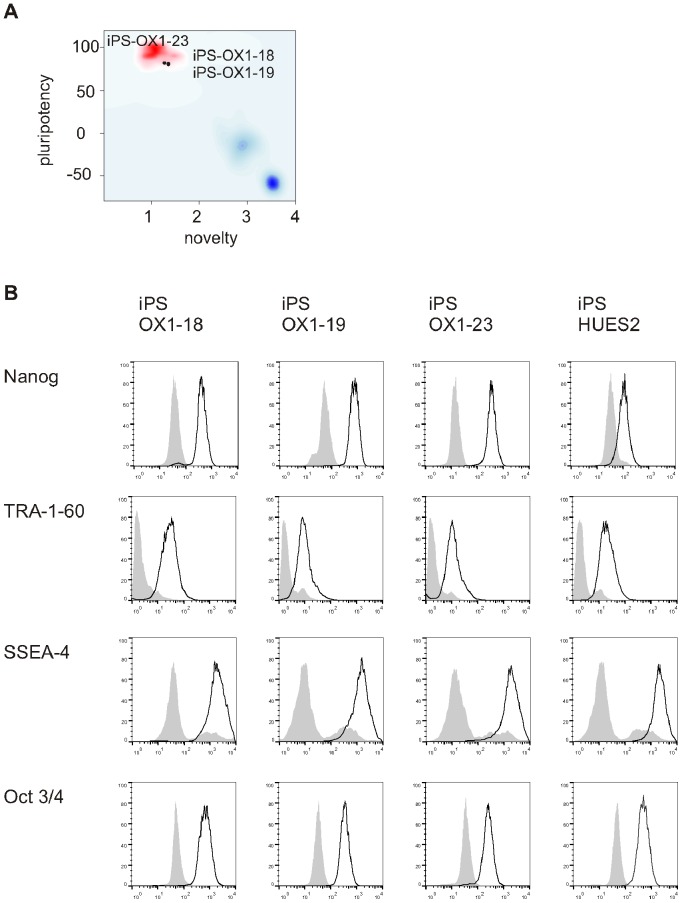
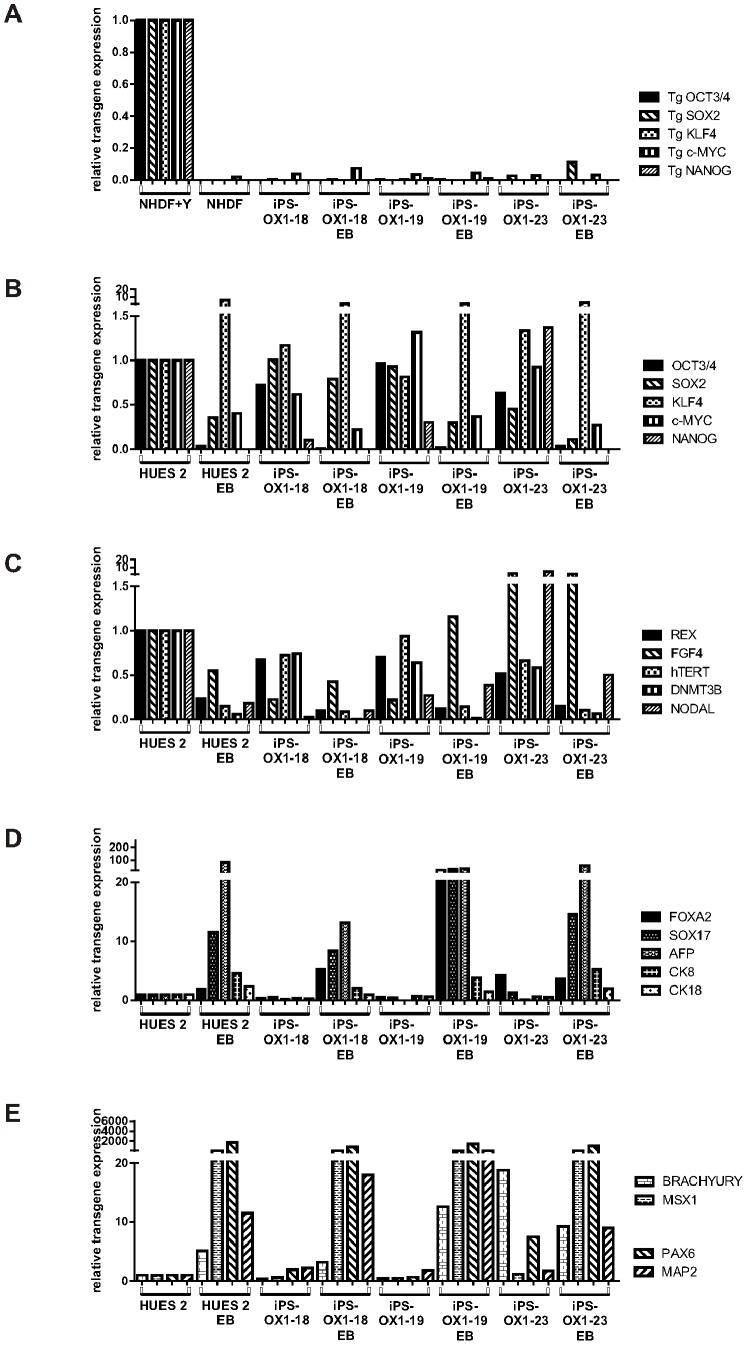
Verification
Claims the paper makes
The claims and statistics of this paper haven’t been checked yet.
Run the check — free, no account needed. It reads the open-access text and checks the sources it cites.
Claims other papers make about this one
Each is checked against this paper’s own text: does it say what the citing paper says it does?
The source backs part of the claim, not all of it — or backs it for a different population, condition or comparison.
In the citing paper
“Importantly, these cells closely match tissue macrophages at both transcriptional and functional levels (184–186).”
From Targeting macrophages in liver fibrosis (2026) · cites this paper as [185]
Experimental — accuracy not yet measuredThe cited source says what the claim attributes to it.
In the citing paper
“The cumulative yield of pMacpre for the lines used in this study was 10- to 43-fold higher than the number of input iPSCs, consistent with yields previously reported for this protocol (van Wilgenburg et al., 2013), similar to a recently published hiPS-microglia protocol (typically 40-fold) (Abud et al., 2017), and 10-fold higher than two other recently published hiPS-microglia protocols (0.5- to 4”
From A highly efficient human pluripotent stem cell microglia model displays a neuronal-co-culture-specific expression profile and inflammatory response (2017) · cites this paper as van Wilgenburg et al., 2013
The cited source says what the claim attributes to it.
In the citing paper
“In 2008, we derived human PSC macrophages using a very simple methodology without OP9 feeders (Karlsson et al., 2008), which we subsequently adapted to a fully defined, robust serum-free protocol (van Wilgenburg et al., 2013), now widely used by others (Aflaki et al., 2014, Alasoo et al., 2015, Gupta et al., 2016).”
From A highly efficient human pluripotent stem cell microglia model displays a neuronal-co-culture-specific expression profile and inflammatory response (2017) · cites this paper as van Wilgenburg et al., 2013
Self-check
Percentages, sums and reported differences re-computed from the paper’s own numbers.
The self-check needs the paper’s full text.
Citations
Cites
THE USE OF LEAD CITRATE AT HIGH pH AS AN ELECTRON-OPAQUE STAIN IN ELECTRON MICROSCOPY
Reynolds, E. S. (1963) · The Journal of Cell Biology · doi:10.1083/jcb.17.1.208 · Cited by 24,938
Induction of Pluripotent Stem Cells from Adult Human Fibroblasts by Defined Factors
Takahashi, K., Tanabe, K., Ohnuki, M., Narita, M., Ichisaka, T., Tomoda, K., & Yamanaka, S. (2007) · Cell · doi:10.1016/j.cell.2007.11.019 · Cited by 20,221
Embryonic Stem Cell Lines Derived from Human Blastocysts
Thomson, J. A., Itskovitz‐Eldor, J., Shapiro, S. S., Waknitz, M. A., Swiergiel, J. J., Marshall, V. S., & Jones, J. M. (1998) · Science · doi:10.1126/science.282.5391.1145 · Cited by 15,947
The chemokine system in diverse forms of macrophage activation and polarization
MANTOVANI, A., SICA, A., SOZZANI, S., ALLAVENA, P., VECCHI, A., & LOCATI, M. (2004) · Trends in Immunology · doi:10.1016/j.it.2004.09.015 · Cited by 6,534
Fate Mapping Reveals Origins and Dynamics of Monocytes and Tissue Macrophages under Homeostasis
Yona, S., Kim, K.-W., Wolf, Y., Mildner, A., Varol, D., Breker, M., Strauss-Ayali, D., Viukov, S., Guilliams, M., Misharin, A., et al. (2013) · Immunity · doi:10.1016/j.immuni.2012.12.001 · Cited by 3,245
A Lineage of Myeloid Cells Independent of Myb and Hematopoietic Stem Cells
Schulz, C., Perdiguero, E. G., Chorro, L., Szabo-Rogers, H., Cagnard, N., Kierdorf, K., Prinz, M., Wu, B., Jacobsen, S. E. W., Pollard, J. W., et al. (2012) · Science · doi:10.1126/science.1219179 · Cited by 2,578
Multiply attenuated lentiviral vector achieves efficient gene delivery in vivo
Zufferey, R., Nagy, D., Mandel, R. J., Naldini, L., & Trono, D. (1997) · Nature Biotechnology · doi:10.1038/nbt0997-871 · Cited by 1,977
Stein, M., Keshav, S., Harris, N., & Gordon, S. (1992) · The Journal of experimental medicine · doi:10.1084/jem.176.1.287 · Cited by 1,960
Feeder-free growth of undifferentiated human embryonic stem cells
Xu, C., Inokuma, M. S., Denham, J., Golds, K., Kundu, P., Gold, J. D., & Carpenter, M. K. (2001) · Nature Biotechnology · doi:10.1038/nbt1001-971 · Cited by 1,872
The CD14+ CD16+ blood monocytes: their role in infection and inflammation
Ziegler‐Heitbrock, L. (2006) · Journal of Leukocyte Biology · doi:10.1189/jlb.0806510 · Cited by 1,045
Research works printed but not linked: 1
- K Karlsson, 2008, Homogeneous monocytes and macrophages from human embryonic stem cells following coculture-free differentiation in M-CSF and IL-3, Experimental hematology, 36, 1167, 10.1016/j.exphem.2008.04.009 · DOI · Paper page
Cited by
Sorted by citations
Haenseler, W., Sansom, S. N., Buchrieser, J., Newey, S. E., Moore, C. S., Nicholls, F. J., Chintawar, S., Schnell, C., Antel, J. P., Allen, N. D., et al. (2017) · Stem Cell Reports · doi:10.1016/j.stemcr.2017.05.017 · Cited by 593
Self-citationMAIT cells are activated during human viral infections
van Wilgenburg, B., Scherwitzl, I., Hutchinson, E. C., Leng, T., Kurioka, A., Kulicke, C. A., de Lara, C., Cole, S., Vasanawathana, S., Limpitikul, W., et al. (2016) · Nature Communications · doi:10.1038/ncomms11653 · Cited by 515
Self-citationFernandes, H. J. R., Hartfield, E. M., Christian, H., Emmanoulidou, E., Zheng, Y. H., Booth, H., Bogetofte, H., Lang, C., Ryan, B. J., Sardi, S. P., et al. (2016) · Stem Cell Reports · doi:10.1016/j.stemcr.2016.01.013 · Cited by 363
Self-citationMycobacterium tuberculosis infection of host cells in space and time
Bussi, C., & Gutierrez, M. G. (2019) · FEMS Microbiology Reviews · doi:10.1093/femsre/fuz006 · Cited by 356
Use of the CRISPR/Cas9 system as an intracellular defense against HIV-1 infection in human cells
Liao, H., Gu, Y., Diaz, A., Marlett, J. M., Takahashi, Y., Li, M., Suzuki, K., Xu, R., Hishida, T., Chang, C.-J., et al. (2015) · Nature Communications · doi:10.1038/ncomms7413 · Cited by 352
Metadata
- Authors
- Wilgenburg, B. V., Browne, C., Vowles, J., & Cowley, S. A.
- Affiliations
- University of Oxford (GB)
- Corresponding author
- Cowley, Sally A.
- Venue
- PLoS ONE
- Publisher
- Public Library of Science (PLoS)
- Published
- 2013-08-12
- Volume
- 8
- Issue
- 8
- Pages
- e71098
- ISSN
- 1932-6203 (ISSN-L)
- PMC
- PMC3741356
- OpenAlex
- W2121999038
- Cited by
- 353
- References
- 44
- Citations by year
- 2026: 34 · 2025: 30 · 2024: 50 · 2023: 37 · 2022: 39 · 2021: 36 · 2020: 35 · 2019: 19 · 2018: 27 · 2017: 18 · 2016: 13 · 2015: 10 · 2014: 3 · 2013: 2
- FWCI
- 4.18
- Type
- journal article
- Language
- en
- Open access
- gold
- doi.org
- Locations
- PLoS ONE (publishedVersion, cc-by)
- Europe PMC (PubMed Central) (publishedVersion, other-oa)
- PubMed Central (publishedVersion, cc-by)
- PubMed (publishedVersion)
- DOAJ (DOAJ: Directory of Open Access Journals) (submittedVersion, cc-by-sa)
- Figshare (submittedVersion, cc-by)
- Funders
- Wellcome Trust (91070, WT082260, G090074791070, G0900747, LC0910-004, 090532, 090532/Z/09/Z, 090532/Z/09/, 090532/Z)
- Parkinson's UK (J-0901)
- Medical Research Council (G0900747 91070, Hub grant G0900747 91070, 090532/Z09/Z)
- Topics
- Life Sciences › Biochemistry, Genetics and Molecular Biology › Molecular Biology › Pluripotent Stem Cells Research
- Life Sciences › Biochemistry, Genetics and Molecular Biology › Cell Biology › Mesenchymal stem cell research
- Health Sciences › Medicine › Hematology › Hematopoietic Stem Cell Transplantation
- Keywords
- monocyte-derived macrophages, human pluripotent stem cells, human embryonic stem cells, human induced pluripotent stem cells, defined culture conditions, serum-free culture, HIV-1 infection, lentiviral transduction, transgene expression, macrophage phagocytosis, inflammatory cytokines, macrophage infection model
- MeSH terms
- Cell Differentiation, Cell Line, Culture Media, Gene Expression Regulation, Humans, Macrophages, Monocytes, Phagocytosis, Phenotype, HIV-1, Macrophage Colony-Stimulating Factor, Cell Culture Techniques, Polymorphism, Single Nucleotide, Pluripotent Stem Cells, Embryonic Stem Cells, Induced Pluripotent Stem Cells
About these checks
Registry, retraction, Cites and statistics results are computed, not judged, with one exception: a printed reference that no index lists is read once by a model before it counts as a citation error. Claims are extracted by a model and kept only when their quote appears verbatim in the text; each cited source is then checked, with a model’s help, for whether it says what the claim relies on. Those verdicts can be wrong — read the claim’s quote and the cited source before relying on one.
Statistics and arithmetic are recomputed, not judged.
Confidence bands are shown only for fields calibrated on our annotated test set. None is calibrated yet, so no band is shown.
What counts as a claim ›How we measure confidence ›How we check this ›
Are you an author, or do you see a problem with this page? Request a review
