

The DOI matches its Crossref record; 78 of the 78 references it cites were found in a registry or an index.
New Insights into Somatic Embryogenesis: LEAFY COTYLEDON1, BABY BOOM1 and WUSCHEL-RELATED HOMEOBOX4 Are Epigenetically Regulated in Coffea canephora
Open accessAbstract
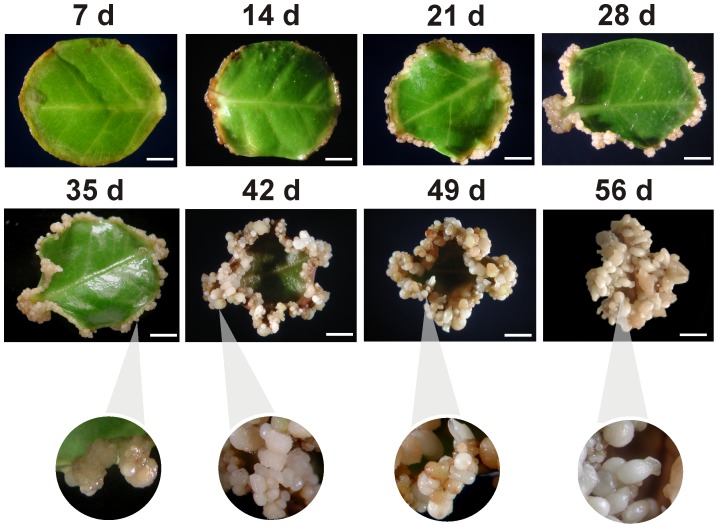
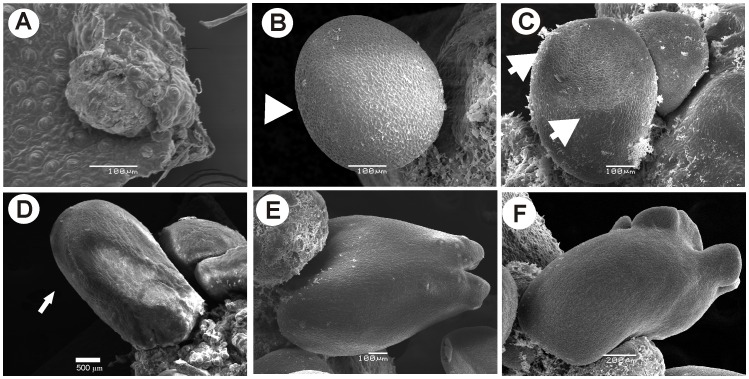
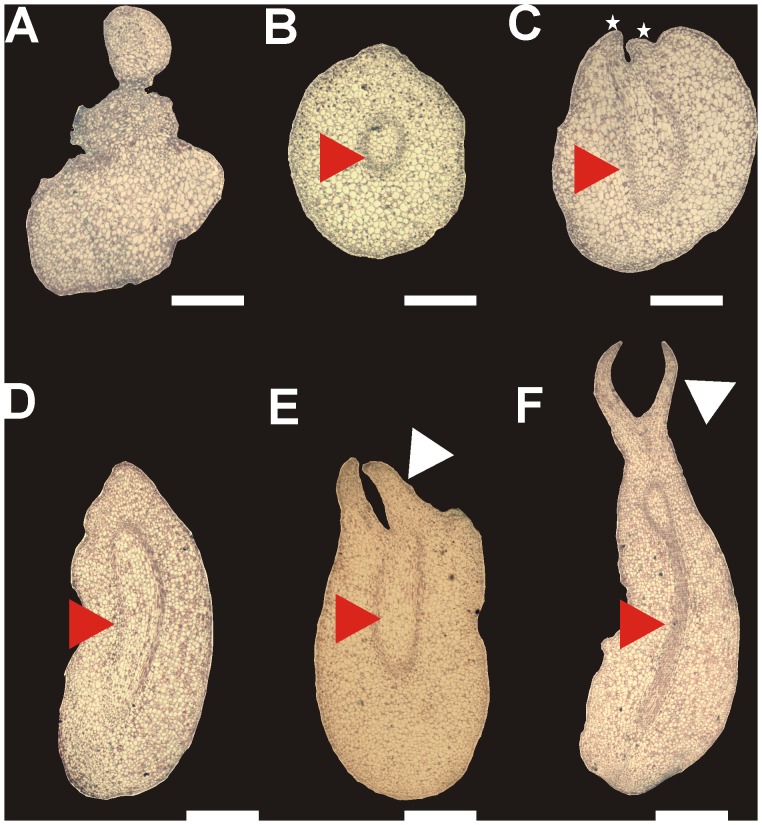
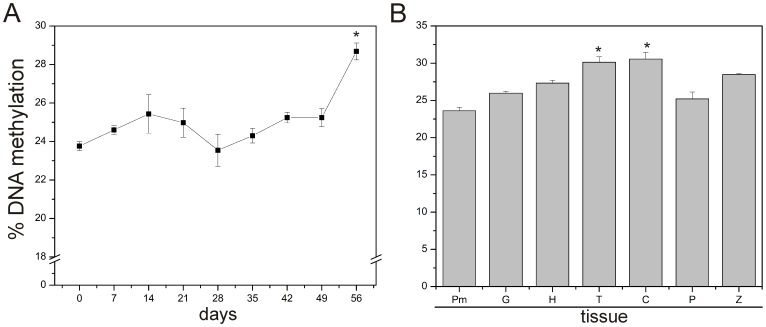
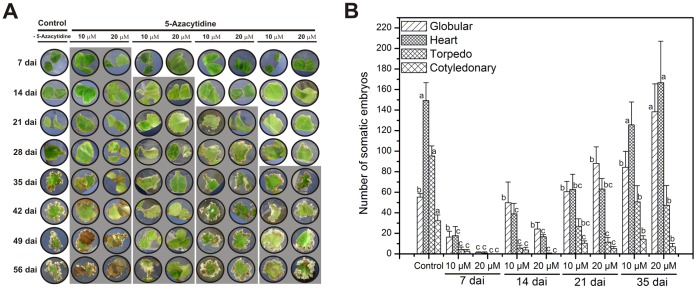
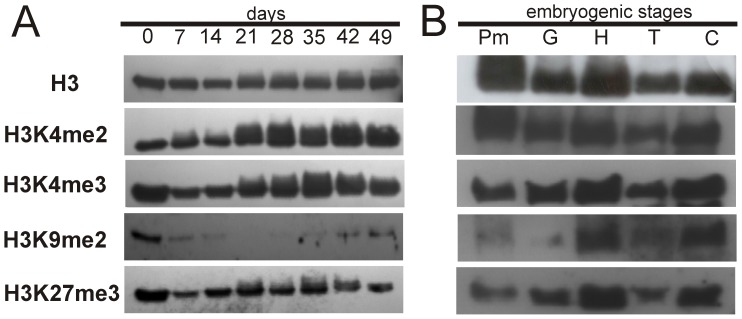
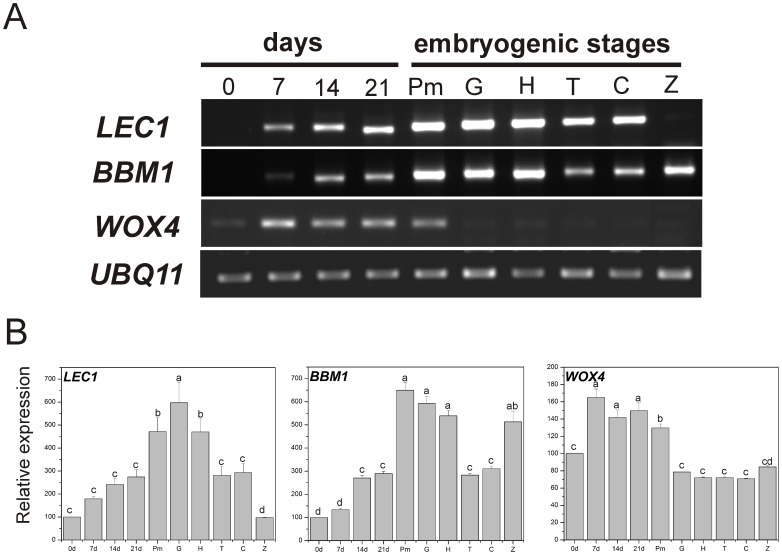
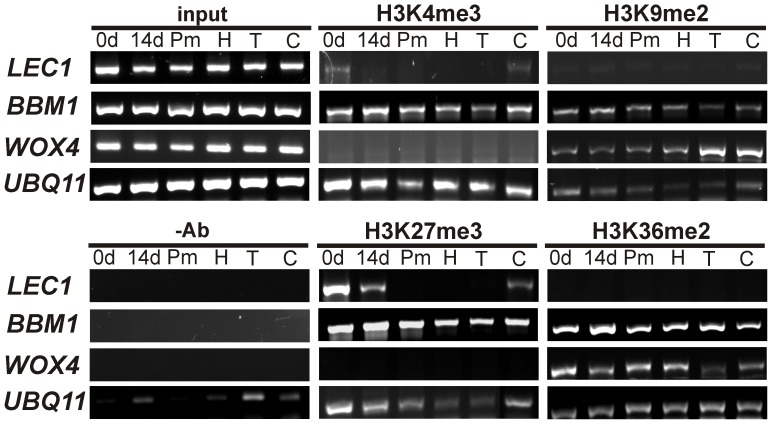
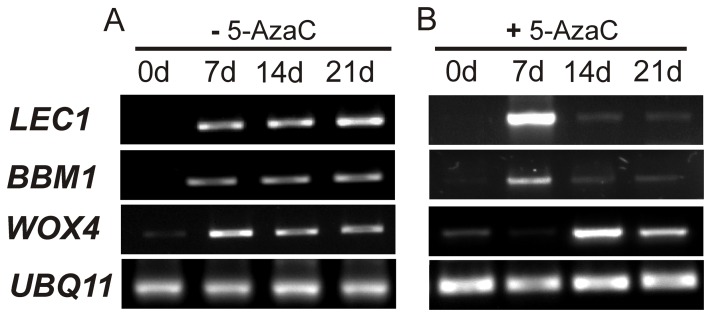
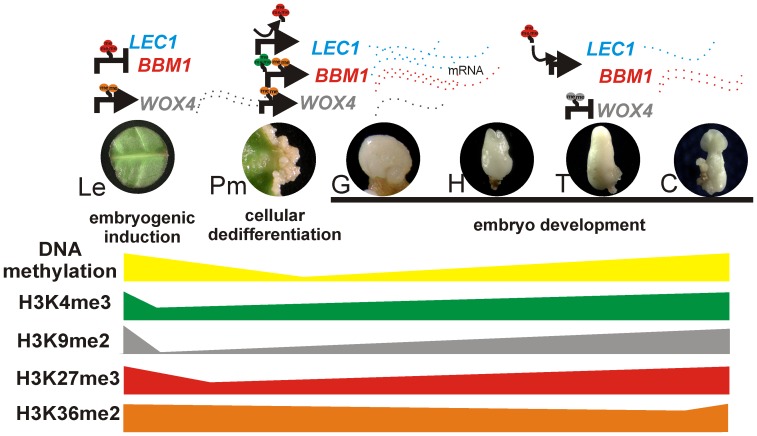
Plant cells have the capacity to generate a new plant without egg fertilization by a process known as somatic embryogenesis (SE), in which differentiated somatic cells can form somatic embryos able to generate a functional plant. Although there have been advances in understanding the genetic basis of SE, the epigenetic mechanism that regulates this process is still unknown. Here, we show that the embryogenic development of Coffea canephora proceeds through a crosstalk between DNA methylation and histone modifications during the earliest embryogenic stages of SE. We found that low levels of DNA methylation, histone H3 lysine 9 dimethylation (H3K9me2) and H3K27me3 change according to embryo development. Moreover, the expression of LEAFY cotyledon1 (LEC1) and BABY BOOM1 (BBM1) are only observed after SE induction, whereas WUSCHEL-related homeobox4 (WOX4) decreases its expression during embryo maturation. Using a pharmacological approach, it was found that 5-Azacytidine strongly inhibits the embryogenic response by decreasing both DNA methylation and gene expression of LEC1 and BBM1. Therefore, in order to know whether these genes were epigenetically regulated, we used Chromatin Immunoprecipitation (ChIP) assays. It was found that WOX4 is regulated by the repressive mark H3K9me2, while LEC1 and BBM1 are epigenetically regulated by H3K27me3. We conclude that epigenetic regulation plays an important role during somatic embryogenic development, and a molecular mechanism for SE is proposed.
Overview
The claims and statistics of this paper haven’t been checked yet.
Run the check — free, no account needed. It reads the open-access text and checks the sources it cites.
Integrity signals
Registry
Cites
Statistics
Figures
Verification
Claims the paper makes
The claims and statistics of this paper haven’t been checked yet.
Run the check — free, no account needed. It reads the open-access text and checks the sources it cites.
Claims other papers make about this one
Each is checked against this paper’s own text: does it say what the citing paper says it does?
The cited source says what the claim attributes to it.
In the citing paper
“Dynamic changes in DNA SE progression. methylation and histone modifications accompany”
From Somaclonal Variation and Clonal Fidelity in Commercial Micropropagation: Challenges and Perspectives (2025) · cites this paper as [102]
Self-check
Percentages, sums and reported differences re-computed from the paper’s own numbers.
The self-check needs the paper’s full text.
Citations
Cites
A Revised Medium for Rapid Growth and Bio Assays with Tobacco Tissue Cultures
Murashige, T., & Skoog, F. K. (1962) · Physiologia Plantarum · doi:10.1111/j.1399-3054.1962.tb08052.x · Cited by 67,420
Chromatin modifications and their function
Kouzarides, T. (2007) · Cell · doi:10.1016/j.cell.2007.02.005 · Cited by 10,883
Regulation of chromatin by histone modifications
Bannister, A. J., & Kouzarides, T. (2011) · Cell Research · doi:10.1038/cr.2011.22 · Cited by 6,012
The WUSCHEL gene is required for shoot and floral meristem integrity in Arabidopsis
Laux, T., Mayer, K., Berger, J., & Jürgens, G. (1996) · Development · doi:10.1242/dev.122.1.87 · Cited by 1,270
Epigenetic Reprogramming in Plant and Animal Development
Feng, S., Jacobsen, S. E., & Reik, W. (2010) · Science · doi:10.1126/science.1190614 · Cited by 1,199
Ectopic Expression of BABY BOOM Triggers a Conversion from Vegetative to Embryonic Growth
Boutilier, K., Offringa, R., Sharma, V. K., Kieft, H., Ouellet, T., Zhang, L., Hattori, J., Liu, C., van Lammeren, A. A. M., Miki, B. L. A., et al. (2002) · The Plant Cell · doi:10.1105/tpc.001941 · Cited by 1,081
Arabidopsis LEAFY COTYLEDON1 Is Sufficient to Induce Embryo Development in Vegetative Cells
Lotan, T., Ohto, M., Yee, K. M., West, M. A. L., Lo, R. S., Kwong, R. W., Yamagishi, K., Fischer, R. L., Goldberg, R. B., & Harada, J. J. (1998) · Cell · doi:10.1016/s0092-8674(00)81463-4 · Cited by 1,063
Stressful “memories” of plants: Evidence and possible mechanisms
Bruce, T. J. A., Matthes, M. C., Napier, J. A., & Pickett, J. A. (2007) · Plant Science · doi:10.1016/j.plantsci.2007.09.002 · Cited by 1,025
Haecker, A., Groß‐Hardt, R., Geiges, B., Sarkar, A. K., Breuninger, H., Herrmann, M., & Laux, T. (2004) · Development · doi:10.1242/dev.00963 · Cited by 894
Seasonal and developmental timing of flowering
Amasino, R. M. (2010) · The Plant Journal · doi:10.1111/j.1365-313x.2010.04148.x · Cited by 892
Cited by
Sorted by citations
Items 101–172 of 172
Zhang, W., Xie, X., Le, L., & Cao, F. (2024) · Forests · doi:10.3390/f15020376 · Cited by 7
Pessoa, H. P., da Silva, L. J., Chagas, R. R., Copati, M. G. F., Dariva, F. D., Dias, F. D. O., & Nick, C. (2021) · Scientia Horticulturae · doi:10.1016/j.scienta.2021.110134 · Cited by 7
Gao, Y., Chen, X., Liu, C., Zhao, H., Dai, F., Zhao, J. H., Zhang, J., & Kong, L. (2023) · Forestry Research · doi:10.48130/fr-0023-0030 · Cited by 6
Zhong, S., Gao, Y., Lu, J., Ding, C., Su, X., & Zhang, B. (2020) · Journal of Plant Biochemistry and Biotechnology · doi:10.1007/s13562-020-00600-w · Cited by 6
Marraccini, P. (2020) · Progress in botany · doi:10.1007/124_2020_42 · Cited by 6
Retroelements and DNA Methylation Could Contribute to Diversity of 5S rDNA in Agave L.
Tamayo-Ordóñez, Y. D. J., Narváez-Zapata, J. A., Tamayo‐Ordoñez, M. C., & Sánchez‐Teyer, L. F. (2018) · Journal of Molecular Evolution · doi:10.1007/s00239-018-9856-6 · Cited by 6
Plants and Small Molecules: An Up-and-Coming Synergy
Lepri, A., Longo, C., Messore, A., Kazmi, H., Madia, V. N., Santo, R. D., Costi, R., & Vittorioso, P. (2023) · Plants · doi:10.3390/plants12081729 · Cited by 6
Ramkumar, T. R., Kanchan, M., & Sembi, J. K. (2020) · Plant Science Today · doi:10.14719/pst.2020.7.2.703 · Cited by 6
MiRNA expression analysis during somatic embryogenesis in Coffea canephora
Castellano, S., Andrade-Marcial, M., Aguilar-Méndez, E. D., Loyola-Vargas, V. M., de Folter, S., & De‐la‐Peña, C. (2022) · Plant Cell Tissue and Organ Culture (PCTOC) · doi:10.1007/s11240-022-02258-9 · Cited by 5
Self-citationEffects of somatic embryogenesis on gene expression of cloned coffee heterozygous hybrids
de Oliveira, K. C., Guimarães, P. D. S., Bazioli, J. M., Martinati, J. C., dos Santos, M. M., Padilha, L., Filho, O. G., & Maluf, M. P. (2019) · Acta Physiologiae Plantarum · doi:10.1007/s11738-019-2917-7 · Cited by 5
Molecular analysis of ERF subfamily genes during coffee somatic embryogenesis
Daúde, M. M., Freitas, N. C., Ságio, S. A., Paiva, L. V., & Barreto, H. G. (2020) · In Vitro Cellular & Developmental Biology - Plant · doi:10.1007/s11627-020-10120-w · Cited by 5
Androgenic-Induced Transposable Elements Dependent Sequence Variation in Barley
Orłowska, R., Pachota, K. A., Dynkowska, W. M., Niedziela, A., & Bednarek, P. T. (2021) · International Journal of Molecular Sciences · doi:10.3390/ijms22136783 · Cited by 5
Tomasiak, A., Sala, K., Berg, L. S., Brąszewska-Zalewska, A., & Betekhtin, A. (2023) · Plant Cell Tissue and Organ Culture (PCTOC) · doi:10.1007/s11240-023-02595-3 · Cited by 5
The Role of Small RNAs in Plant Somatic Embryogenesis
López-Ruíz, B. A., Juárez-González, V. T., Lujan, E., & Dinkova, T. D. (2019) · Springer eBooks · doi:10.1007/978-3-030-14760-0_12 · Cited by 5
Wang, Y., Lin, M.-Z., Huang, B., Chung, H., & Chen, J. (2018) · Acta Biologica Cracoviensia s Botanica · doi:10.24425/118053 · Cited by 5
Etienne, H., Breitler, J., Brossier, J.-R., Awada, R., Laflaquière, L., Amara, I., & Georget, F. (2024) · Advances in botanical research · doi:10.1016/bs.abr.2024.04.008 · Cited by 4
Santos, E. L. D., Filho, J. C. B., Hansel, F. A., Sousa, J. A. T., Auer, C. G., Steiner, N., & Degenhardt-Goldbach, J. (2023) · Plant Cell Tissue and Organ Culture (PCTOC) · doi:10.1007/s11240-023-02584-6 · Cited by 4
Oliveira, J. P. D. M., Sanglard, N. A., Ferreira, A., & Clarindo, W. R. (2021) · Plant Cell Tissue and Organ Culture (PCTOC) · doi:10.1007/s11240-021-02093-4 · Cited by 4
Oliveira, J. P. D. M., Sanglard, N. A., Ferreira, A., & Clarindo, W. R. (2021) · Forests · doi:10.3390/f12111536 · Cited by 4
Эпигенетические механизмы и их роль в развитии растений, "Генетика"
Lebedeva, M. A., Tvorogova, V. E., & Тиходеев, О. Н. (2017) · Генетика · doi:10.7868/s0016675817090089 · Cited by 4
Somatic embryogenesis-related gene expression and functional genomics in mangosteen
Fadryin, N., Rohani, E. R., Mohamed‐Hussein, Z., & Noor, N. M. (2018) · Plant Gene · doi:10.1016/j.plgene.2018.07.002 · Cited by 4
Li, L., Miao, J., Liu, J., Gui, M., Tang, M., Hai, T., Shi, W., Liang, G.-P., & Sun, X.-L. (2025) · Plant Cell Tissue and Organ Culture (PCTOC) · doi:10.1007/s11240-025-03053-y · Cited by 3
Genetic and epigenetic alterations associated with somatic embryogenesis in Argania spinosa
Lamaoui, M., & Chakhchar, A. (2025) · Plant Biotechnology Reports · doi:10.1007/s11816-025-00999-5 · Cited by 3
Niu, Y.-X., Wu, Q.-Y., Ren, S.-N., Won, J. H., & Wang, H. (2025) · Plant Physiology and Biochemistry · doi:10.1016/j.plaphy.2025.110811 · Cited by 3
NABILAH, S., Handoyo, T., Kim, K., & Ubaidillah, M. (2022) · Biocell · doi:10.32604/biocell.2022.019111 · Cited by 3
Transcriptional Dynamics Underlying Somatic Embryogenesis in Coffea canephora
Couoh-Cauich, M.-D., Méndez-Hernández, H. A., Galaz-Ávalos, R. M., Quintana-Escobar, A. O., Ibarra‐Laclette, E., & Loyola-Vargas, V. M. (2025) · Plants · doi:10.3390/plants14071108 · Cited by 3
Self-citationThe Current Status of Proteomic Studies in Somatic Embryogenesis
Mata‐Rosas, M., Quiroz‐Figueroa, F. R., Shannon, L. M., & Ruíz-May, E. (2016) · Springer eBooks · doi:10.1007/978-3-319-33705-0_7 · Cited by 3
Garrido‐Bigotes, A., Silva, H., & Hasbún, R. (2021) · Agronomy · doi:10.3390/agronomy11020356 · Cited by 3
Nandety, R. S., Oh, S., Lee, H., Krom, N., Gupta, R., & Mysore, K. S. (2024) · The Plant Journal · doi:10.1111/tpj.16744 · Cited by 3
Somaclonal Variation in Conifers
Sarmast, M. K., Ghaleh, Z. R., & Alizadeh, M. (2024) · Springer eBooks · doi:10.1007/978-3-031-51626-9_7 · Cited by 4
Orłowska, A., & Kępczyńska, E. (2020) · Plant Cell Tissue and Organ Culture (PCTOC) · doi:10.1007/s11240-020-01854-x · Cited by 3
Rejuvenation through somatic embryogenesis: epigenetic and telomeric reset in Melia volkensii
Suresh, N. B., Aronen, T. S., Magomere, T., & Werbrouck, S. (2026) · Plant Cell Tissue and Organ Culture (PCTOC) · doi:10.1007/s11240-026-03382-6 · Cited by 2
Into the Unknown: Hints to Overcome Recalcitrance in Woody Fruit Crops
Marino, L. A., Botta, R., Moglia, A., Ruffa, P., Silvestri, C., Marinoni, D. T., & Pavese, V. (2026) · Journal of Plant Growth Regulation · doi:10.1007/s00344-026-12211-1 · Cited by 2
Applications of omics technologies in Coffea
Mishra, M. K., Jingade, P., & Huded, A. K. C. (2022) · Elsevier eBooks · doi:10.1016/b978-0-323-89905-5.00009-4 · Cited by 2
Effects of Epigenetic Inhibitors on Somatic Embryogenesis in Wheat (Triticum aestivum L.)
Uçar, S., & Aydın, M. (2024) · Iranian Journal of Science · doi:10.1007/s40995-024-01679-9 · Cited by 2
Carrillo-Bermejo, E. A., Brito-Argáez, L. G., Galaz-Ávalos, R. M., Barredo-Pool, F., Loyola-Vargas, V. M., & Aguilar‐Hernández, V. (2024) · PeerJ · doi:10.7717/peerj.18372 · Cited by 2
Self-citationGarrocho-Villegas, V., Aguilar, R., & de Jiménez, E. S. (2017) · In Vitro Cellular & Developmental Biology - Plant · doi:10.1007/s11627-017-9808-7 · Cited by 2
Restanto, D. P., Farlisa, V. Y., Dewanti, P., Hariyono, K., & Handoyo, T. (2022) · Agriprima Journal of Applied Agricultural Sciences · doi:10.25047/agriprima.v6i2.448 · Cited by 2
da Paschoa, R. P., Xavier, L. R., Corrêa, C. C. G., Vieira, K. D. S., Pacheco, D. D. R., Gomes, L. D. E. S., da Silva, C. E. A., Alves, L. E. D. O., Pinto, V. B., Santa‐Catarina, C., et al. (2026) · Journal of Proteomics · doi:10.1016/j.jprot.2026.105602 · Cited by 1
Zdravković-Korać, S., Gašić, U. M., Jevremović, S. B., Uzelac, B., Belić, M., Ćalić, D., & Milojević, J. (2026) · Frontiers in Plant Science · doi:10.3389/fpls.2025.1736161 · Cited by 1
dos Santos, L. W., Clarindo, W. R., Saraiva, V. D. C., Oliveira, J. P. D. M., Amaral-Silva, P. M., Sattler, M. C., & Silva, J. C. (2024) · Plant Cell Tissue and Organ Culture (PCTOC) · doi:10.1007/s11240-024-02863-w · Cited by 1
Somatyczna embriogeneza: od odkrycia przez badania do praktycznego wykorzystania.
Mikuła, A., Tomiczak, K., Grzyb, M., & Tomaszewicz, W. (2022) · Postępy Biochemii · doi:10.18388/pb.2021_403 · Cited by 1
Awon, V. K., Dutta, D., Banerjee, S., Pal, S., & Gangopadhyay, G. (2024) · Figshare · doi:10.6084/m9.figshare.25282928
Awon, V. K., Dutta, D., Banerjee, S., Pal, S., & Gangopadhyay, G. (2024) · Figshare · doi:10.6084/m9.figshare.26684976
Awon, V. K., Dutta, D., Banerjee, S., Pal, S., & Gangopadhyay, G. (2024) · Figshare · doi:10.6084/m9.figshare.26684985
Awon, V. K., Dutta, D., Banerjee, S., Pal, S., & Gangopadhyay, G. (2024) · Figshare · doi:10.6084/m9.figshare.26684988
Awon, V. K., Dutta, D., Banerjee, S., Pal, S., & Gangopadhyay, G. (2024) · Figshare · doi:10.6084/m9.figshare.25282750
Awon, V. K., Dutta, D., Banerjee, S., Pal, S., & Gangopadhyay, G. (2024) · Figshare · doi:10.6084/m9.figshare.26684994
Awon, V. K., Dutta, D., Banerjee, S., Pal, S., & Gangopadhyay, G. (2024) · Figshare · doi:10.6084/m9.figshare.26684997
Awon, V. K., Dutta, D., Banerjee, S., Pal, S., & Gangopadhyay, G. (2024) · Figshare · doi:10.6084/m9.figshare.26685000
Awon, V. K., Dutta, D., Banerjee, S., Pal, S., & Gangopadhyay, G. (2024) · Figshare · doi:10.6084/m9.figshare.26684991
Awon, V. K., Dutta, D., Banerjee, S., Pal, S., & Gangopadhyay, G. (2024) · Figshare · doi:10.6084/m9.figshare.26684982
Awon, V. K., Dutta, D., Banerjee, S., Pal, S., & Gangopadhyay, G. (2024) · Figshare · doi:10.6084/m9.figshare.26685006
Awon, V. K., Dutta, D., Banerjee, S., Pal, S., & Gangopadhyay, G. (2024) · Figshare · doi:10.6084/m9.figshare.26684979
Awon, V. K., Dutta, D., Banerjee, S., Pal, S., & Gangopadhyay, G. (2024) · Figshare · doi:10.6084/m9.figshare.26685003
Pacheco, D. D. R., Xavier, L. R., da Silva, C. E. A., da Paschoa, R. P., Santa‐Catarina, C., & Silveira, V. (2026) · Plant Cell Tissue and Organ Culture (PCTOC) · doi:10.1007/s11240-026-03434-x
Optimization of In Vitro Regeneration in Wheat and Agrobacterium-mediated Rapid TransformationPreprint
Uçar, S., Kasapoğlu, A. G., Muslu, S., İlhan, E., Aydın, M., & Yiğider, E. (2026) · Research Square · doi:10.21203/rs.3.rs-9359045/v1
WUSCHEL in forest trees: evolutionary organizer, vascular architect, and totipotency switch
Zhong, S., Wang, S., & Cui, K. (2026) · Plant Molecular Biology · doi:10.1007/s11103-026-01721-x
Yang, J., Cui, J., Xing, J., Teng, X., & Shen, H. (2026) · Plant Cell Tissue and Organ Culture (PCTOC) · doi:10.1007/s11240-026-03522-y
Somatic embryogenesis in plants: unraveling the genetic and epigenetic factors
Ahmadabadi, M., & Dehghanian, Z. (2026) · Plant Cell Tissue and Organ Culture (PCTOC) · doi:10.1007/s11240-026-03523-x
In vitro CRISPR/Cas9–RNP cleavage of CcYUC1 in Coffea canephora
Uc‐Chuc, M. A., Aguilar‐Hernández, V., Jiménez‐Ramírez, I. A., Brito-Argáez, L. G., & Loyola-Vargas, V. M. (2026) · Planta · doi:10.1007/s00425-026-05115-7
Self-citationEpigenetic Regulation of Woody Plant In Vitro Culture: Mechanisms, Challenges, and Opportunities
Carneros, E., Inácio, V., Miguel, C. M., Testillano, P. S., Trontin, J., & Maury, S. (2026) · Springer eBooks · doi:10.1007/978-3-032-28071-8_2
Nawrocka, E., Fuchs, H., & Ratajczak, E. (2026) · Tree Physiology · doi:10.1093/treephys/tpag121
Guo, H., Guo, T., Fu, Y., Qin, X., Yang, Y., Chen, J., & Xu, J. (2026) · Industrial Crops and Products · doi:10.1016/j.indcrop.2026.124395
Epigenetic Gatekeepers of the Totipotent State
Kumar, P. (2026) · SpringerBriefs in plant science · doi:10.1007/978-981-92-1631-4_4
Metadata
- Authors
- Nic-Can, G. I., López-Torres, A., Barredo-Pool, F., Wrobel, K., Loyola-Vargas, V. M., Rojas-Herrera, R., & De-la-Peña, C.
- Affiliations
- Autonomous University of Yucatán (MX)
- Universidad de Guanajuato (MX)
- Centro de Investigación Científica de Yucatán, A.C (MX)
- Venue
- PLoS ONE
- Publisher
- Public Library of Science (PLoS)
- Published
- 2013-08-20
- Volume
- 8
- Issue
- 8
- Pages
- e72160
- ISSN
- 1932-6203 (ISSN-L)
- PMC
- PMC3748027
- OpenAlex
- W1983625874
- Cited by
- 164
- References
- 78
- Citations by year
- 2026: 14 · 2025: 6 · 2024: 20 · 2023: 13 · 2022: 13 · 2021: 14 · 2020: 26 · 2019: 13 · 2018: 14 · 2017: 7 · 2016: 13 · 2015: 7 · 2014: 4
- FWCI
- 3.59
- Type
- journal article
- Language
- en
- Open access
- gold
- doi.org
- Locations
- PLoS ONE (publishedVersion, cc-by)
- Europe PMC (PubMed Central) (publishedVersion, cc-by)
- PubMed Central (publishedVersion, cc-by)
- PubMed (publishedVersion)
- DOAJ (DOAJ: Directory of Open Access Journals) (submittedVersion, cc-by-sa)
- Figshare (submittedVersion, cc-by)
- Funders
- Consejo Nacional de Ciencia y Tecnología
- Topics
- Life Sciences › Agricultural and Biological Sciences › Plant Science › Plant tissue culture and regeneration
- Life Sciences › Biochemistry, Genetics and Molecular Biology › Molecular Biology › Epigenetics and DNA Methylation
- Life Sciences › Agricultural and Biological Sciences › Plant Science › Plant Molecular Biology Research
- Keywords
- somatic embryogenesis, Coffea canephora, epigenetic regulation, DNA methylation, histone modifications, H3K9me2, H3K27me3, WOX4, azacitidine, embryonic development, gene expression regulation
- MeSH terms
- Azacitidine, Histones, Plant Proteins, Protein Processing, Post-Translational, Seeds, Homeodomain Proteins, Gene Expression Regulation, Plant, Gene Expression Regulation, Developmental, DNA Methylation, CCAAT-Enhancer-Binding Proteins, Coffea, Epigenesis, Genetic, Plant Somatic Embryogenesis Techniques
About these checks
Registry, retraction, Cites and statistics results are computed, not judged, with one exception: a printed reference that no index lists is read once by a model before it counts as a citation error. Claims are extracted by a model and kept only when their quote appears verbatim in the text; each cited source is then checked, with a model’s help, for whether it says what the claim relies on. Those verdicts can be wrong — read the claim’s quote and the cited source before relying on one.
Statistics and arithmetic are recomputed, not judged.
Confidence bands are shown only for fields calibrated on our annotated test set. None is calibrated yet, so no band is shown.
What counts as a claim ›How we measure confidence ›How we check this ›
Are you an author, or do you see a problem with this page? Request a review
