

The DOI matches its Crossref record; 71 of the 71 references it cites were found in a registry or an index.
Four Centuries of Change in Northeastern United States Forests
Open accessAbstract
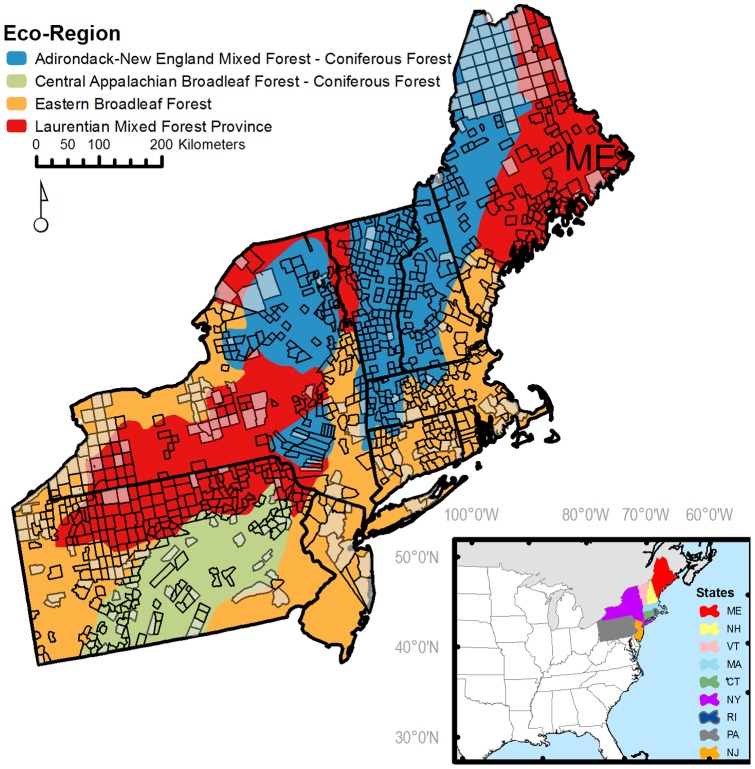
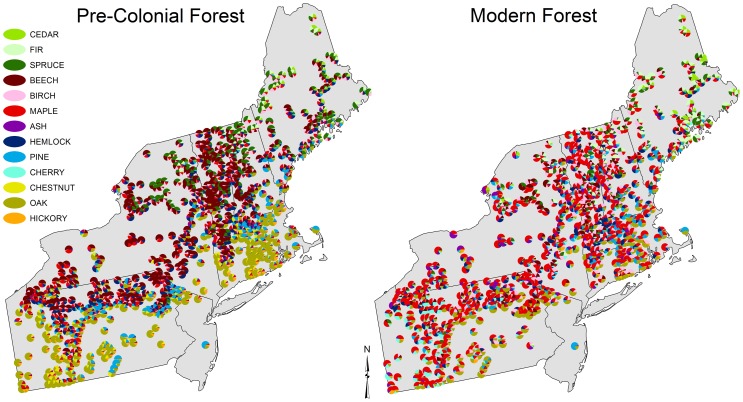
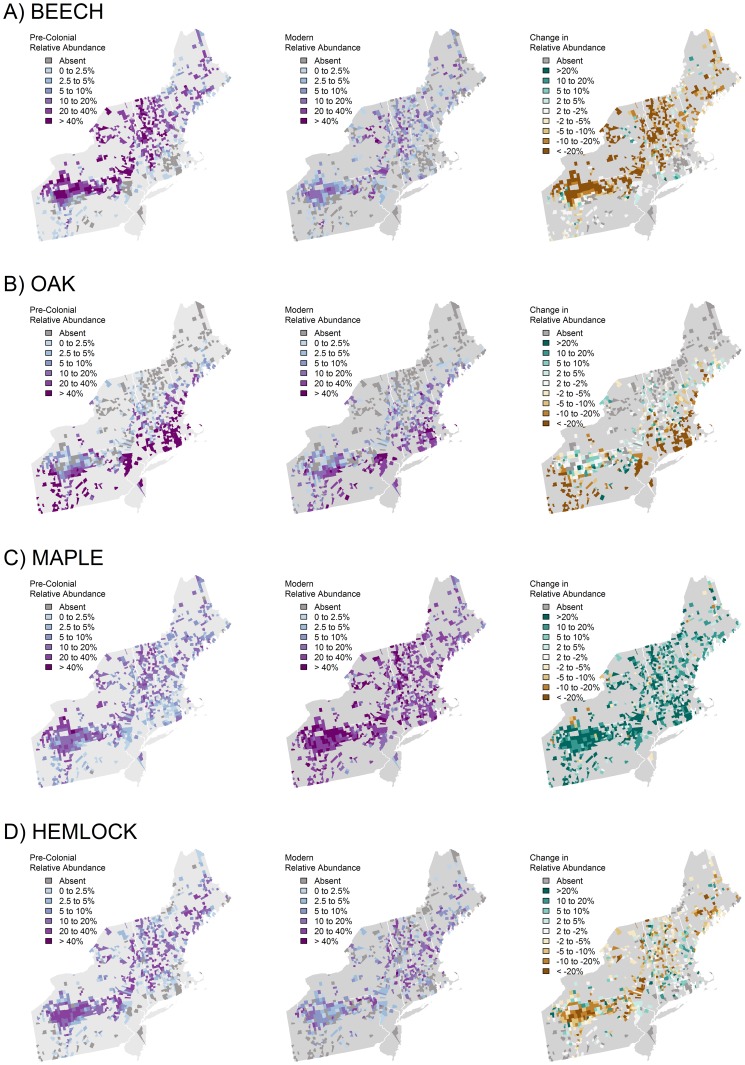
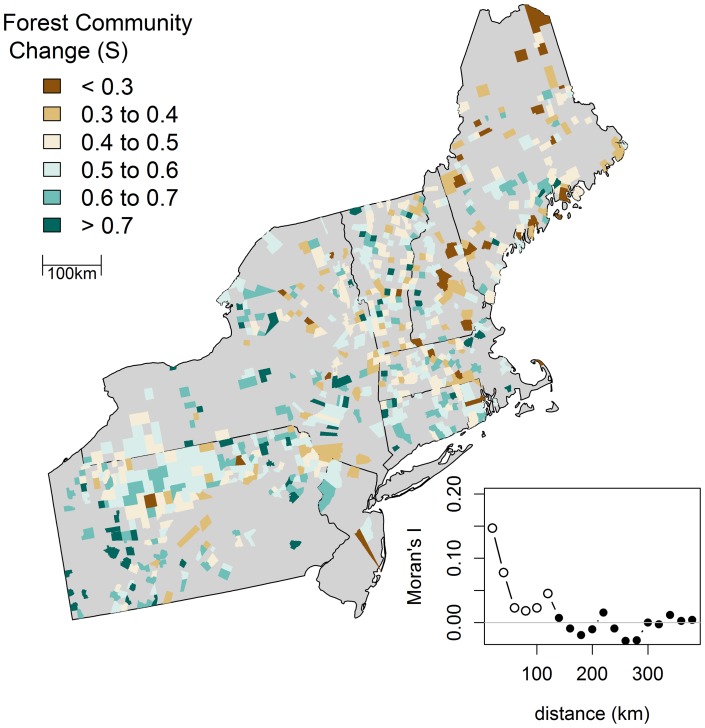
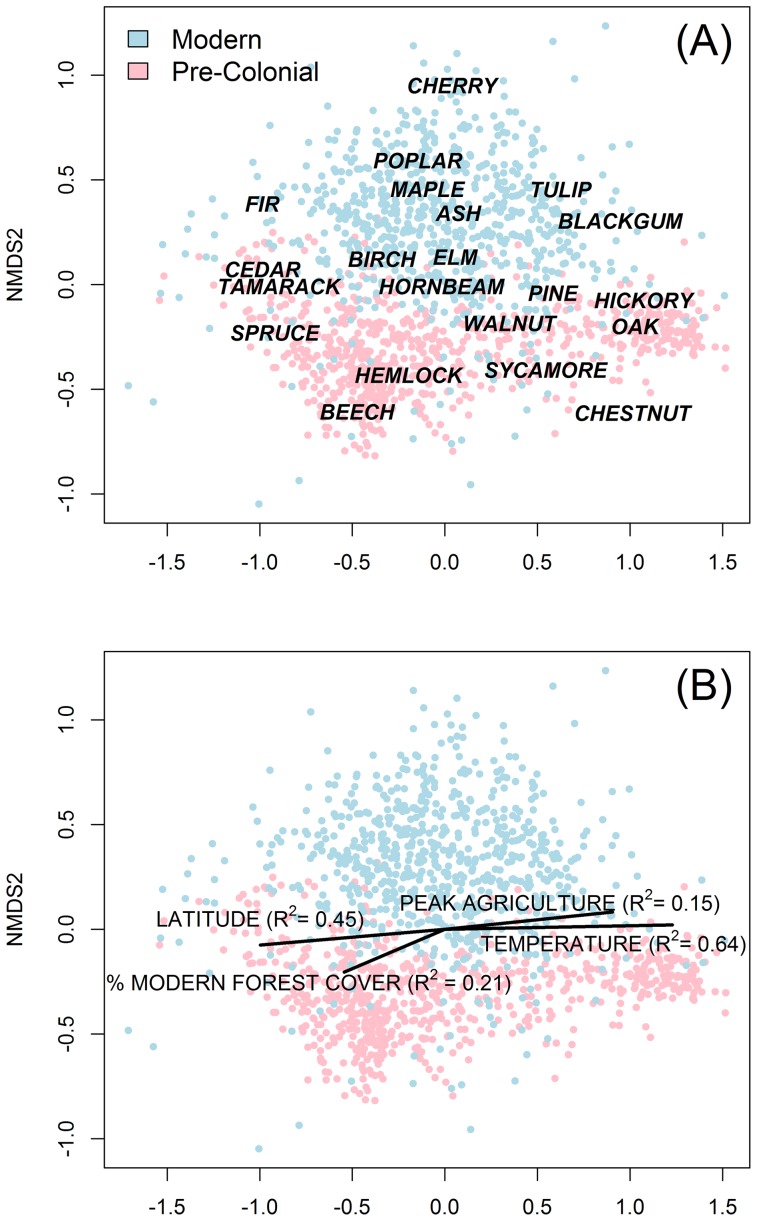
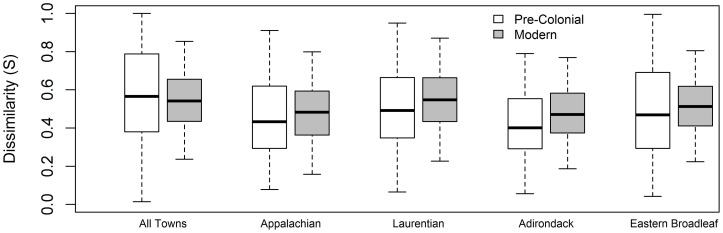
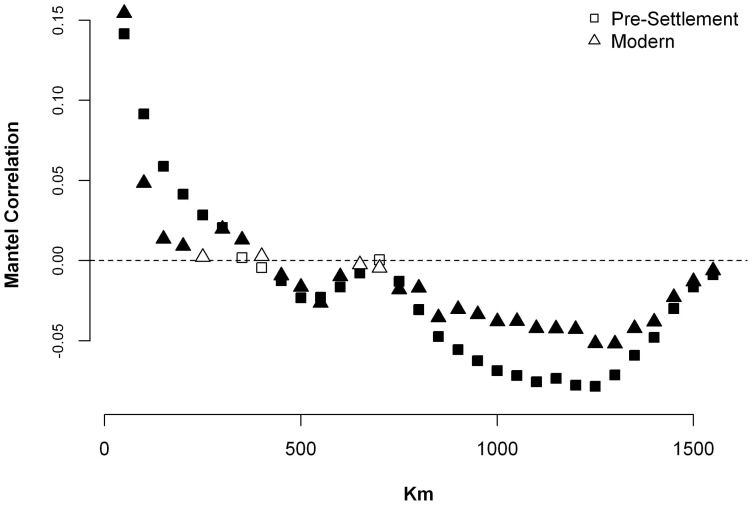
The northeastern United States is a predominately-forested region that, like most of the eastern U.S., has undergone a 400-year history of intense logging, land clearance for agriculture, and natural reforestation. This setting affords the opportunity to address a major ecological question: How similar are today's forests to those existing prior to European colonization? Working throughout a nine-state region spanning Maine to Pennsylvania, we assembled a comprehensive database of archival land-survey records describing the forests at the time of European colonization. We compared these records to modern forest inventory data and described: (1) the magnitude and attributes of forest compositional change, (2) the geography of change, and (3) the relationships between change and environmental factors and historical land use. We found that with few exceptions, notably the American chestnut, the same taxa that made up the pre-colonial forest still comprise the forest today, despite ample opportunities for species invasion and loss. Nonetheless, there have been dramatic shifts in the relative abundance of forest taxa. The magnitude of change is spatially clustered at local scales (<125 km) but exhibits little evidence of regional-scale gradients. Compositional change is most strongly associated with the historical extent of agricultural clearing. Throughout the region, there has been a broad ecological shift away from late successional taxa, such as beech and hemlock, in favor of early- and mid-successional taxa, such as red maple and poplar. Additionally, the modern forest composition is more homogeneous and less coupled to local climatic controls.
Overview
The claims and statistics of this paper haven’t been checked yet.
Run the check — free, no account needed. It reads the open-access text and checks the sources it cites.
Integrity signals
Registry
Cites
Statistics
Figures
Verification
Claims the paper makes
The claims and statistics of this paper haven’t been checked yet.
Run the check — free, no account needed. It reads the open-access text and checks the sources it cites.
Claims other papers make about this one
Each is checked against this paper’s own text: does it say what the citing paper says it does?
The check wasn’t confident either way, so it gives no verdict — never disputed.
In the citing paper
“Native canopy tree density was stable or decreasing for all but two parks, as is typical of middle-aged eastern deciduous forests (Thompson et al., 2013).”
From Overabundant deer and invasive plants drive widespread regeneration debt in eastern United States national parks (2023) · cites this paper as Thompson et al., 2013
Experimental — accuracy not yet measured
Self-check
Percentages, sums and reported differences re-computed from the paper’s own numbers.
The self-check needs the paper’s full text.
Citations
Cites
R: A Language and Environment for Statistical Computing
R Core Team (2000) · doi:10.32614/r.manuals · Cited by 355,893
vegan: Community Ecology Package
Oksanen, J., Simpson, G. L., Blanchet, F. G., Kindt, R., Legendre, P., Minchin, P. R., O’Hara, R. B., Sólymos, P., Stevens, M. H. H., Szöcs, E., et al. (2001) · doi:10.32614/cran.package.vegan · Cited by 27,099
Gotelli, N., & Colwell, R. K. (2001) · Ecology Letters · doi:10.1046/j.1461-0248.2001.00230.x · Cited by 6,529
Unbiased Recursive Partitioning: A Conditional Inference Framework
Hothorn, T., Hornik, K., & Zeileis, A. (2006) · Journal of Computational and Graphical Statistics · doi:10.1198/106186006x133933 · Cited by 4,021
CLASSIFICATION AND REGRESSION TREES: A POWERFUL YET SIMPLE TECHNIQUE FOR ECOLOGICAL DATA ANALYSIS
De’ath, G., & Fabricius, K. (2000) · Ecology · doi:10.1890/0012-9658(2000)081[3178:cartap]2.0.co;2 · Cited by 3,235
Deciduous Forests of Eastern North America
(1951) · Annals of the Entomological Society of America · doi:10.1093/aesa/44.4.595 · Cited by 1,906
A Primer of Ecological Statistics
Gotelli, N. J., & Ellison, A. M. (2004) · Cited by 1,237
Changes in the Land: Indians, Colonists, and the Ecology of New England
Axtell, J. L., & Cronon, W. J. (1984) · The American Historical Review · doi:10.2307/1856261 · Cited by 1,095
Land-Use Choices: Balancing Human Needs and Ecosystem Function
DeFries, R., Foley, J. A., & Asner, G. P. (2004) · Frontiers in Ecology and the Environment · doi:10.1890/1540-9295(2004)002[0249:lcbhna]2.0.co;2 · Cited by 929
On defining and quantifying biotic homogenization
Olden, J. D., & Rooney, T. P. (2006) · Global Ecology and Biogeography · doi:10.1111/j.1466-822x.2006.00214.x · Cited by 801
Research works printed but not linked: 5
- Foster DR, Aber JD (2004) Forest in time: Environmental consequences of 1000 years of change in New England. New Haven: Yale University Press.
- Irland LC (1999) The Northeast's changing forests. Cambridge, MA: Harvard University Press.
- Foley JA, Ramankutty N, Leff B, Gibbs HK (2007) Global land use changes. In: Kling MD, Parkinson CL, Partington KC, Williams RG, editors. Our changing planet: A view from space. New York: Cambridge University Press. 262–265.
- PB Sears, 1925, Th natural vegetation of Ohio. I, A map of the virgin forest, Ohio Journal of Science, 25, 139
- Whitney G, DeCant J (2001) Government land office surveys and other early surveys. The Historical Ecology Handbook. Washington, DC: Island Press. 147–172.
Cited by
Sorted by citations
Meter, K. J. V., Basu, N. B., & Cappellen, P. V. (2016) · Global Biogeochemical Cycles · doi:10.1002/2016gb005498 · Cited by 307
Archetypical patterns and trajectories of land systems in Europe
Levers, C., Müller, D., Erb, K., Haberl, H., Jepsen, M. R., Metzger, M. J., Meyfroidt, P., Plieninger, T., Plutzar, C., Stürck, J., et al. (2015) · Regional Environmental Change · doi:10.1007/s10113-015-0907-x · Cited by 278
Environmental DNA Time Series in Ecology
Bálint, M., Pfenninger, M., Grossart, H., Taberlet, P., Vellend, M., Leibold, M. A., Englund, G., & Bowler, D. E. (2018) · Trends in Ecology & Evolution · doi:10.1016/j.tree.2018.09.003 · Cited by 232
Holocene shifts in the assembly of plant and animal communities implicate human impacts
Lyons, S. K., Amatangelo, K. L., Behrensmeyer, A. K., Bercovici, A. D., Blois, J. L., Davis, M., DiMichele, W. A., Du, A., Eronen, J. T., Faith, J. T., et al. (2015) · Nature · doi:10.1038/nature16447 · Cited by 219
Is climate an important driver of post‐European vegetation change in the Eastern United States?
Nowacki, G. J., & Abrams, M. D. (2014) · Global Change Biology · doi:10.1111/gcb.12663 · Cited by 208
Metadata
- Authors
- Thompson, J. R., Carpenter, D. N., Cogbill, C. V., & Foster, D. R.
- Affiliations
- Smithsonian Institution (US)
- University of Wisconsin–Madison (US)
- Harvard University (US)
- Corresponding author
- Thompson, Jonathan R.
- Venue
- PLoS ONE
- Publisher
- Public Library of Science (PLoS)
- Published
- 2013-09-04
- Volume
- 8
- Issue
- 9
- Pages
- e72540
- ISSN
- 1932-6203 (ISSN-L)
- PMC
- PMC3762820
- OpenAlex
- W2130701908
- Cited by
- 331
- References
- 71
- Citations by year
- 2026: 13 · 2025: 29 · 2024: 24 · 2023: 25 · 2022: 42 · 2021: 29 · 2020: 30 · 2019: 29 · 2018: 21 · 2017: 21 · 2016: 26 · 2015: 25 · 2014: 12 · 2013: 3
- FWCI
- 19.77
- Type
- journal article
- Language
- en
- Open access
- gold
- doi.org
- Licence
- Locations
- PLoS ONE (publishedVersion, public-domain)
- Europe PMC (PubMed Central) (publishedVersion, public-domain)
- PubMed Central (publishedVersion, public-domain)
- PubMed (publishedVersion)
- Digital Access to Scholarship at Harvard (DASH) (Harvard University) (submittedVersion, cc-by)
- DOAJ (DOAJ: Directory of Open Access Journals) (submittedVersion, cc-by-sa)
- Smithsonian Digital Repository (Smithsonian Institution) (submittedVersion)
- Funders
- National Science Foundation (0620443)
- Harvard University
- U.S. Forest Service
- Topics
- Physical Sciences › Environmental Science › Nature and Landscape Conservation › Ecology and Vegetation Dynamics Studies
- Life Sciences › Agricultural and Biological Sciences › Forestry › Forest ecology and management
- Life Sciences › Agricultural and Biological Sciences › Forestry › Forest Management and Policy
- Keywords
- forest composition change, European colonization, land use history, agricultural clearing, logging, natural reforestation, forest succession, biological invasions, American chestnut, northeastern United States forests, land survey records
- MeSH terms
- Geography, New England, Trees, Ecosystem
About these checks
Registry, retraction, Cites and statistics results are computed, not judged, with one exception: a printed reference that no index lists is read once by a model before it counts as a citation error. Claims are extracted by a model and kept only when their quote appears verbatim in the text; each cited source is then checked, with a model’s help, for whether it says what the claim relies on. Those verdicts can be wrong — read the claim’s quote and the cited source before relying on one.
Statistics and arithmetic are recomputed, not judged.
Confidence bands are shown only for fields calibrated on our annotated test set. None is calibrated yet, so no band is shown.
What counts as a claim ›How we measure confidence ›How we check this ›
Are you an author, or do you see a problem with this page? Request a review
