

The DOI matches its Crossref record; 52 of the 54 references it cites were found in a registry or an index.
Non-Catalytic Site HIV-1 Integrase Inhibitors Disrupt Core Maturation and Induce a Reverse Transcription Block in Target Cells
Open accessAbstract
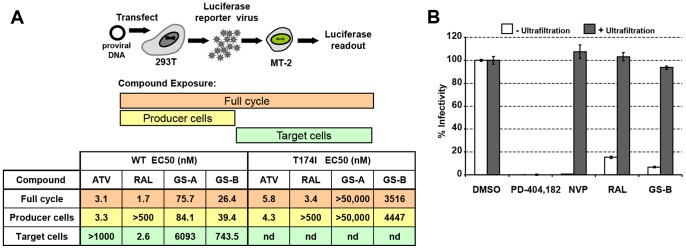
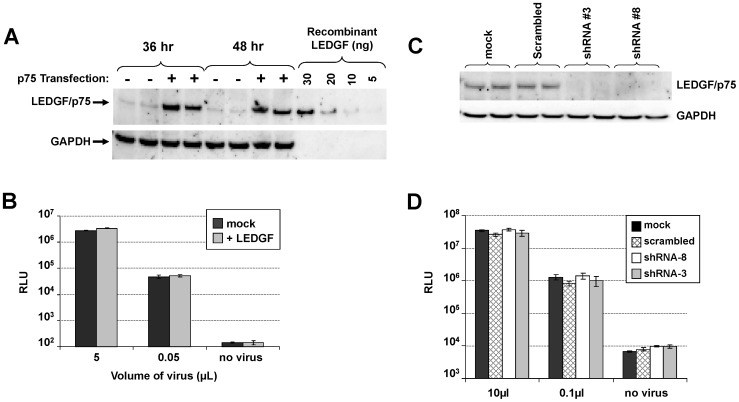
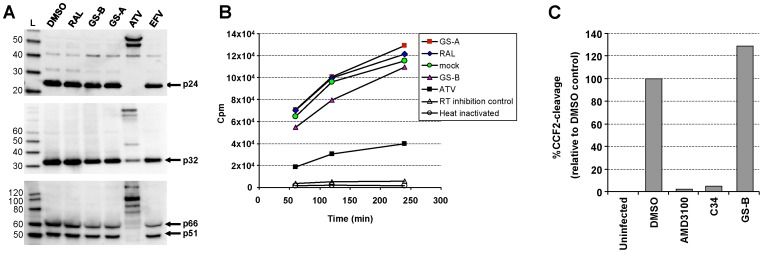
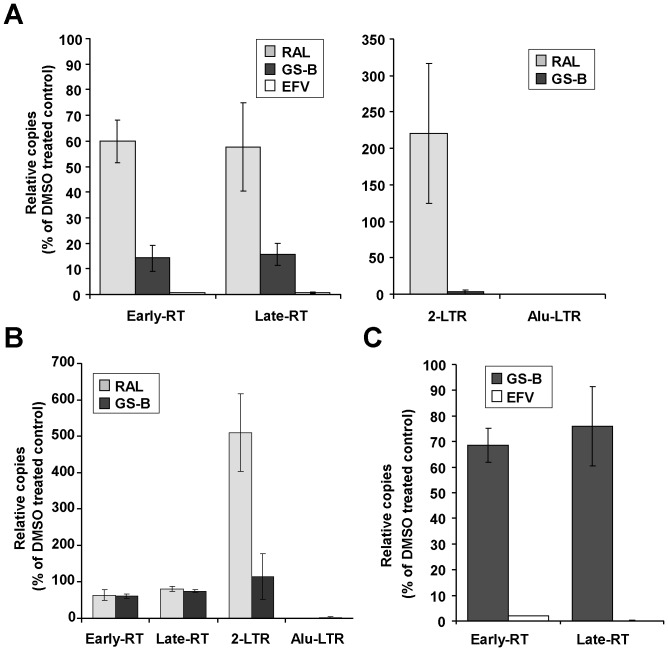
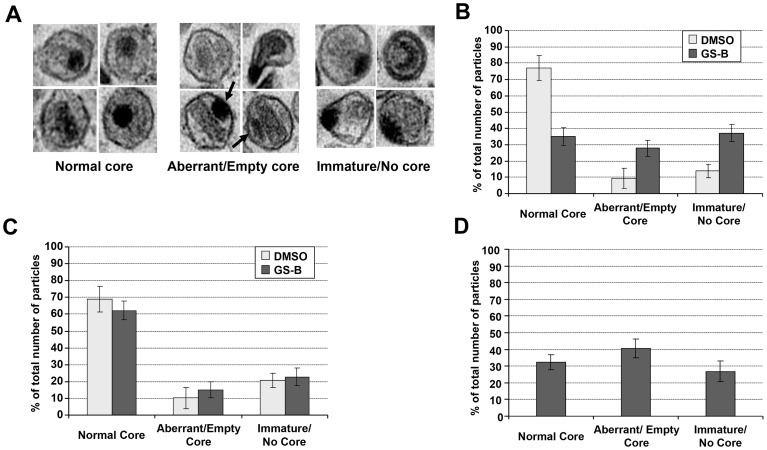
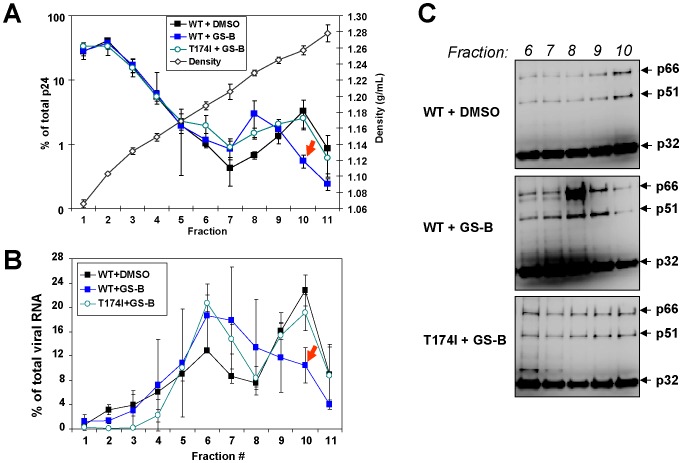
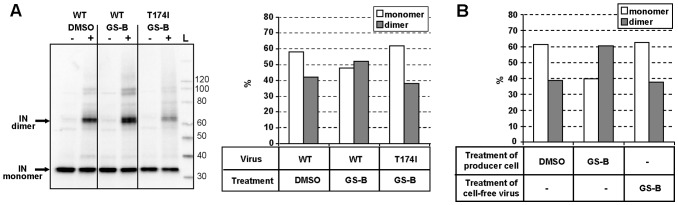
HIV-1 integrase (IN) is the target for two classes of antiretrovirals: i) the integrase strand-transfer inhibitors (INSTIs) and ii) the non-catalytic site integrase inhibitors (NCINIs). NCINIs bind at the IN dimer interface and are thought to interfere primarily with viral DNA (vDNA) integration in the target cell by blocking IN-vDNA assembly as well as the IN-LEDGF/p75 interaction. Herein we show that treatment of virus-producing cells, but not of mature virions or target cells, drives NCINI antiviral potency. NCINIs target an essential late-stage event in HIV replication that is insensitive to LEDGF levels in the producer cells. Virus particles produced in the presence of NCINIs displayed normal Gag-Pol processing and endogenous reverse transcriptase activity, but were defective at initiating vDNA synthesis following entry into the target cell. NCINI-resistant virus carrying a T174I mutation in the IN dimer interface was less sensitive to the compound-induced late-stage effects, including the reverse transcription block. Wild-type, but not T174I virus, produced in the presence of NCINIs exhibited striking defects in core morphology and an increased level of IN oligomers that was not observed upon treatment of mature cell-free particles. Collectively, these results reveal that NCINIs act through a novel mechanism that is unrelated to the previously observed inhibition of IN activity or IN-LEDGF interaction, and instead involves the disruption of an IN function during HIV-1 core maturation and assembly.
Overview
The claims and statistics of this paper haven’t been checked yet.
Run the check — free, no account needed. It reads the open-access text and checks the sources it cites.
Integrity signals
Registry
Cites
Statistics
Figures
Verification
Claims the paper makes
The claims and statistics of this paper haven’t been checked yet.
Run the check — free, no account needed. It reads the open-access text and checks the sources it cites.
Claims other papers make about this one
Each is checked against this paper’s own text: does it say what the citing paper says it does?
The source backs part of the claim, not all of it — or backs it for a different population, condition or comparison.
In the citing paper
“Class II IN mutations additionally affected viral particle morphology, with the ribonucleoprotein material found outside of the capsid shell, oftentimes in association with the viral membrane131,132,139–142.”
From Structure and function of retroviral integrase (2022) · cites this paper as [142]
Experimental — accuracy not yet measuredThe source backs part of the claim, not all of it — or backs it for a different population, condition or comparison.
In the citing paper
“Detailed analysis of virus particles produced in the presence of ALLINIs revealed that although viral RNA and proteins were incorporated properly, IN-RNA binding was disrupted, and the ribonucleoprotein complex was located eccentrically (Fig. 6B)140–142,174–176.”
From Structure and function of retroviral integrase (2022) · cites this paper as [142]
Experimental — accuracy not yet measuredThe source backs part of the claim, not all of it — or backs it for a different population, condition or comparison.
In the citing paper
“Counterintuitively, the underlying mode of ALLINI action is not via inhibition of integration140,142,174–177,179–181.”
From Structure and function of retroviral integrase (2022) · cites this paper as [142]
Experimental — accuracy not yet measuredThe cited source says what the claim attributes to it.
In the citing paper
“The common biochemical consequence of ALLINI binding is aberrant HIV-1 IN hyper-multimerization140,142,174–181.”
From Structure and function of retroviral integrase (2022) · cites this paper as [142]
The cited source says what the claim attributes to it.
In the citing paper
“Under these conditions, it became clear that HIV-1 was more susceptible to ALLINIs when exposed to the compounds during egress as compared to ingress140,142,174–176.”
From Structure and function of retroviral integrase (2022) · cites this paper as [142]
Self-check
Percentages, sums and reported differences re-computed from the paper’s own numbers.
The self-check needs the paper’s full text.
Citations
Cites
A quantitative assay for HIV DNA integration in vivo
Butler, S. L., Hansen, M. S., & Bushman, F. D. (2001) · Nature Medicine · doi:10.1038/87979 · Cited by 695
Integrase inhibitors to treat HIV/Aids
Pommier, Y., Johnson, A. A., & Marchand, C. (2005) · Nature reviews. Drug discovery · doi:10.1038/nrd1660 · Cited by 693
Raltegravir with Optimized Background Therapy for Resistant HIV-1 Infection
Steigbigel, R. T., Cooper, D. A., Kumar, P. N., Eron, J., Schechter, M., Markowitz, M. H., Loutfy, M. R., Lennox, J. L., Gatell, J. M., Rockstroh, J. K., et al. (2008) · New England Journal of Medicine · doi:10.1056/nejmoa0708975 · Cited by 691
An essential role for LEDGF/p75 in HIV integration
Llano, M., Saenz, D. T., Meehan, A., Wongthida, P., Peretz, M., Walker, W. H., Teo, W., & Poeschla, E. M. (2006) · Science · doi:10.1126/science.1132319 · Cited by 537
Forshey, B. M., von Schwedler, U. K., Sundquist, W. I., & Aiken, C. (2002) · Journal of Virology · doi:10.1128/jvi.76.11.5667-5677.2002 · Cited by 514
Subgroup and Resistance Analyses of Raltegravir for Resistant HIV-1 Infection
Cooper, D. A., Steigbigel, R. T., Gatell, J. M., Rockstroh, J. K., Katlama, C., Yéni, P., Lazzarin, A., Clotet, B., Kumar, P. N., Eron, J., et al. (2008) · New England Journal of Medicine · doi:10.1056/nejmoa0708978 · Cited by 513
Christ, F., Voet, A., Marchand, A., Nicolet, S., Desimmie, B. A., Marchand, D., Bardiot, D., Van der Veken, N. J., Van Remoortel, B., Strelkov, S. V., et al. (2010) · Nature Chemical Biology · doi:10.1038/nchembio.370 · Cited by 479
A sensitive and specific enzyme-based assay detecting HIV-1 virion fusion in primary T lymphocytes
Cavrois, M., de Noronha, C., & Greene, W. C. (2002) · Nature Biotechnology · doi:10.1038/nbt745 · Cited by 475
Shun, M.-C., Raghavendra, N. K., Vandegraaff, N., Daigle, J. E., Hughes, S., Kellam, P., Cherepanov, P., & Engelman, A. (2007) · Genes & Development · doi:10.1101/gad.1565107 · Cited by 467
Chapter 5 Generation of High-Titer Pseudotyped Retroviral Vectors with Very Broad Host Range
Yee, J., Friedmann, T., & Burns, J. C. (1994) · Methods in cell biology · doi:10.1016/s0091-679x(08)60600-7 · Cited by 449
Cited by
Sorted by citations
Small-Molecule Inhibitors of Protein-Protein Interactions: Progressing toward the Reality
Arkin, M. R., Tang, Y., & Wells, J. A. (2014) · Chemistry & Biology · doi:10.1016/j.chembiol.2014.09.001 · Cited by 1,065
Clinical targeting of HIV capsid protein with a long-acting small molecule
Link, J. O., Rhee, M. S., Tse, W. C., Zheng, J., Somoza, J. R., Rowe, W., Begley, R., Chiu, A., Mulato, A. S., Hansen, D., et al. (2020) · Nature · doi:10.1038/s41586-020-2443-1 · Cited by 455
Self-citationLesbats, P., Engelman, A., & Cherepanov, P. (2016) · Chemical Reviews · doi:10.1021/acs.chemrev.6b00125 · Cited by 250
Discovery of BI 224436, a Noncatalytic Site Integrase Inhibitor (NCINI) of HIV-1
Fader, L. D., Malenfant, E., Parisien, M., Carson, R., Bilodeau, F., Landry, S., Pesant, M., Brochu, C., Morin, S., Chabot, C., et al. (2014) · ACS Medicinal Chemistry Letters · doi:10.1021/ml500002n · Cited by 178
Block-And-Lock Strategies to Cure HIV Infection
Vansant, G., Bruggemans, A., Janssens, J., & Debyser, Z. (2020) · Viruses · doi:10.3390/v12010084 · Cited by 183
Metadata
- Authors
- Balakrishnan, M., Yant, S. R., Tsai, L., O’Sullivan, C., Bam, R. A., Tsai, A., Niedziela-Majka, A., Stray, K. M., Sakowicz, R., & Cihlar, T.
- Affiliations
- Gilead Sciences (United States) (US)
- Corresponding author
- Balakrishnan, Mini
- Venue
- PLoS ONE
- Publisher
- Public Library of Science (PLoS)
- Published
- 2013-09-09
- Volume
- 8
- Issue
- 9
- Pages
- e74163
- ISSN
- 1932-6203 (ISSN-L)
- PMC
- PMC3767657
- OpenAlex
- W2053936754
- Cited by
- 126
- References
- 54
- Citations by year
- 2026: 4 · 2025: 5 · 2024: 4 · 2023: 6 · 2022: 11 · 2021: 12 · 2020: 12 · 2019: 9 · 2018: 9 · 2017: 7 · 2016: 17 · 2015: 9 · 2014: 17 · 2013: 4
- FWCI
- 11.92
- Type
- journal article
- Language
- en
- Open access
- gold
- doi.org
- Locations
- PLoS ONE (publishedVersion, cc-by)
- Europe PMC (PubMed Central) (publishedVersion, other-oa)
- PubMed Central (publishedVersion, cc-by)
- PubMed (publishedVersion)
- DOAJ (DOAJ: Directory of Open Access Journals) (submittedVersion)
- Figshare (submittedVersion, cc-by)
- Topics
- Health Sciences › Medicine › Infectious Diseases › HIV/AIDS drug development and treatment
- Life Sciences › Immunology and Microbiology › Virology › HIV Research and Treatment
- Life Sciences › Biochemistry, Genetics and Molecular Biology › Genetics › Virus-based gene therapy research
- Keywords
- HIV-1 integrase, integrase strand transfer inhibitors, LEDGF/p75, viral DNA replication
- MeSH terms
- DNA, Viral, Genetic Vectors, Humans, Luciferases, Mutation, T-Lymphocytes, Transcription Factors, Virion, Virus Replication, HIV-1, Gene Expression, Virus Integration, Genes, Reporter, Virus Assembly, HIV Integrase, HIV Integrase Inhibitors, Drug Resistance, Viral, Cell Line, Tumor, Adaptor Proteins, Signal Transducing, HIV Reverse Transcriptase, Host-Pathogen Interactions
About these checks
Registry, retraction, Cites and statistics results are computed, not judged, with one exception: a printed reference that no index lists is read once by a model before it counts as a citation error. Claims are extracted by a model and kept only when their quote appears verbatim in the text; each cited source is then checked, with a model’s help, for whether it says what the claim relies on. Those verdicts can be wrong — read the claim’s quote and the cited source before relying on one.
Statistics and arithmetic are recomputed, not judged.
Confidence bands are shown only for fields calibrated on our annotated test set. None is calibrated yet, so no band is shown.
What counts as a claim ›How we measure confidence ›How we check this ›
Are you an author, or do you see a problem with this page? Request a review
