

The DOI matches its Crossref record; 47 of the 47 references it cites were found in a registry or an index.
Cannabidiol, a Non-Psychoactive Cannabinoid Compound, Inhibits Proliferation and Invasion in U87-MG and T98G Glioma Cells through a Multitarget Effect
Open accessAbstract
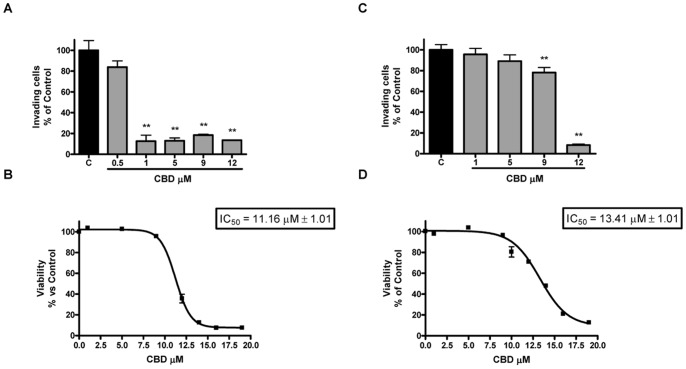
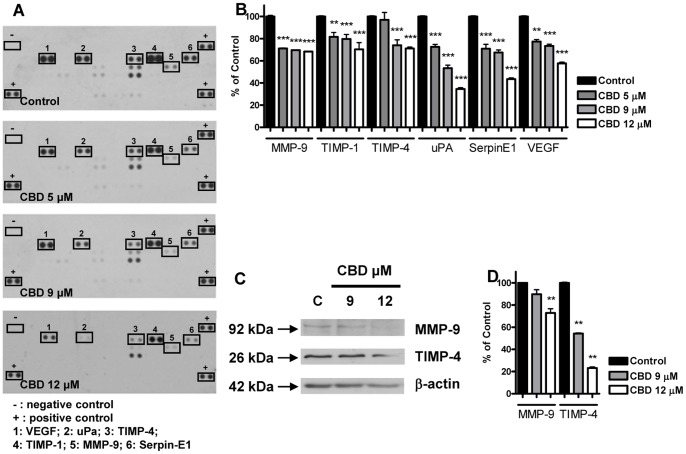
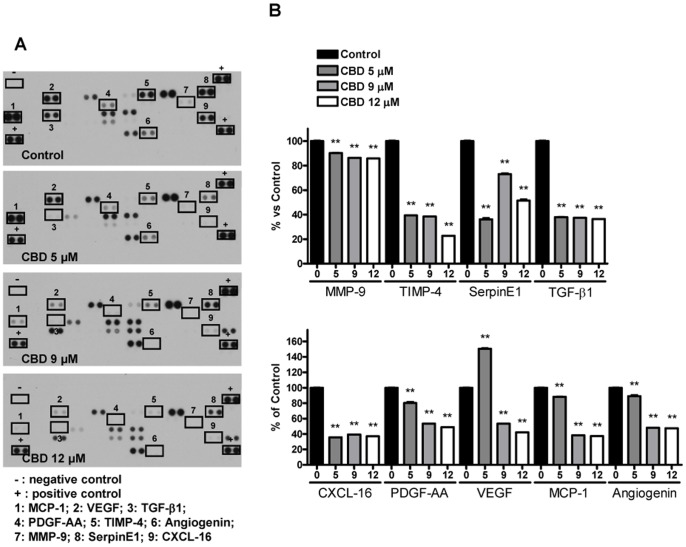
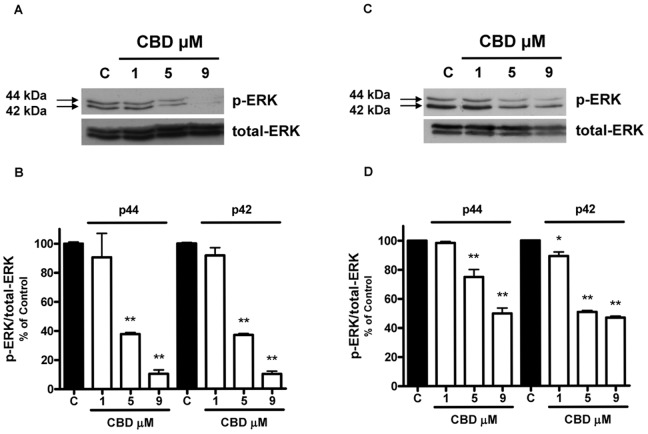
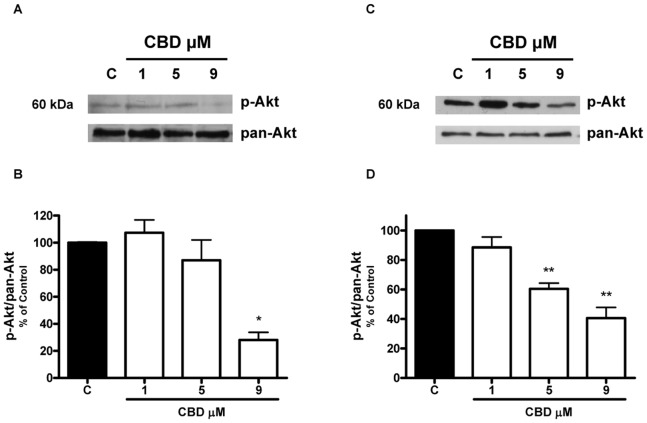
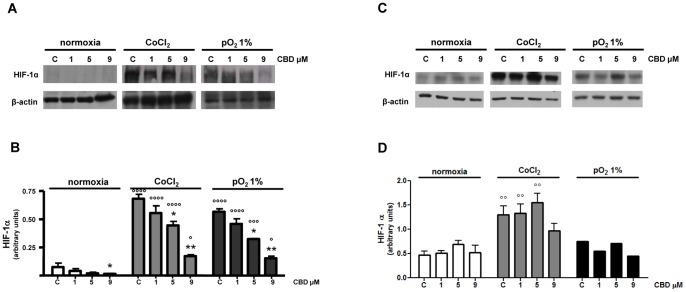
In the present study, we found that CBD inhibited U87-MG and T98G cell proliferation and invasiveness in vitro and caused a decrease in the expression of a set of proteins specifically involved in growth, invasion and angiogenesis. In addition, CBD treatment caused a dose-related down-regulation of ERK and Akt prosurvival signaling pathways in U87-MG and T98G cells and decreased hypoxia inducible factor HIF-1α expression in U87-MG cells. Taken together, these results provide new insights into the antitumor action of CBD, showing that this cannabinoid affects multiple tumoral features and molecular pathways. As CBD is a non-psychoactive phytocannabinoid that appears to be devoid of side effects, our results support its exploitation as an effective anti-cancer drug in the management of gliomas.
Overview
The claims and statistics of this paper haven’t been checked yet.
Run the check — free, no account needed. It reads the open-access text and checks the sources it cites.
Integrity signals
Registry
Cites
Statistics
Figures
Verification
Claims the paper makes
The claims and statistics of this paper haven’t been checked yet.
Run the check — free, no account needed. It reads the open-access text and checks the sources it cites.
Claims other papers make about this one
Each is checked against this paper’s own text: does it say what the citing paper says it does?
In the citing paper
“CBD can modulate intracellular pathways directly connected with synaptic remodeling, such as Erk1/2 and Akt, in distinct types of cancer cell lines (109, 110).”
From Translational investigation of the therapeutic potential of Cannabidiol (CBD): Toward a new age (2018) · cites this paper as [109]
Self-check
Percentages, sums and reported differences re-computed from the paper’s own numbers.
The self-check needs the paper’s full text.
Citations
Cites
Targeting HIF-1 for cancer therapy
Semenza, G. L. (2003) · Nature Reviews Cancer · doi:10.1038/nrc1187 · Cited by 6,717 · cited 1×
“HIF-1a is one of the major factors responsible for orchestrating the adaptive transcriptional programs, inducing cell survival, motility and tumor angiogenesis under hypoxic conditions [6,43].”
BackgroundMassagué, J. (2008) · Cell · doi:10.1016/j.cell.2008.07.001 · Cited by 3,907
Meaningful relationships: the regulation of the Ras/Raf/MEK/ERK pathway by protein interactions
Kölch, W. (2000) · Biochemical Journal · doi:10.1042/bj3510289 · Cited by 1,443
Bisogno, T., Hanuš, L., PETROCELLIS, L. D., Tchilibon, S., Ponde, D. E., Brandi, I., Moriello, A. S., Davis, J. B., Mechoulam, R., & Marzo, V. D. (2001) · British Journal of Pharmacology · doi:10.1038/sj.bjp.0704327 · Cited by 1,315
Matrix metalloproteinases: they're not just for matrix anymore!
McCawley, L. J., & Matrisian, L. M. (2001) · Current Opinion in Cell Biology · doi:10.1016/s0955-0674(00)00248-9 · Cited by 1,274
Hypoxia-Inducible Factors, Stem Cells, and Cancer
Keith, B., & Simon, M. C. (2007) · Cell · doi:10.1016/j.cell.2007.04.019 · Cited by 1,179
Ten years of protein kinase B signalling: a hard Akt to follow
Brazil, D. P., & Hemmings, B. A. (2001) · Trends in Biochemical Sciences · doi:10.1016/s0968-0004(01)01958-2 · Cited by 1,177
MAP kinases and cell migration
Huang, C., Jacobson, K., & Schaller, M. D. (2004) · Journal of Cell Science · doi:10.1242/jcs.01481 · Cited by 1,089
Combined activation of Ras and Akt in neural progenitors induces glioblastoma formation in mice
Holland, E. C., Celestino, J., Dai, C., Schaefer, L., Sawaya, R. A., & Fuller, G. N. (2000) · Nature Genetics · doi:10.1038/75596 · Cited by 906
Molecular mechanisms of glioma invasiveness: the role of proteases
Rao, J. S. (2003) · Nature Reviews Cancer · doi:10.1038/nrc1121 · Cited by 847
Cited by
Sorted by citations
Cannabidiol: State of the art and new challenges for therapeutic applications
Pisanti, S., Malfitano, A. M., Ciaglia, E., Lamberti, A., Ranieri, R., Cuomo, G., Abate, M., Faggiana, G., Proto, M., Fiore, D., et al. (2017) · Pharmacology & Therapeutics · doi:10.1016/j.pharmthera.2017.02.041 · Cited by 664
Pellati, F., Borgonetti, V., Brighenti, V., Biagi, M., Benvenuti, S., & Corsi, L. (2018) · BioMed Research International · doi:10.1155/2018/1691428 · Cited by 430
Translational investigation of the therapeutic potential of Cannabidiol (CBD): Toward a new age
Crippa, J. A., Guimarães, F. S., Campos, A. C., & Zuardi, A. W. (2018) · Frontiers in Immunology · doi:10.3389/fimmu.2018.02009 · Cited by 308
Baron, E. P. (2018) · Headache The Journal of Head and Face Pain · doi:10.1111/head.13345 · Cited by 268
Cannabidiol (CBD) as a Promising Anti-Cancer Drug
Seltzer, E. S., Watters, A. K., MacKenzie, D., Granat, L. M., & Zhang, D. (2020) · Cancers · doi:10.3390/cancers12113203 · Cited by 260
Metadata
- Authors
- Solinas, M., Massi, P., Cinquina, V., Valenti, M., Bolognini, D., Gariboldi, M., Monti, E., Rubino, T., & Parolaro, D.
- Affiliations
- University of Insubria (IT)
- University of Milan (IT)
- University of Toronto (CA)
- Corresponding author
- Parolaro, Daniela
- ORCID
- Venue
- PLoS ONE
- Publisher
- Public Library of Science (PLoS)
- Published
- 2013-10-21
- Volume
- 8
- Issue
- 10
- Pages
- e76918
- ISSN
- 1932-6203 (ISSN-L)
- PMC
- PMC3804588
- OpenAlex
- W2083034715
- Cited by
- 159
- References
- 47
- Citations by year
- 2026: 14 · 2025: 8 · 2024: 17 · 2023: 22 · 2022: 21 · 2021: 24 · 2020: 14 · 2019: 10 · 2018: 9 · 2017: 6 · 2016: 4 · 2015: 7 · 2014: 3
- FWCI
- 3.43
- Type
- journal article
- Language
- en
- Open access
- gold
- doi.org
- Locations
- PLoS ONE (publishedVersion, cc-by)
- Europe PMC (PubMed Central) (publishedVersion, cc-by)
- PubMed Central (publishedVersion, cc-by)
- PubMed (publishedVersion)
- DOAJ (DOAJ: Directory of Open Access Journals) (submittedVersion, cc-by-sa)
- IrInSubria (University of Insubria) (submittedVersion)
- Funders
- Università degli Studi di Milano
- GW Pharmaceuticals
- Topics
- Health Sciences › Medicine › Pharmacology (medical) › Cannabis and Cannabinoid Research
- Health Sciences › Medicine › Oncology › Glioma Diagnosis and Treatment
- Life Sciences › Biochemistry, Genetics and Molecular Biology › Cancer Research › Cancer, Stress, Anesthesia, and Immune Response
- Keywords
- cannabidiol, glioma, U87 cells, T98G cells, cell proliferation, tumor invasion, angiogenesis, ERK signaling, Akt signaling, HIF-1α, anticancer activity, phytocannabinoids
- MeSH terms
- Antineoplastic Agents, Cannabidiol, Cell Movement, Cell Survival, Dose-Response Relationship, Drug, Glioma, Humans, Neoplasm Invasiveness, Blotting, Western, Signal Transduction, Proteome, Proteomics, Cell Line, Tumor, Extracellular Signal-Regulated MAP Kinases, Cell Proliferation, Proto-Oncogene Proteins c-akt, Hypoxia-Inducible Factor 1, alpha Subunit
About these checks
Registry, retraction, Cites and statistics results are computed, not judged, with one exception: a printed reference that no index lists is read once by a model before it counts as a citation error. Claims are extracted by a model and kept only when their quote appears verbatim in the text; each cited source is then checked, with a model’s help, for whether it says what the claim relies on. Those verdicts can be wrong — read the claim’s quote and the cited source before relying on one.
Statistics and arithmetic are recomputed, not judged.
Confidence bands are shown only for fields calibrated on our annotated test set. None is calibrated yet, so no band is shown.
What counts as a claim ›How we measure confidence ›How we check this ›
Are you an author, or do you see a problem with this page? Request a review
