

The DOI matches its Crossref record; 1 of the 1 references it cites were found in a registry or an index.
Mammosphere Formation in Breast Carcinoma Cell Lines Depends upon Expression of E-cadherin
Open accessAbstract
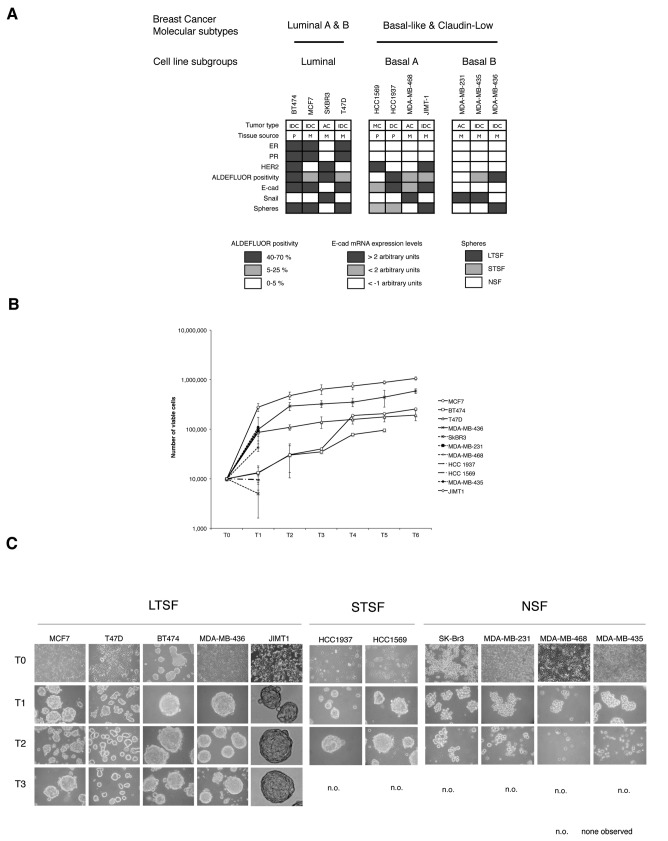
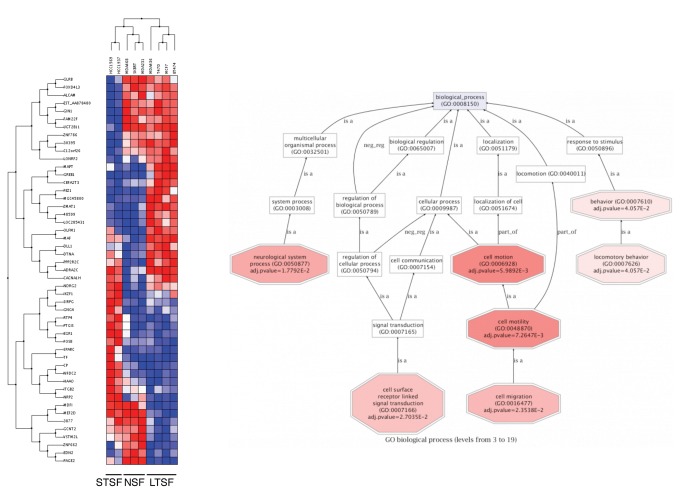
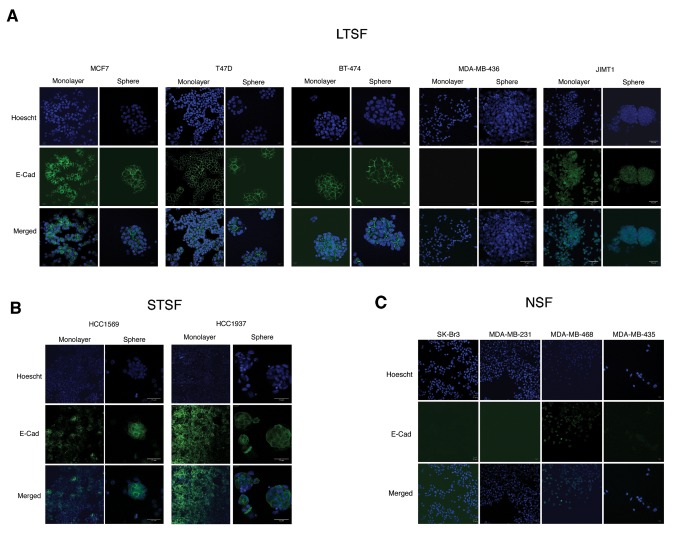
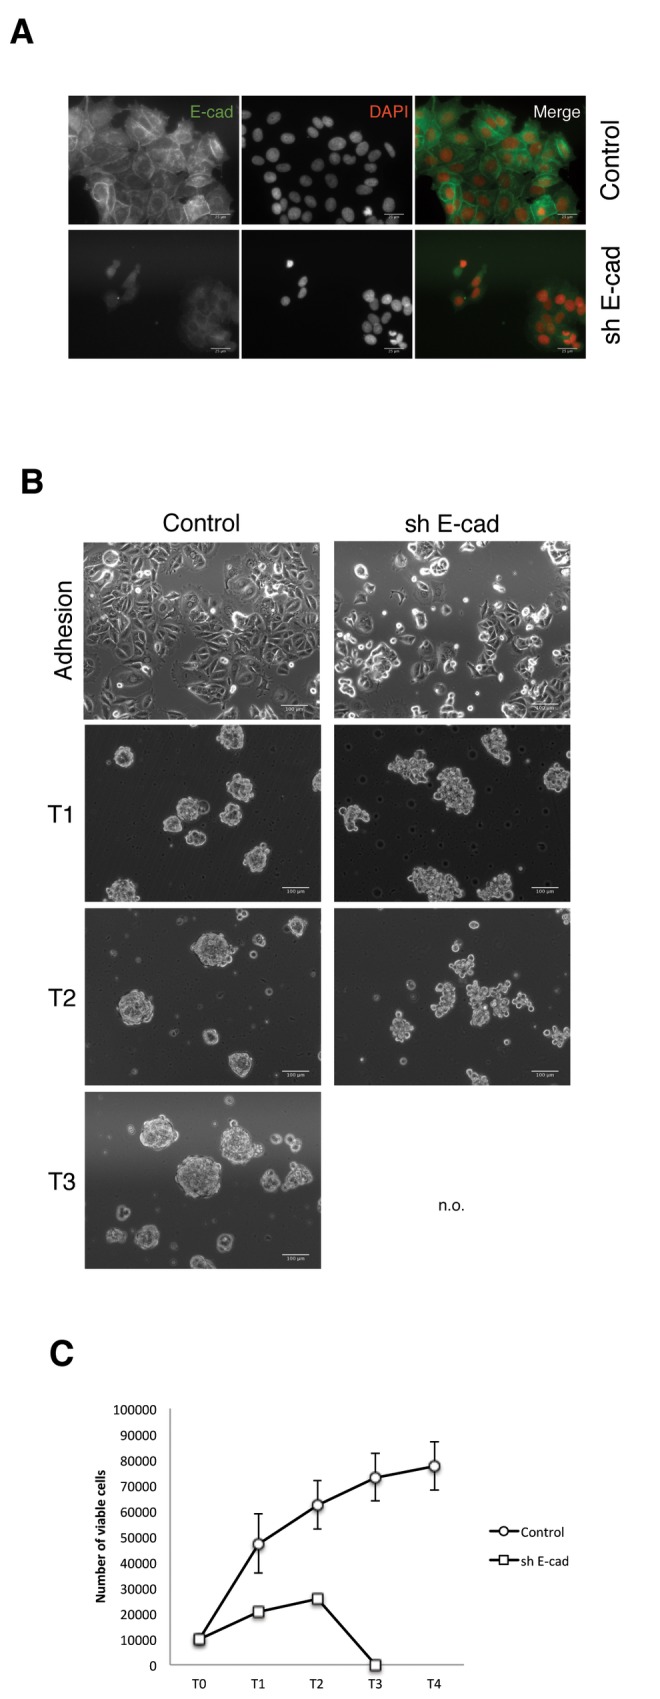
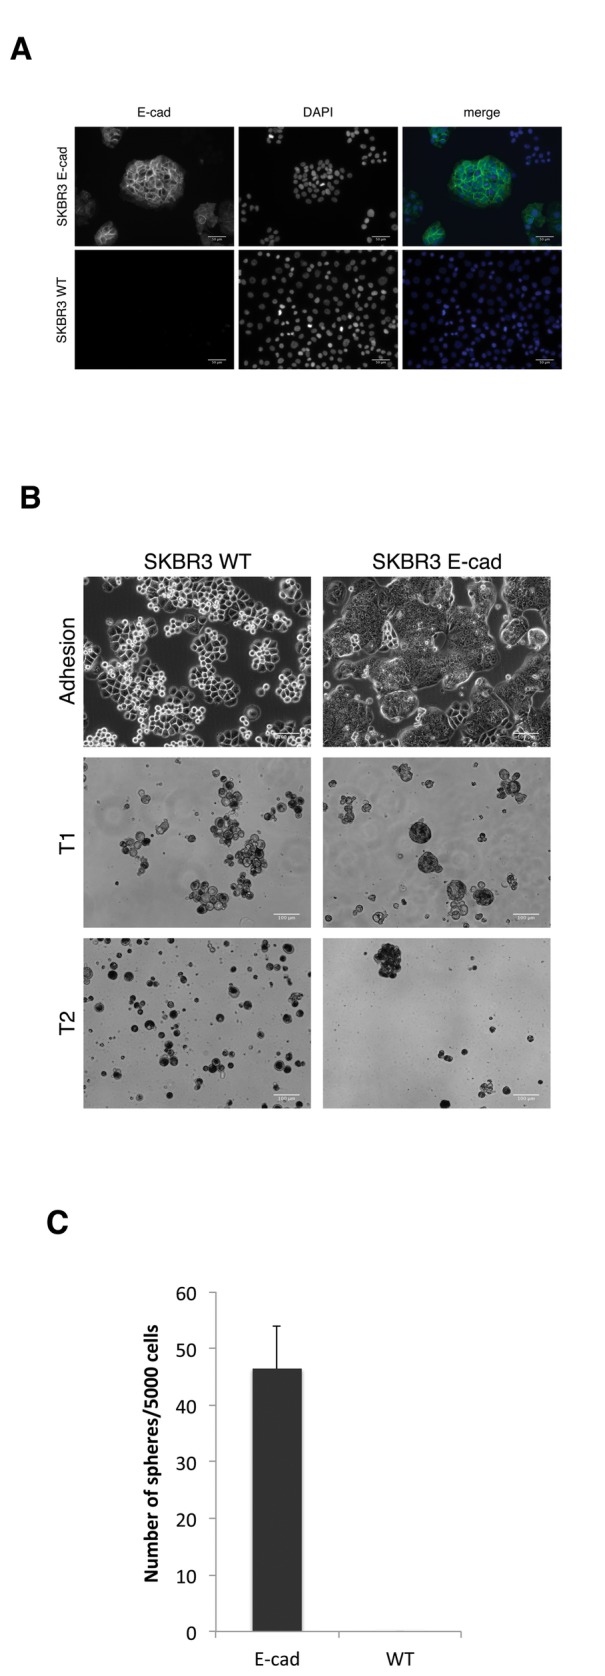
Tumors are heterogeneous at the cellular level where the ability to maintain tumor growth resides in discrete cell populations. Floating sphere-forming assays are broadly used to test stem cell activity in tissues, tumors and cell lines. Spheroids are originated from a small population of cells with stem cell features able to grow in suspension culture and behaving as tumorigenic in mice. We tested the ability of eleven common breast cancer cell lines representing the major breast cancer subtypes to grow as mammospheres, measuring the ability to maintain cell viability upon serial non-adherent passage. Only MCF7, T47D, BT474, MDA-MB-436 and JIMT1 were successfully propagated as long-term mammosphere cultures, measured as the increase in the number of viable cells upon serial non-adherent passages. Other cell lines tested (SKBR3, MDA-MB-231, MDA-MB-468 and MDA-MB-435) formed cell clumps that can be disaggregated mechanically, but cell viability drops dramatically on their second passage. HCC1937 and HCC1569 cells formed typical mammospheres, although they could not be propagated as long-term mammosphere cultures. All the sphere forming lines but MDA-MB-436 express E-cadherin on their surface. Knock down of E-cadherin expression in MCF-7 cells abrogated its ability to grow as mammospheres, while re-expression of E-cadherin in SKBR3 cells allow them to form mammospheres. Therefore, the mammosphere assay is suitable to reveal stem like features in breast cancer cell lines that express E-cadherin.
Overview
The claims and statistics of this paper haven’t been checked yet.
Run the check — free, no account needed. It reads the open-access text and checks the sources it cites.
Integrity signals
Registry
Cites
Statistics
Figures
Verification
Claims the paper makes
The claims and statistics of this paper haven’t been checked yet.
Run the check — free, no account needed. It reads the open-access text and checks the sources it cites.
Claims other papers make about this one
Each is checked against this paper’s own text: does it say what the citing paper says it does?
The check wasn’t confident either way, so it gives no verdict — never disputed.
In the citing paper
“Several studies have shown that tumor spheroids display an enhanced deposition of tumor ECM proteins (e.g., fibronectin, lumican, laminin, and collagen type I and VI) [118,121,122,123] in comparison to 2D cell culture models.”
From The Tumor-on-Chip: Recent Advances in the Development of Microfluidic Systems to Recapitulate the Physiology of Solid Tumors (2019) · cites this paper as [123]
Experimental — accuracy not yet measured
Self-check
Percentages, sums and reported differences re-computed from the paper’s own numbers.
The self-check needs the paper’s full text.
Citations
Cites
Smyth, G. K. (2004) · Statistical Applications in Genetics and Molecular Biology · doi:10.2202/1544-6115.1027 · Cited by 11,829
Research works printed but not linked: 45
- JE Visvader, 2008, Cancer stem cells in solid tumours: accumulating evidence and unresolved questions, Nat Rev Cancer, 8, 755, 10.1038/nrc2499 · DOI
- CA O’Brien, 2009, Cancer stem cells in solid tumors: an overview, Semin Radiat Oncol, 19, 71, 10.1016/j.semradonc.2008.11.001 · DOI
- M Al-Hajj, 2003, Prospective identification of tumorigenic breast cancer cells, Proc Natl Acad Sci U S A, 100, 3983, 10.1073/pnas.0530291100 · DOI
- E Mylona, 2008, The clinicopathologic and prognostic significance of CD44+/CD24(-/low) and CD44-/CD24+ tumor cells in invasive breast carcinomas, Hum Pathol, 39, 1096, 10.1016/j.humpath.2007.12.003 · DOI
- G Honeth, 2008, The CD44+/CD24- phenotype is enriched in basal-like breast tumors, Breast Cancer Res BCR, 10, R53, 10.1186/bcr2108 · DOI
- CT Jordan, 2009, Cancer stem cells: controversial or just misunderstood?, Cell Stem Cell, 4, 203, 10.1016/j.stem.2009.02.003 · DOI
- G Dontu, 2003, In vitro propagation and transcriptional profiling of human mammary stem/progenitor cells, Genes Dev, 17, 1253, 10.1101/gad.1061803 · DOI
- BA Reynolds, 1992, Generation of neurons and astrocytes from isolated cells of the adult mammalian central nervous system, Science (New York, NY), 255, 1707, 10.1126/science.1553558 · DOI · Paper page
- E Diaz-Guerra, 2012, Intrinsic cues and hormones control mouse mammary epithelial tree size, FASEB J, 26, 3844, 10.1096/fj.11-200782 · DOI
- M Serrano, 2000, The INK4a/ARF locus in murine tumorigenesis, Carcinogenesis, 21, 865, 10.1093/carcin/21.5.865 · DOI
- D Dey, 2009, Phenotypic and functional characterization of human mammary stem/progenitor cells in long term culture, PLOS ONE, 4, e5329, 10.1371/journal.pone.0005329 · DOI
- A Cicalese, 2009, The tumor suppressor p53 regulates polarity of self-renewing divisions in mammary stem cells, Cell, 138, 1083, 10.1016/j.cell.2009.06.048 · DOI
- D Ponti, 2005, Isolation and in vitro propagation of tumorigenic breast cancer cells with stem/progenitor cell properties, Cancer Res, 65, 5506, 10.1158/0008-5472.CAN-05-0626 · DOI
- MJ Grimshaw, 2008, Mammosphere culture of metastatic breast cancer cells enriches for tumorigenic breast cancer cells, Breast Cancer Res BCR, 10, R52, 10.1186/bcr2106 · DOI
- M Cioce, 2010, Mammosphere-forming cells from breast cancer cell lines as a tool for the identification of CSC-like- and early progenitor-targeting drugs, Cell Cycle (Georgetown, Tex), 9, 2878, 10.4161/cc.9.14.12371 · DOI
- SA Mani, 2008, The epithelial-mesenchymal transition generates cells with properties of stem cells, Cell, 133, 704, 10.1016/j.cell.2008.03.027 · DOI
- S Borgna, 2012, Mesenchymal traits are selected along with stem features in breast cancer cells grown as mammospheres, Cell Cycle (Georgetown, Tex), 11, 4242, 10.4161/cc.22543 · DOI
- C Oliveras-Ferraros, 2012, Epithelial-to-mesenchymal transition (EMT) confers primary resistance to trastuzumab (Herceptin), Cell Cycle (Georgetown, Tex), 11, 4020, 10.4161/cc.22225 · DOI
- O Leis, 2012, Sox2 expression in breast tumours and activation in breast cancer stem cells, Oncogene, 31, 1354, 10.1038/onc.2011.338 · DOI
- BM Bolstad, 2003, A comparison of normalization methods for high density oligonucleotide array data based on variance and bias, Bioinformatics (Oxf, England), 19, 185, 10.1093/bioinformatics/19.2.185 · DOI
- Y Benjamini, 1995, Controlling the false discovery rate: a practical and powerful approach to multiple testing, J R Stat Soc B Stat Methodol, 57, 289, 10.1111/j.2517-6161.1995.tb02031.x · DOI · Paper page
- F Al-Shahrour, 2007, From genes to functional classes in the study of biological systems, BMC Bioinformatics, 8, 114, 10.1186/1471-2105-8-114 · DOI
- I Medina, 2010, Babelomics: an integrative platform for the analysis of transcriptomics, proteomics and genomic data with advanced functional profiling, Nucleic Acids Res, 38, W210, 10.1093/nar/gkq388 · DOI
- Y Benjamini, 2001, The control of the false discovery rate in multiple testing under dependency, Ann Statist, 29, 1165, 10.1214/aos/1013699998 · DOI · Paper page
- S Götz, 2008, High-throughput functional annotation and data mining with the Blast2GO suite, Nucleic Acids Res, 36, 3420, 10.1093/nar/gkn176 · DOI
- TT Onder, 2008, Loss of E-cadherin promotes metastasis via multiple downstream transcriptional pathways, Cancer Res, 68, 3645, 10.1158/0008-5472.CAN-07-2938 · DOI
- BLK Coles-Takabe, 2008, Don’t look: growing clonal versus nonclonal neural stem cell colonies, Stem Cells (Dayton, Ohio), 26, 2938, 10.1634/stemcells.2008-0558 · DOI
- O Leis, 2011, Sox2 expression in breast tumours and activation in breast cancer stem cells, Oncogene, 31, 1354, 10.1038/onc.2011.338 · DOI
- RM Neve, 2006, A collection of breast cancer cell lines for the study of functionally distinct cancer subtypes, Cancer Cell, 10, 515, 10.1016/j.ccr.2006.10.008 · DOI
- F Elstrodt, 2006, BRCA1 mutation analysis of 41 human breast cancer cell lines reveals three new deleterious mutants, Cancer Res, 66, 41, 10.1158/0008-5472.CAN-05-2853 · DOI
- DT Ross, 2000, Systematic variation in gene expression patterns in human cancer cell lines, Nat Genet, 24, 227, 10.1038/73432 · DOI · Paper page
- RC Gentleman, 2004, Bioconductor: open software development for computational biology and bioinformatics, Genome Biol, 5, R80, 10.1186/gb-2004-5-10-r80 · DOI
- S Hiraguri, 1998, Mechanisms of inactivation of E-cadherin in breast cancer cell lines, Cancer Res, 58, 1972
- CM Fillmore, 2008, Human breast cancer cell lines contain stem-like cells that self-renew, give rise to phenotypically diverse progeny and survive chemotherapy, Breast Cancer Res, 10, R25, 10.1186/bcr1982 · DOI
- C Lehmann, 2012, Established breast cancer stem cell markers do not correlate with in vivo tumorigenicity of tumor-initiating cells, Int J Oncol, 41, 1932, 10.3892/ijo.2012.1654 · DOI
- D Sarrio, 2012, Epithelial and mesenchymal subpopulations within normal basal breast cell lines exhibit distinct stem cell/progenitor properties, Stem Cells (Dayton, Ohio), 30, 292, 10.1002/stem.791 · DOI
- D Sarrio, 2012, Epithelial and mesenchymal subpopulations within normal basal breast cell lines exhibit distinct stem cell/progenitor properties, Stem Cells, 30, 292, 10.1002/stem.791 · DOI
- PJ Keller, 2010, Mapping the cellular and molecular heterogeneity of normal and malignant breast tissues and cultured cell lines, Breast Cancer Res BCR, 12, R87, 10.1186/bcr2755 · DOI
- S Ricardo, 2011, Breast cancer stem cell markers CD44, CD24 and ALDH1: expression distribution within intrinsic molecular subtype, J Clin Pathol, 51, 1659
- FL Shaw, 2012, A detailed mammosphere assay protocol for the quantification of breast stem cell activity, J Mammary Gland Biol Neoplasia, 17, 111, 10.1007/s10911-012-9255-3 · DOI
- L Piggott, 2011, Suppression of apoptosis inhibitor c-FLIP selectively eliminates breast cancer stem cell activity in response to the anti-cancer agent, TRAIL, Breast Cancer Res BCR, 13, R88, 10.1186/bcr2945 · DOI
- E Pastrana, 2011, Eyes wide open: a critical review of sphere-formation as an assay for stem cells, Cell Stem Cell, 8, 486, 10.1016/j.stem.2011.04.007 · DOI
- PL Ryan, 2001, Tissue spreading on implantable substrates is a competitive outcome of cell-cell vs. cell-substratum adhesivity, Proc Natl Acad Sci U S A, 98, 4323, 10.1073/pnas.071615398 · DOI
- D Duguay, 2003, Cadherin-mediated cell adhesion and tissue segregation: qualitative and quantitative determinants, Dev Biol, 253, 309, 10.1016/S0012-1606(02)00016-7 · DOI
- T Celià-Terrassa, 2012, Epithelial-mesenchymal transition can suppress major attributes of human epithelial tumor-initiating cells, J Clin Invest, 122, 1849, 10.1172/JCI59218 · DOI
Cited by
Sorted by citations
Trujillo-de Santiago, G., Flores-Garza, B. G., Tavares-Negrete, J. A., Lara-Mayorga, I. M., González-Gamboa, I., Zhang, Y. S., Rojas-Martínez, A., Ortiz-López, R., & Álvarez, M. M. (2019) · Materials · doi:10.3390/ma12182945 · Cited by 184
Metadata
- Authors
- Manuel Iglesias, J., Beloqui, I., Garcia-Garcia, F., Leis, O., Vazquez-Martin, A., Eguiara, A., Cufi, S., Pavon, A., Menendez, J. A., Dopazo, J., & Martin, A. G.
- Venue
- PLoS ONE
- Publisher
- Public Library of Science (PLoS)
- Published
- 2013-10-04
- Volume
- 8
- Issue
- 10
- Pages
- e77281
- ISSN
- 1932-6203 (ISSN-L)
- PMC
- PMC3790762
- OpenAlex
- W2025690227
- Cited by
- 212
- References
- 1
- Citations by year
- 2026: 7 · 2025: 10 · 2024: 12 · 2023: 17 · 2022: 12 · 2021: 21 · 2020: 11 · 2019: 26 · 2018: 29 · 2017: 23 · 2016: 17 · 2015: 16 · 2014: 9 · 2013: 2
- FWCI
- 7.86
- Type
- journal article
- Language
- en
- Open access
- gold
- doi.org
- Locations
- PLoS ONE (publishedVersion, cc-by)
- Europe PMC (PubMed Central) (publishedVersion, cc-by)
- PubMed Central (publishedVersion, cc-by)
- PubMed (publishedVersion)
- DOAJ (DOAJ: Directory of Open Access Journals) (submittedVersion)
- Figshare (submittedVersion, cc-by)
- Funders
- Eusko Jaurlaritza
- Generalitat Valenciana
- Ministerio de Ciencia e Innovación (BIO2011-27069)
- Instituto de Salud Carlos III (CD08/00283)
- Topics
- Health Sciences › Medicine › Oncology › Cancer Cells and Metastasis
- Life Sciences › Biochemistry, Genetics and Molecular Biology › Cell Biology › Mesenchymal stem cell research
- Life Sciences › Biochemistry, Genetics and Molecular Biology › Molecular Biology › Developmental Biology and Gene Regulation
- Keywords
- mammosphere formation, breast cancer cell lines, E-cadherin, cancer stem cells, tumor heterogeneity, MCF-7 cells, SKBR3, breast cancer subtypes
- MeSH terms
- Breast Neoplasms, Female, Humans, Tumor Cells, Cultured, Neoplastic Stem Cells, Cadherins, Gene Expression, Gene Expression Regulation, Neoplastic, Cluster Analysis, Spheroids, Cellular, Gene Expression Profiling, Cell Line, Tumor, Cell Proliferation, Gene Knockdown Techniques, MCF-7 Cells
About these checks
Registry, retraction, Cites and statistics results are computed, not judged, with one exception: a printed reference that no index lists is read once by a model before it counts as a citation error. Claims are extracted by a model and kept only when their quote appears verbatim in the text; each cited source is then checked, with a model’s help, for whether it says what the claim relies on. Those verdicts can be wrong — read the claim’s quote and the cited source before relying on one.
Statistics and arithmetic are recomputed, not judged.
Confidence bands are shown only for fields calibrated on our annotated test set. None is calibrated yet, so no band is shown.
What counts as a claim ›How we measure confidence ›How we check this ›
Are you an author, or do you see a problem with this page? Request a review
