Cited by 40

The DOI matches its Crossref record; 2 of the 2 references it cites were found in a registry or an index.

Paralogs hnRNP L and hnRNP LL Exhibit Overlapping but Distinct RNA Binding Constraints

Smith, Sarah A., Ray, Debashish, Cook, Kate B., Mallory, Michael J., Hughes, Timothy R., Lynch, Kristen W.·2013·PLoS ONE

Overview

The claims and statistics of this paper haven’t been checked yet.

Run the check — free, no account needed. It reads the open-access text and checks the sources it cites.

A few free checks a day · papers already verified open instantly · results are public

Integrity signals

Registry

Crossref · 10.1371/journal.pone.0080701

Cites

2 of 2 references verified0 citation errors · 0 not checkable

Statistics

Figures

Figure 1 Domain architecture and conservation of hnRNP L and hnRNP LL. Domain structure of hnRNP L (top) or hnRNP LL (bottom) showing total protein size and relative location and size of RNA-recognition motifs (RRMs) and linker regions (grey) including the glycine-rich (G) and proline-rich (P) segments of hnRNP L. Percent amino acid identity for each domain of hnRNP L compared to the respective domain of hnRNP LL is given between protein schematics.
Figure 1 Domain architecture and conservation of hnRNP L and hnRNP LL. Domain structure of hnRNP L (top) or hnRNP LL (bottom) showing total protein size and relative location and size of RNA-recognition motifs (RRMs) and linker regions (grey) including the glycine-rich (G) and proline-rich (P) segments of hnRNP L. Percent amino acid identity for each domain of hnRNP L compared to the respective domain of hnRNP LL is given between protein schematics.CC BY · PubMed Central
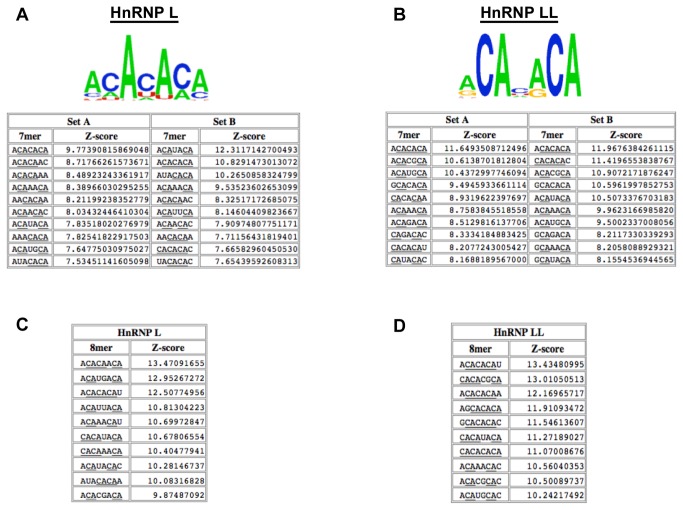
Figure 2 RNAcompete identifies overlapping but distinct k-mers as preferentially bound by hnRNP L and LL. (A) Top, position frequency matrix for the top ten heptamers in the total data set. Bottom, the ten heptamers (7-mers) with highest enrichment value (Z-score; numbers to right of sequences) in RNAcompete probe sets A and B with GST-hnRNP L. Z-score values were calculated as described previously [3]. CA dinucleotides are underlined. (B) Same as in panel A but with hnRNP LL. (C) The top ten octamers (8-mers) with highest enrichment value (Z-score; numbers to right of sequences) in the total RNAcompete data with GST-hnRNP L or (D) with hnRNP LL.
Figure 2 RNAcompete identifies overlapping but distinct k-mers as preferentially bound by hnRNP L and LL. (A) Top, position frequency matrix for the top ten heptamers in the total data set. Bottom, the ten heptamers (7-mers) with highest enrichment value (Z-score; numbers to right of sequences) in RNAcompete probe sets A and B with GST-hnRNP L. Z-score values were calculated as described previously [3]. CA dinucleotides are underlined. (B) Same as in panel A but with hnRNP LL. (C) The top ten octamers (8-mers) with highest enrichment value (Z-score; numbers to right of sequences) in the total RNAcompete data with GST-hnRNP L or (D) with hnRNP LL.CC BY · PubMed Central
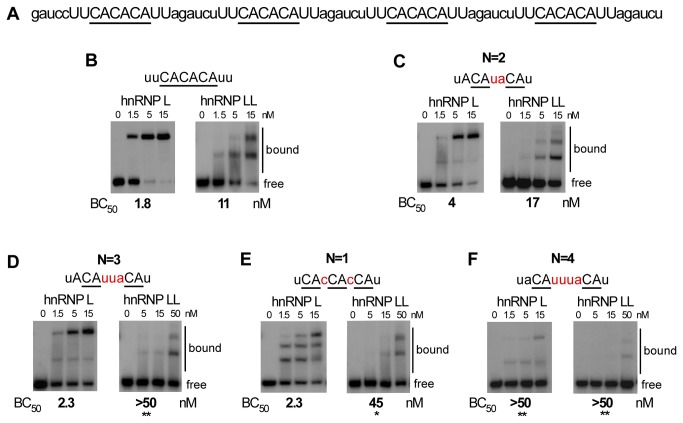
Figure 3 Binding of hnRNP LL is more sensitive than hnRNP L to spacing of CA dinucleotides. (A) Complete sequence used for binding in panel B and as backbone for experiments in Figure 3 and 5. (B-F) Representative native gel analysis (EMSA) of purified, recombinant GST-tagged hnRNP L or Flag-tagged hnRNP LL incubated with radiolabeled T7-transcribed RNAs corresponding to a variant of the sequence in panel A. For each panel the sequence shown was substituted at the capitalized positions in panel A. CA dinucleotides are underlined, for panels C-F spacers between CAs are in red (N=spacer #). Affinities (Concentration of 50% binding = BC50) from at least three independent replicates of the EMSAs are shown below gels. Bound and free probe is indicated to the right of each gel. Asterisks indicate BC50s which are significantly different from CACACA (*p<0.05, **p<0.01), as calculated by a unpaired t-test between binding values determined from a minimum of three independent protein titrations.
Figure 3 Binding of hnRNP LL is more sensitive than hnRNP L to spacing of CA dinucleotides. (A) Complete sequence used for binding in panel B and as backbone for experiments in Figure 3 and 5. (B-F) Representative native gel analysis (EMSA) of purified, recombinant GST-tagged hnRNP L or Flag-tagged hnRNP LL incubated with radiolabeled T7-transcribed RNAs corresponding to a variant of the sequence in panel A. For each panel the sequence shown was substituted at the capitalized positions in panel A. CA dinucleotides are underlined, for panels C-F spacers between CAs are in red (N=spacer #). Affinities (Concentration of 50% binding = BC50) from at least three independent replicates of the EMSAs are shown below gels. Bound and free probe is indicated to the right of each gel. Asterisks indicate BC50s which are significantly different from CACACA (*p<0.05, **p<0.01), as calculated by a unpaired t-test between binding values determined from a minimum of three independent protein titrations.CC BY · PubMed Central
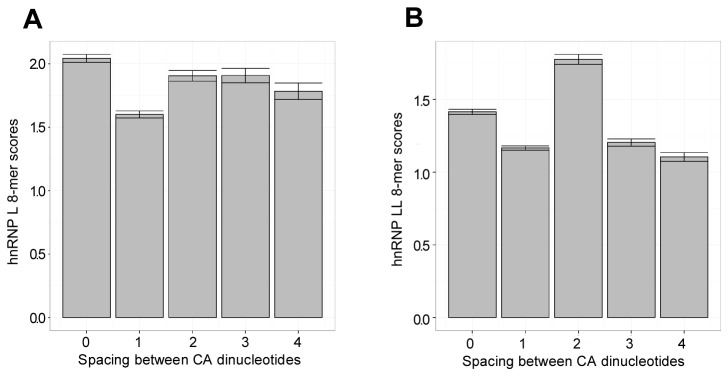
Figure 4 Complete RNAcompete data shows a hnRNP LL-specific preference for a two nucleotide spacer between CA dinucleotides. A bargraph for hnRNP L (A) and hnRNP LL (B) showing the mean Z-score for each possible spacing of 0 to 4 between two CA dinucleotides. Means were calculated for all 8-mers within the RNAcompete dataset that contain the sequence CA[N0-4]CA. Error bars show the standard error.
Figure 4 Complete RNAcompete data shows a hnRNP LL-specific preference for a two nucleotide spacer between CA dinucleotides. A bargraph for hnRNP L (A) and hnRNP LL (B) showing the mean Z-score for each possible spacing of 0 to 4 between two CA dinucleotides. Means were calculated for all 8-mers within the RNAcompete dataset that contain the sequence CA[N0-4]CA. Error bars show the standard error.CC BY · PubMed Central
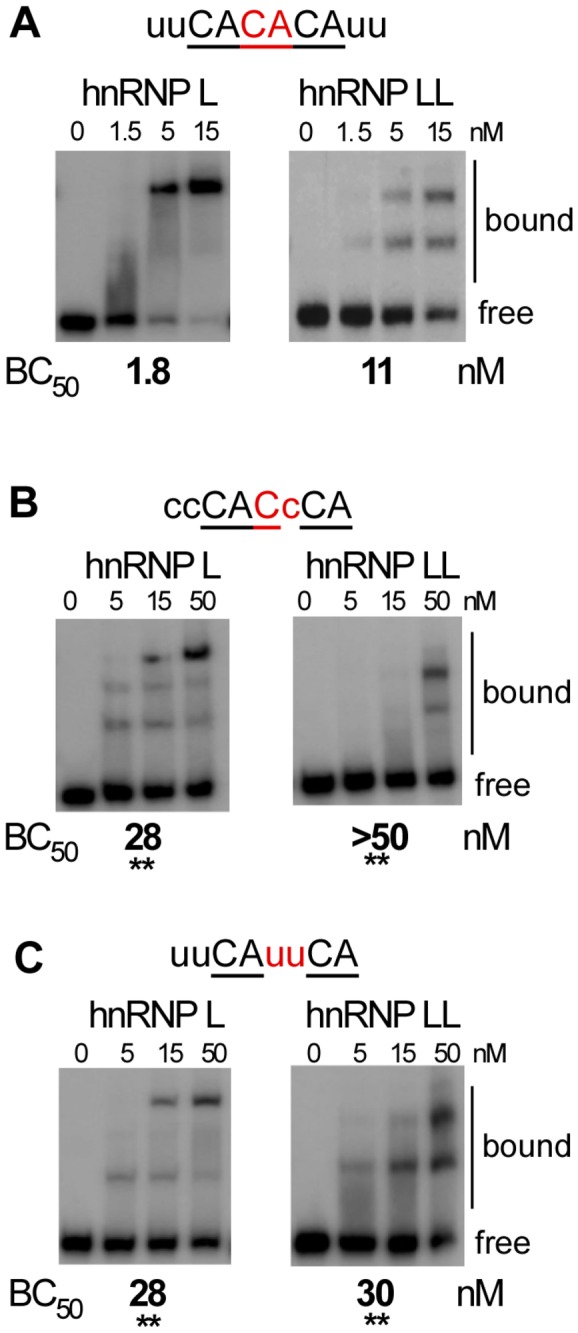
Figure 5 A pyrimidine residue prior to the second CA is detrimental to the binding of both hnRNP L and hnRNP LL. (A-C) Representative native gel analysis (EMSA) of purified, recombinant GST-tagged hnRNP L or Flag-tagged hnRNP LL incubated with radiolabeled T7-transcribed RNAs corresponding to a variant of the sequence in panel 3A. For each panel the sequence shown was substituted at the capitalized positions in panel 3A. CA dinucleotides are underlined, spacers nucleotides between CAs are in red (all have a 2-nucleotide spacer). Affinities (Concentration of 50% binding = BC50) from at least three independent replicates of the EMSAs are shown below gels. Note panel 5A is the same construct as shown in 3B, duplicated to simplify comparison of binding. Bound and free probe is indicated to the right of each gel. Asterisks indicate BC50s which are significantly different from CACACA (** p<0.01), as calculated by a unpaired t-test between binding values determined from a minimum of three independent protein titrations.
Figure 5 A pyrimidine residue prior to the second CA is detrimental to the binding of both hnRNP L and hnRNP LL. (A-C) Representative native gel analysis (EMSA) of purified, recombinant GST-tagged hnRNP L or Flag-tagged hnRNP LL incubated with radiolabeled T7-transcribed RNAs corresponding to a variant of the sequence in panel 3A. For each panel the sequence shown was substituted at the capitalized positions in panel 3A. CA dinucleotides are underlined, spacers nucleotides between CAs are in red (all have a 2-nucleotide spacer). Affinities (Concentration of 50% binding = BC50) from at least three independent replicates of the EMSAs are shown below gels. Note panel 5A is the same construct as shown in 3B, duplicated to simplify comparison of binding. Bound and free probe is indicated to the right of each gel. Asterisks indicate BC50s which are significantly different from CACACA (** p<0.01), as calculated by a unpaired t-test between binding values determined from a minimum of three independent protein titrations.CC BY · PubMed Central
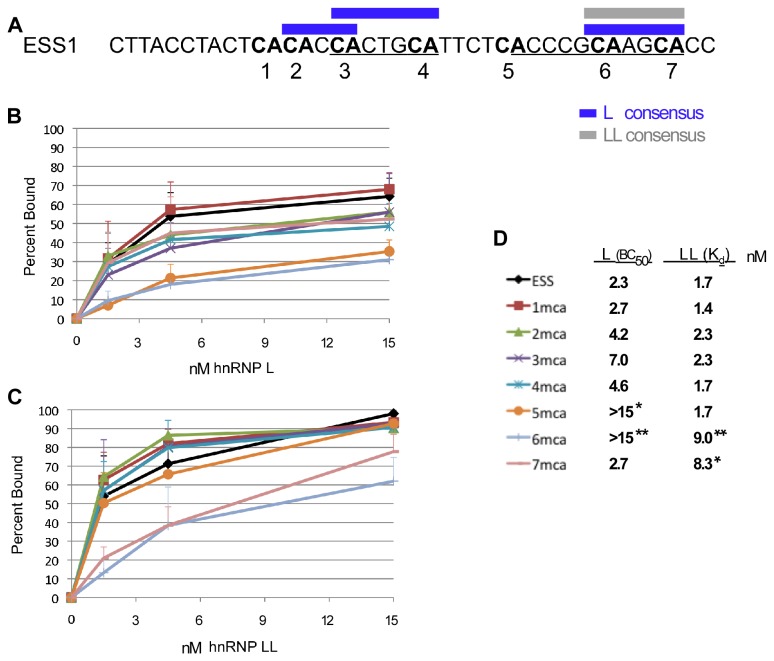
Figure 6 HnRNP L and hnRNP LL have different sensitivity to mutation of individual CA dinucleotides within the CD45 exon 4 ESS1 element. (A) Sequence of the ESS1 element from CD45 exon 4 with ARS element underlined, CA dinucleotides in bold and numbered consecutively, and segments that correspond to the above-described binding consensus for hnRNP L (L) or hnRNP LL (LL) are indicated in blue and grey respectively. (B) Binding curve for hnRNP L, as calculated from a minimum of three EMSAs, for the wildtype ESS1 or variants that are mutated at individual CAs (see panel D for legend). (C) Binding curve for hnRNP LL as described in panel B. (D) Legend for binding curves in panels B and C along with the apparent affinities for each RNA-protein combination as derived from the binding curves. Asterisks indicate affinities (concentration of 50% binding = BC50) which are significantly different from ESS (* p<0.05, ** p<0.01), as calculated by a unpaired t-test.
Figure 6 HnRNP L and hnRNP LL have different sensitivity to mutation of individual CA dinucleotides within the CD45 exon 4 ESS1 element. (A) Sequence of the ESS1 element from CD45 exon 4 with ARS element underlined, CA dinucleotides in bold and numbered consecutively, and segments that correspond to the above-described binding consensus for hnRNP L (L) or hnRNP LL (LL) are indicated in blue and grey respectively. (B) Binding curve for hnRNP L, as calculated from a minimum of three EMSAs, for the wildtype ESS1 or variants that are mutated at individual CAs (see panel D for legend). (C) Binding curve for hnRNP LL as described in panel B. (D) Legend for binding curves in panels B and C along with the apparent affinities for each RNA-protein combination as derived from the binding curves. Asterisks indicate affinities (concentration of 50% binding = BC50) which are significantly different from ESS (* p<0.05, ** p<0.01), as calculated by a unpaired t-test.CC BY · PubMed Central

Verification

Claims the paper makes

The claims and statistics of this paper haven’t been checked yet.

Run the check — free, no account needed. It reads the open-access text and checks the sources it cites.

A few free checks a day · papers already verified open instantly · results are public

Claims other papers make about this one

Each is checked against this paper’s own text: does it say what the citing paper says it does?

Self-check

Percentages, sums and reported differences re-computed from the paper’s own numbers.

The self-check needs the paper’s full text.

Citations

Cites

Research works printed but not linked: 13

  1. AV Makeyev, 2002, The poly(C)-binding proteins: a multiplicity of functions and a search for mechanisms, RNA, 8, 265, 10.1017/S1355838202024627 · DOI
  2. DD Licatalosi, 2012, Ptbp2 represses adult-specific splicing to regulate the generation of neuronal precursors in the embryonic brain, Genes Dev, 26, 1626, 10.1101/gad.191338.112 · DOI · Paper page
  3. Z Wu, 2008, Memory T cell RNA rearrangement programmed by heterogeneous nuclear ribonucleoprotein hnRNPLL, Immunity, 29, 863, 10.1016/j.immuni.2008.11.004 · DOI
  4. JD Topp, 2008, A cell-based screen for splicing regulators identifies hnRNP LL as a distinct signal-induced repressor of CD45 variable exon 4, RNA, 14, 2038, 10.1261/rna.1212008 · DOI
  5. KW Lynch, 2000, A model system for the activation-induced alternative-splicing of CD45 implicates protein kinase C and Ras, Mol Cell Biol, 20, 70, 10.1128/MCB.20.1.70-80.2000 · DOI
  6. CR Rothrock, 2005, HnRNP L represses exon splicing via a regulated exonic splicing silencer, EMBO J, 24, 2792, 10.1038/sj.emboj.7600745 · DOI
  7. F Heyd, 2010, Phosphorylation-dependent regulation of PSF by GSK3 controls CD45 alternative splicing, Mol Cell, 40, 126, 10.1016/j.molcel.2010.09.013 · DOI
  8. D Ray, 2009, Rapid and systematic analysis of the RNA recognition specificities of RNA-binding proteins, Nat Biotechnol, 27, 667, 10.1038/nbt.1550 · DOI
  9. I Pérez, 1997, Mutation of PTB binding sites causes misregulation of alternative 3' splice site selection in vivo, RNA, 3, 764
  10. LB Motta-Mena, 2010, Context-dependent regulatory mechanism of the splicing factor hnRNP L, Mol Cell, 29, 223, 10.1016/j.molcel.2009.12.027 · DOI
  11. LB Motta-Mena, 2011, A disease-associated polymorphism alters splicing of the human CD45 phosphatase gene by disrupting combinatorial repression by heterogeneous nuclear ribonucleoproteins (hnRNPs), J Biol Chem, 286, 20043, 10.1074/jbc.M111.218727 · DOI
  12. S Oberdoerffer, 2008, Regulation of CD45 alternative splicing by heterogeneous ribonucleoprotein, hnRNPLL, Science, 321, 686, 10.1126/science.1157610 · DOI
  13. J Hui, 2005, Intronic CA-repeat and CA-rich elements: a new class of regulators of mammalian alternative splicing, EMBO J, 24, 1988, 10.1038/sj.emboj.7600677 · DOI

Cited by

Sorted by citations

See all 40

Metadata

Authors
Smith, S. A., Ray, D., Cook, K. B., Mallory, M. J., Hughes, T. R., & Lynch, K. W.
Venue
PLoS ONE
Published
2013-11-11
Volume
8
Issue
11
Pages
e80701
ISSN
1932-6203
Cited by
40
References
2
Language
en

About these checks

Registry, retraction, Cites and statistics results are computed, not judged, with one exception: a printed reference that no index lists is read once by a model before it counts as a citation error. Claims are extracted by a model and kept only when their quote appears verbatim in the text; each cited source is then checked, with a model’s help, for whether it says what the claim relies on. Those verdicts can be wrong — read the claim’s quote and the cited source before relying on one.

Statistics and arithmetic are recomputed, not judged.

Confidence bands are shown only for fields calibrated on our annotated test set. None is calibrated yet, so no band is shown.

What counts as a claim ›How we measure confidence ›How we check this ›

Are you an author, or do you see a problem with this page? Request a review