

The DOI matches its Crossref record; 63 of the 63 references it cites were found in a registry or an index.
Strengths and Limitations of 16S rRNA Gene Amplicon Sequencing in Revealing Temporal Microbial Community Dynamics
Open accessAbstract
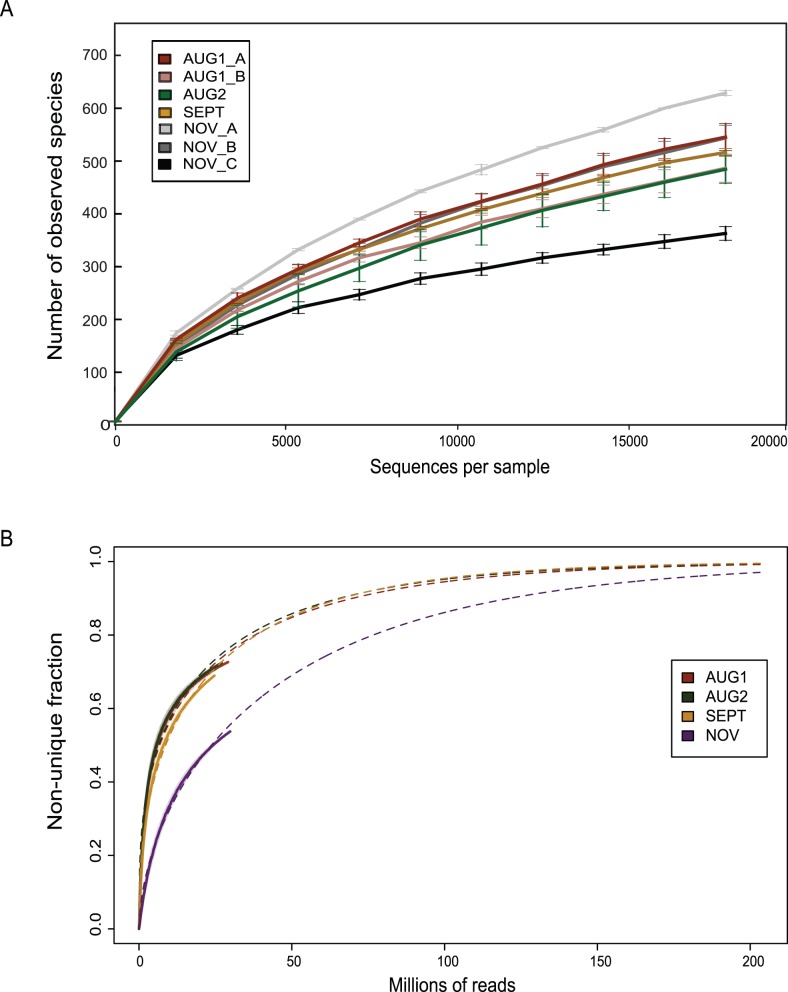
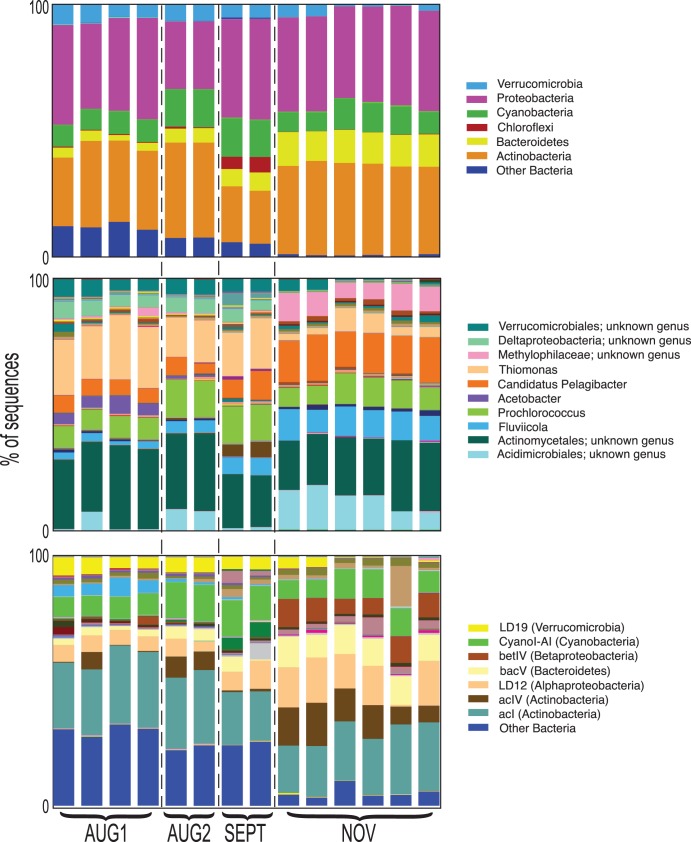
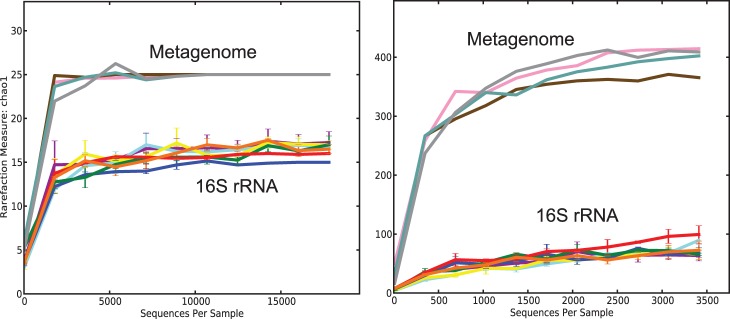
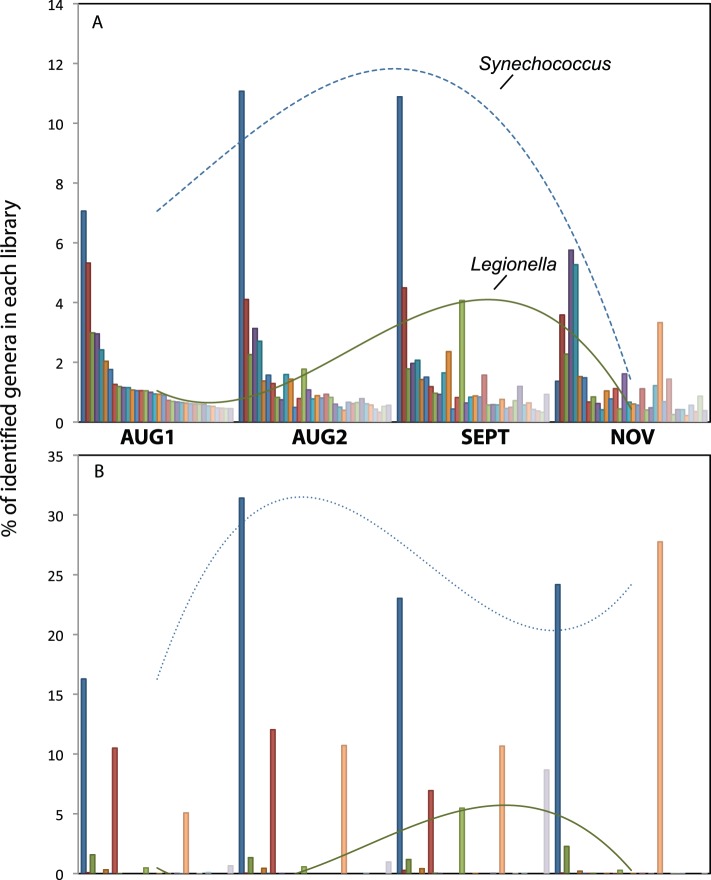
This study explored the short-term planktonic microbial community structure and resilience in Lake Lanier (GA, USA) while simultaneously evaluating the technical aspects of identifying taxa via 16S rRNA gene amplicon and metagenomic sequence data. 16S rRNA gene amplicons generated from four temporally discrete samples were sequenced with 454 GS-FLX-Ti yielding ∼40,000 rRNA gene sequences from each sample and representing ∼300 observed OTUs. Replicates obtained from the same biological sample clustered together but several biases were observed, linked to either the PCR or sequencing-preparation steps. In comparisons with companion whole-community shotgun metagenome datasets, the estimated number of OTUs at each timepoint was concordant, but 1.5 times and ∼10 times as many phyla and genera, respectively, were identified in the metagenomes. Our analyses showed that the 16S rRNA gene captures broad shifts in community diversity over time, but with limited resolution and lower sensitivity compared to metagenomic data. We also identified OTUs that showed marked shifts in abundance over four close timepoints separated by perturbations and tracked these taxa in the metagenome vs. 16S rRNA amplicon data. A strong summer storm had less of an effect on community composition than did seasonal mixing, which revealed a distinct succession of organisms. This study provides insights into freshwater microbial communities and advances the approaches for assessing community diversity and dynamics in situ.
Overview
The claims and statistics of this paper haven’t been checked yet.
Run the check — free, no account needed. It reads the open-access text and checks the sources it cites.
Integrity signals
Registry
Cites
Statistics
Figures
Verification
Claims the paper makes
The claims and statistics of this paper haven’t been checked yet.
Run the check — free, no account needed. It reads the open-access text and checks the sources it cites.
Claims other papers make about this one
Each is checked against this paper’s own text: does it say what the citing paper says it does?
In the citing paper
“Such hypervariable genes or regions permit identification of microbial community members but can be limited in their capacity to resolve phylogenetically related species or strains and do not provide information on functional gene content of the microbial members present.72”
From The oral microbiome: Role of key organisms and complex networks in oral health and disease (2021) · cites this paper as [72]
Self-check
Percentages, sums and reported differences re-computed from the paper’s own numbers.
The self-check needs the paper’s full text.
Citations
Cites
QIIME allows analysis of high-throughput community sequencing data
Caporaso, J. G., Kuczynski, J., Stombaugh, J., Bittinger, K., Bushman, F. D., Costello, E. K., Fierer, N., Peña, A. G., Goodrich, J. K., Gordon, J. I., et al. (2010) · Nature Methods · doi:10.1038/nmeth.f.303 · Cited by 34,887
Naive Bayesian Classifier for Rapid Assignment of rRNA Sequences into the New Bacterial Taxonomy
Wang, Q., Garrity, G. M., Tiedje, J. M., & Cole, J. R. (2007) · Applied and Environmental Microbiology · doi:10.1128/aem.00062-07 · Cited by 20,145
Non‐parametric multivariate analyses of changes in community structure
Clarke, K. R. (1993) · Australian Journal of Ecology · doi:10.1111/j.1442-9993.1993.tb00438.x · Cited by 14,449
Greengenes, a Chimera-Checked 16S rRNA Gene Database and Workbench Compatible with ARB
DeSantis, T. Z., Hugenholtz, P., Larsen, N., Rojas, M., Brodie, E. L., Keller, K., Huber, T., Dalevi, D., Hu, P., & Andersen, G. L. (2006) · Applied and Environmental Microbiology · doi:10.1128/aem.03006-05 · Cited by 10,891
Velvet: Algorithms for de novo short read assembly using de Bruijn graphsPreprint
Zerbino, D. R., & Birney, E. (2008) · Genome Research · doi:10.1101/gr.074492.107 · Cited by 9,587
Klindworth, A., Pruesse, E., Schweer, T., Peplies, J., Quast, C., Horn, M., & Glöckner, F. O. (2013) · Nucleic Acids Research · doi:10.1093/nar/gks808 · Cited by 8,850
Ultra-high-throughput microbial community analysis on the Illumina HiSeq and MiSeq platforms
Caporaso, J. G., Lauber, C. L., Walters, W. A., Berg-Lyons, D., Huntley, J., Fierer, N., Owens, S. M., Betley, J., Fraser, L., Bauer, M., et al. (2012) · The ISME Journal · doi:10.1038/ismej.2012.8 · Cited by 8,839
Quality-filtering vastly improves diversity estimates from Illumina amplicon sequencing
Bokulich, N. A., Subramanian, S., Faith, J. J., Gevers, D., Gordon, J. I., Knight, R. D., Mills, D. A., & Caporaso, J. G. (2012) · Nature Methods · doi:10.1038/nmeth.2276 · Cited by 4,525
Microbial diversity in the deep sea and the underexplored “rare biosphere”
Sogin, M. L., Morrison, H. G., Huber, J. A., Welch, D. B. M., Huse, S. M., Neal, P. R., Arrieta, J. M., & Herndl, G. J. (2006) · Proceedings of the National Academy of Sciences · doi:10.1073/pnas.0605127103 · Cited by 3,803
Bacterial Community Variation in Human Body Habitats Across Space and Time
Costello, E. K., Lauber, C. L., Hamady, M., Fierer, N., Gordon, J. I., & Knight, R. (2009) · Science · doi:10.1126/science.1177486 · Cited by 3,231
Cited by
Sorted by citations
Cryan, J. F., O'Riordan, K. J., Cowan, C. S. M., Sandhu, K. V., Bastiaanssen, T. F. S., Boehme, M., Codagnone, M. G., Cussotto, S., Fulling, C., Golubeva, A. V., et al. (2019) · Physiological Reviews · doi:10.1152/physrev.00018.2018 · Cited by 5,286
Introduction to the human gut microbiota
Thursby, E., & Juge, N. (2017) · Biochemical Journal · doi:10.1042/bcj20160510 · Cited by 3,600
Rinninella, E., Raoul, P., Cintoni, M., Franceschi, F., Miggiano, G. A. D., Gasbarrini, A., & Mele, M. C. (2019) · Microorganisms · doi:10.3390/microorganisms7010014 · Cited by 3,462
Gut microbiota and human NAFLD: disentangling microbial signatures from metabolic disorders
Aron‐Wisnewsky, J., Vigliotti, C., Witjes, J. J., Le, P. T., Holleboom, A. G., Verheij, J., Nieuwdorp, M., & Clément, K. (2020) · Nature Reviews Gastroenterology & Hepatology · doi:10.1038/s41575-020-0269-9 · Cited by 1,132
Analysis of the microbiome: Advantages of whole genome shotgun versus 16S amplicon sequencing
Ranjan, R., Rani, A., Metwally, A., McGee, H. S., & Perkins, D. L. (2016) · Biochemical and Biophysical Research Communications · doi:10.1016/j.bbrc.2015.12.083 · Cited by 981
Metadata
- Authors
- Poretsky, R., Rodriguez-R, L. M., Luo, C., Tsementzi, D., & Konstantinidis, K. T.
- Affiliations
- Georgia Institute of Technology (US)
- Corresponding author
- Poretsky, Rachel
- Venue
- PLoS ONE
- Publisher
- Public Library of Science (PLoS)
- Published
- 2014-04-08
- Volume
- 9
- Issue
- 4
- Pages
- e93827
- ISSN
- 1932-6203 (ISSN-L)
- PMC
- PMC3979728
- OpenAlex
- W2019163239
- Cited by
- 684
- References
- 63
- Citations by year
- 2026: 50 · 2025: 70 · 2024: 45 · 2023: 78 · 2022: 71 · 2021: 83 · 2020: 69 · 2019: 67 · 2018: 62 · 2017: 37 · 2016: 29 · 2015: 20 · 2014: 2
- FWCI
- 25.43
- Type
- journal article
- Language
- en
- Open access
- gold
- doi.org
- Locations
- PLoS ONE (publishedVersion, cc-by)
- Europe PMC (PubMed Central) (publishedVersion, other-oa)
- PubMed Central (publishedVersion, cc-by)
- PubMed (publishedVersion)
- OSTI OAI (U.S. Department of Energy Office of Scientific and Technical Information) (submittedVersion)
- DOAJ (DOAJ: Directory of Open Access Journals) (submittedVersion, cc-by-sa)
- Funders
- National Science Foundation (1241046)
- U.S. Department of Energy (DESC0006662)
- Emory University
- Topics
- Physical Sciences › Environmental Science › Ecology › Microbial Community Ecology and Physiology
- Physical Sciences › Environmental Science › Ecology › Environmental DNA in Biodiversity Studies
- Life Sciences › Biochemistry, Genetics and Molecular Biology › Molecular Biology › Genomics and Phylogenetic Studies
- Keywords
- 16S rRNA gene amplicon sequencing, metagenomics, planktonic microbial communities, freshwater microbial communities, Lake Lanier, community resilience, sequencing bias, PCR bias, seasonal mixing, storm disturbance, microbial succession, community diversity
- MeSH terms
- Bacteria, Fresh Water, Plankton, RNA, Ribosomal, 16S, Metagenome, Metagenomics
About these checks
Registry, retraction, Cites and statistics results are computed, not judged, with one exception: a printed reference that no index lists is read once by a model before it counts as a citation error. Claims are extracted by a model and kept only when their quote appears verbatim in the text; each cited source is then checked, with a model’s help, for whether it says what the claim relies on. Those verdicts can be wrong — read the claim’s quote and the cited source before relying on one.
Statistics and arithmetic are recomputed, not judged.
Confidence bands are shown only for fields calibrated on our annotated test set. None is calibrated yet, so no band is shown.
What counts as a claim ›How we measure confidence ›How we check this ›
Are you an author, or do you see a problem with this page? Request a review
