

The DOI matches its Crossref record; 36 of the 36 references it cites were found in a registry or an index.
Synergistic and Antagonistic Drug Combinations Depend on Network Topology
Open accessAbstract
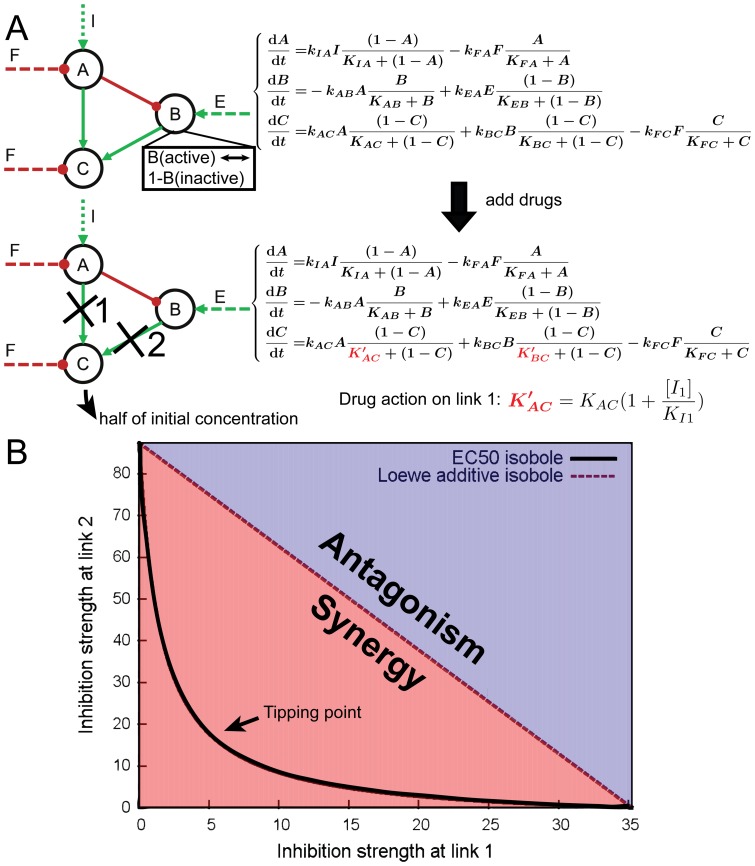
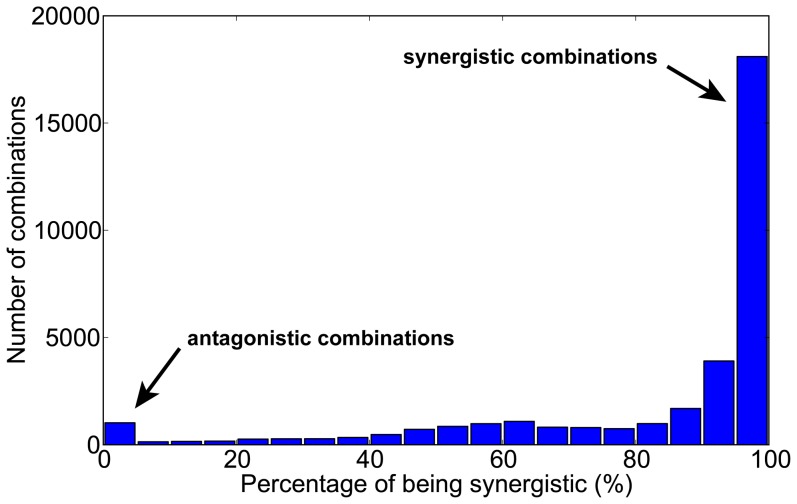
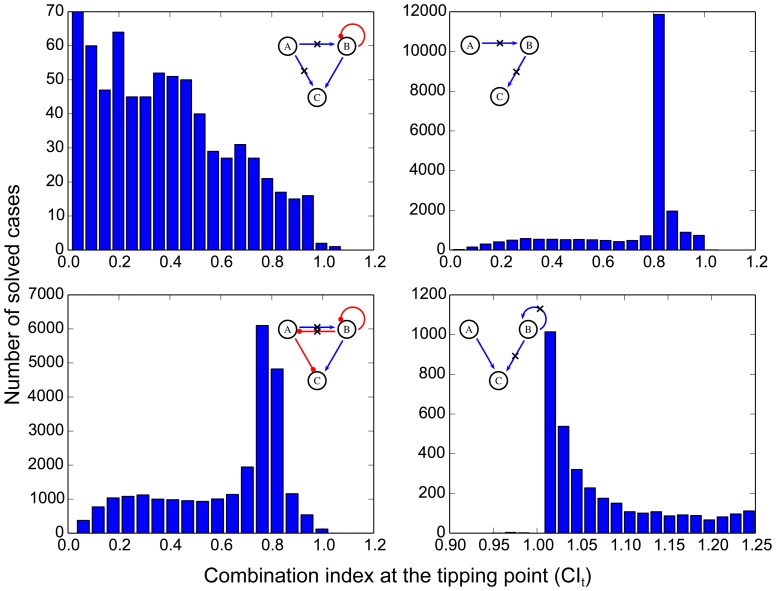
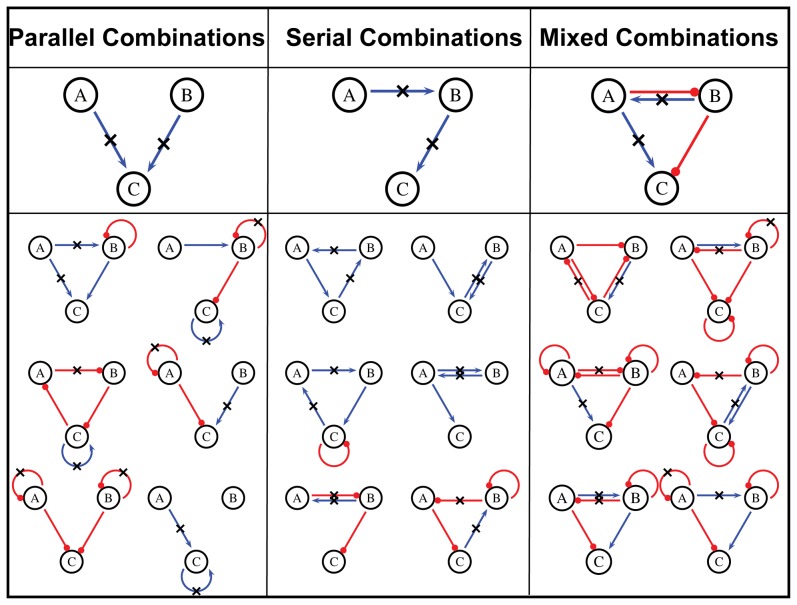
Drug combinations may exhibit synergistic or antagonistic effects. Rational design of synergistic drug combinations remains a challenge despite active experimental and computational efforts. Because drugs manifest their action via their targets, the effects of drug combinations should depend on the interaction of their targets in a network manner. We therefore modeled the effects of drug combinations along with their targets interacting in a network, trying to elucidate the relationships between the network topology involving drug targets and drug combination effects. We used three-node enzymatic networks with various topologies and parameters to study two-drug combinations. These networks can be simplifications of more complex networks involving drug targets, or closely connected target networks themselves. We found that the effects of most of the combinations were not sensitive to parameter variation, indicating that drug combinational effects largely depend on network topology. We then identified and analyzed consistent synergistic or antagonistic drug combination motifs. Synergistic motifs encompass a diverse range of patterns, including both serial and parallel combinations, while antagonistic combinations are relatively less common and homogenous, mostly composed of a positive feedback loop and a downstream link. Overall our study indicated that designing novel synergistic drug combinations based on network topology could be promising, and the motifs we identified could be a useful catalog for rational drug combination design in enzymatic systems.
Overview
The claims and statistics of this paper haven’t been checked yet.
Run the check — free, no account needed. It reads the open-access text and checks the sources it cites.
Integrity signals
Registry
Cites
Statistics
Figures
Verification
Claims the paper makes
The claims and statistics of this paper haven’t been checked yet.
Run the check — free, no account needed. It reads the open-access text and checks the sources it cites.
Claims other papers make about this one
Each is checked against this paper’s own text: does it say what the citing paper says it does?
In the citing paper
“To this end, graph representation learning methods, such as GNNs, have been developed to learn robust and meaningful representations of molecules despite the incomplete interactome [102] and to inductively infer new edges between pairs of nodes [154].”
From Graph representation learning in biomedicine and healthcare (2022) · cites this paper as [102]
Self-check
Percentages, sums and reported differences re-computed from the paper’s own numbers.
The self-check needs the paper’s full text.
Citations
Cites
McKay, M. D., Beckman, R. J., & Conover, W. J. (2000) · Technometrics · doi:10.2307/1271432 · Cited by 8,270
Drug combination studies and their synergy quantification using the Chou-Talalay method
Chou, T.-C. (2010) · Cancer Research · doi:10.1158/0008-5472.can-09-1947 · Cited by 5,739
McKay, M. D., Beckman, R., & Conover, W. J. (1979) · Technometrics · doi:10.2307/1268522 · Cited by 3,834
The search for synergy: a critical review from a response surface perspective.
Greco, W. R., Bravo, G., & Parsons, J. C. (1995) · Pharmacological Reviews · doi:10.1016/s0031-6997(25)06847-4 · Cited by 1,445
Synergistic drug combinations tend to improve therapeutically relevant selectivity
Lehár, J., Krueger, A., Avery, W., Heilbut, A. M., Johansen, L. M., Price, E. R., Rickles, R. J., Short, G. F., Staunton, J. E., Jin, X., et al. (2009) · Nature Biotechnology · doi:10.1038/nbt.1549 · Cited by 959
Defining Network Topologies that Can Achieve Biochemical Adaptation
Ma, W., Trusina, A., El-Samad, H., Lim, W. A., & Tang, C. (2009) · Cell · doi:10.1016/j.cell.2009.06.013 · Cited by 919
Self-citationMulticomponent therapeutics for networked systems
Keith, C. T., Borisy, A. A., & Stockwell, B. R. (2005) · Nature Reviews Drug Discovery · doi:10.1038/nrd1609 · Cited by 769
Systematic discovery of multicomponent therapeutics
Borisy, A. A., Elliott, P. J., Hurst, N. W., Lee, M. S., Lehár, J., Price, E. R., Serbedzija, G., Zimmermann, G. R., Foley, M. A., Stockwell, B. R., et al. (2003) · Proceedings of the National Academy of Sciences · doi:10.1073/pnas.1337088100 · Cited by 620
Systems biology and combination therapy in the quest for clinical efficacy
Fitzgerald, J. B., Schoeberl, B., Nielsen, U. B., & Sorger, P. K. (2006) · Nature Chemical Biology · doi:10.1038/nchembio817 · Cited by 570
Antibiotic interactions that select against resistance
Chait, R., Craney, A., & Kishony, R. (2007) · Nature · doi:10.1038/nature05685 · Cited by 439
Li, S., Zhang, B., & Zhang, N. (2011) · BMC Systems Biology · doi:10.1186/1752-0509-5-s1-s10 · Cited by 381
Drug interactions and the evolution of antibiotic resistance
Yeh, P. J., Hegreness, M. J., Aiden, A. P., & Kishony, R. (2009) · Nature Reviews Microbiology · doi:10.1038/nrmicro2133 · Cited by 350
Functional classification of drugs by properties of their pairwise interactions
Yeh, P. J., Tschumi, A. I., & Kishony, R. (2006) · Nature Genetics · doi:10.1038/ng1755 · Cited by 348
Systematic exploration of synergistic drug pairs
Cokol, M., Chua, H. N., Tasan, M., Mutlu, B., Weinstein, Z., Suzuki, Y., Nergiz, M. E., Costanzo, M., Baryshnikova, A., Giaever, G. N., et al. (2011) · Molecular Systems Biology · doi:10.1038/msb.2011.71 · Cited by 308
Ribavirin Antagonizes the Effect of Azidothymidine on HIV Replication
Vogt, M. W., Hartshorn, K. L., Furman, P. A., Chou, T., Fyfe, J. A., Coleman, L. A., Crumpacker, C. S., Schooley, R. T., & Hirsch, M. (1987) · Science · doi:10.1126/science.2435003 · Cited by 277
Chemical combination effects predict connectivity in biological systems
Lehár, J., Zimmermann, G. R., Krueger, A. S., Molnar, R. A., Ledell, J. T., Heilbut, A. M., Short, G. F., Giusti, L. C., Nolan, G. P., Magid, O. A., et al. (2007) · Molecular Systems Biology · doi:10.1038/msb4100116 · Cited by 275
Nonoptimal microbial response to antibiotics underlies suppressive drug interactions
Bollenbach, T., Quan, S., Chait, R., & Kishony, R. (2009) · Cell · doi:10.1016/j.cell.2009.10.025 · Cited by 227
Finding multiple target optimal intervention in disease‐related molecular network
Yang, K., Bai, H., Ouyang, Q., Lai, L., & Tang, C. (2008) · Molecular Systems Biology · doi:10.1038/msb.2008.60 · Cited by 186
Self-citationProteins, drug targets and the mechanisms they control: the simple truth about complex networks
Araujo, R. P., Liotta, L. A., & Petricoin, E. F. (2007) · Nature Reviews Drug Discovery · doi:10.1038/nrd2381 · Cited by 172
Meng, J., Dai, B., Fang, B., Bekele, B. N., Bornmann, W. G., Sun, D., Peng, Z., Herbst, R. S., Papadimitrakopoulou, V. A., Minna, J. D., et al. (2010) · PLoS ONE · doi:10.1371/journal.pone.0014124 · Cited by 146
Systematic identification of synergistic drug pairs targeting HIV
Tan, X., Hu, L., Luquette, L. J., Gao, G., Liu, Y., Qu, H., Xi, R., Lu, Z. J., Park, P. J., & Elledge, S. J. (2012) · Nature Biotechnology · doi:10.1038/nbt.2391 · Cited by 137
Origin of bistability underlying mammalian cell cycle entry
Yao, G., Tan, C., West, M., Nevins, J. R., & You, L. (2011) · Molecular Systems Biology · doi:10.1038/msb.2011.19 · Cited by 128
Systems approaches and algorithms for discovery of combinatorial therapies
Feala, J. D., Cortes, J., Duxbury, P. M., Piermarocchi, C., McCulloch, A. D., & Paternostro, G. (2009) · WIREs Systems Biology and Medicine · doi:10.1002/wsbm.51 · Cited by 116
Dynamic Simulations on the Arachidonic Acid Metabolic Network
Yang, K., Ma, W., Liang, H., Ouyang, Q., Tang, C., & Lai, L. (2007) · PLoS Computational Biology · doi:10.1371/journal.pcbi.0030055 · Cited by 115
Self-citationMolhoek, K. R., Brautigan, D. L., & Slingluff, C. L. (2005) · Journal of Translational Medicine · doi:10.1186/1479-5876-3-39 · Cited by 112
GNU Scientific Library - Reference Manual
Galassi, M. C., Davies, J., Theiler, J. P., Gough, B., Jungman, G., Booth, M., & Fabrice Rossi, A. (2001) · Cited by 102
DCDB: Drug combination database
Liu, Y., Hu, B. X., Cheng‐Xin, F. U., & Chen, X. (2009) · Bioinformatics · doi:10.1093/bioinformatics/btp697 · Cited by 97
Chemogenomic profiling predicts antifungal synergies
Jansen, G., Lee, A. Y., Epp, E., Fredette, A., Surprenant, J., Harcus, D., Scott, M. S., Tan, E., Nishimura, T., Whiteway, M. S., et al. (2009) · Molecular Systems Biology · doi:10.1038/msb.2009.95 · Cited by 80
Wang, H., Daouti, S., Li, W., Yang, W., Rizzo, C., Higgins, B., Packman, K. E., Rosen, N. X., Boylan, J. F., Heimbrook, D. C., et al. (2011) · Cancer Research · doi:10.1158/0008-5472.can-10-4351 · Cited by 76
Yan, H., Zhang, B., Li, S., & Zhao, Q. (2010) · BMC Systems Biology · doi:10.1186/1752-0509-4-50 · Cited by 73
Xu, S., Li, S., Guo, Z., Luo, J. R., Ellis, M. J., & Ma, C. X. (2013) · Molecular Cancer Therapeutics · doi:10.1158/1535-7163.mct-13-0159 · Cited by 46
Neighbor communities in drug combination networks characterize synergistic effect
Zou, J., Ji, P., Zhao, Y., Li, L., Wei, Y.-Q., Chen, Y., & Yang, S. (2012) · Molecular BioSystems · doi:10.1039/c2mb25267h · Cited by 38
Sequential Blockage as a Theoretical Basis for Drug Synergism
Black, M. L. (1963) · Journal of Medicinal Chemistry · doi:10.1021/jm00338a014 · Cited by 27
Parsimonious Discovery of Synergistic Drug Combinations
Severyn, B. S., Liehr, R. A., Wolicki, A., Nguyen, K. H., Hudak, E. M., Ferrer, M., Caldwell, J. S., Hermes, J. D., Li, J., & Tudor, M. (2011) · ACS Chemical Biology · doi:10.1021/cb2003225 · Cited by 26
Morita, M., Suyama, H., Igishi, T., Shigeoka, Y., Kodani, M., Hashimoto, K., Takeda, K., Sumikawa, T., & Shimizu, E. (2007) · International Journal of Oncology · doi:10.3892/ijo.30.1.187 · Cited by 23
Dose-Response Aligned Circuits in Signaling Systems
Yan, L., Ouyang, Q., & Wang, H. (2012) · PLoS ONE · doi:10.1371/journal.pone.0034727 · Cited by 16
Self-citation
Cited by
Sorted by citations
PD-L1 Distribution and Perspective for Cancer Immunotherapy—Blockade, Knockdown, or Inhibition
Wu, Y., Chen, W., Xu, Z. P., & Gu, W. (2019) · Frontiers in Immunology · doi:10.3389/fimmu.2019.02022 · Cited by 423
Graph representation learning in biomedicine and healthcare
Li, M. M., Huang, K., & Zitnik, M. (2022) · Nature Biomedical Engineering · doi:10.1038/s41551-022-00942-x · Cited by 294
“For example, according to a corollary of the local hypothesis 13 , the topology of drug combinations is indicative of synergistic or antagonistic relationships 102 .”
NLLSS: Predicting Synergistic Drug Combinations Based on Semi-supervised Learning
Chen, X., Ren, B., Chen, M., Wang, Q., Zhang, L., & Yan, G. (2016) · PLoS Computational Biology · doi:10.1371/journal.pcbi.1004975 · Cited by 284
Computational Multitarget Drug Design
Zhang, W., Pei, J., & Lai, L. (2017) · Journal of Chemical Information and Modeling · doi:10.1021/acs.jcim.6b00491 · Cited by 189
Self-citationSystems biology approaches for advancing the discovery of effective drug combinations
Ryall, K. A., & Tan, A. C. (2015) · Journal of Cheminformatics · doi:10.1186/s13321-015-0055-9 · Cited by 160
Metadata
- Authors
- Yin, N., Ma, W., Pei, J., Ouyang, Q., Tang, C., & Lai, L.
- Affiliations
- Peking University (CN)
- Harvard University (US)
- Corresponding author
- Lai, Luhua
- Venue
- PLoS ONE
- Publisher
- Public Library of Science (PLoS)
- Published
- 2014-04-08
- Volume
- 9
- Issue
- 4
- Pages
- e93960
- ISSN
- 1932-6203 (ISSN-L)
- PMC
- PMC3979733
- OpenAlex
- W2015789827
- Cited by
- 139
- References
- 36
- Citations by year
- 2026: 2 · 2025: 12 · 2024: 12 · 2023: 22 · 2022: 12 · 2021: 15 · 2020: 12 · 2019: 15 · 2018: 8 · 2017: 9 · 2016: 11 · 2015: 7 · 2014: 2
- FWCI
- 3.96
- Type
- journal article
- Language
- en
- Open access
- gold
- doi.org
- Locations
- PLoS ONE (publishedVersion, cc-by)
- Europe PMC (PubMed Central) (publishedVersion, other-oa)
- PubMed Central (publishedVersion, cc-by)
- PubMed (publishedVersion)
- Digital Access to Scholarship at Harvard (DASH) (Harvard University) (submittedVersion, cc-by)
- DOAJ (DOAJ: Directory of Open Access Journals) (submittedVersion, cc-by-sa)
- Greater South Information System
- Funders
- National Natural Science Foundation of China (91313302, 90913021, 81273436, 2012AA020301, 2012AA020308)
- National Institute on Alcohol Abuse and Alcoholism (R01AA020308)
- Topics
- Life Sciences › Biochemistry, Genetics and Molecular Biology › Molecular Biology › Gene Regulatory Network Analysis
- Life Sciences › Pharmacology, Toxicology and Pharmaceutics › Drug Discovery › Computational Drug Discovery Methods
- Life Sciences › Biochemistry, Genetics and Molecular Biology › Molecular Biology › Bioinformatics and Genomic Networks
- Keywords
- combination therapy, drug synergy, drug antagonism, network topology, drug-target network, three-node network, positive feedback loop, network motifs
- MeSH terms
- Drug Combinations, Drug Interactions, Drug Synergism, Models, Theoretical, Drug Design
About these checks
Registry, retraction, Cites and statistics results are computed, not judged, with one exception: a printed reference that no index lists is read once by a model before it counts as a citation error. Claims are extracted by a model and kept only when their quote appears verbatim in the text; each cited source is then checked, with a model’s help, for whether it says what the claim relies on. Those verdicts can be wrong — read the claim’s quote and the cited source before relying on one.
Statistics and arithmetic are recomputed, not judged.
Confidence bands are shown only for fields calibrated on our annotated test set. None is calibrated yet, so no band is shown.
What counts as a claim ›How we measure confidence ›How we check this ›
Are you an author, or do you see a problem with this page? Request a review
