

The DOI matches its Crossref record; 83 of the 83 references it cites were found in a registry or an index.
Disrupted Functional Brain Connectivity and Its Association to Structural Connectivity in Amnestic Mild Cognitive Impairment and Alzheimer’s Disease
Open accessAbstract
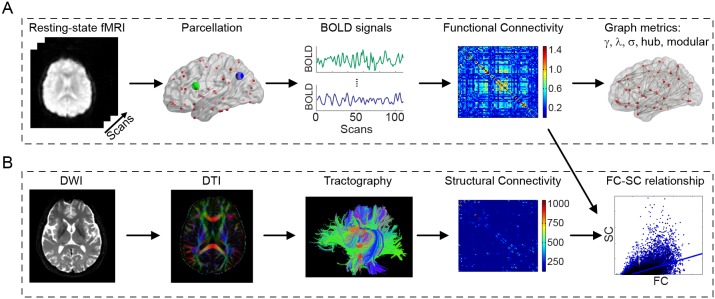
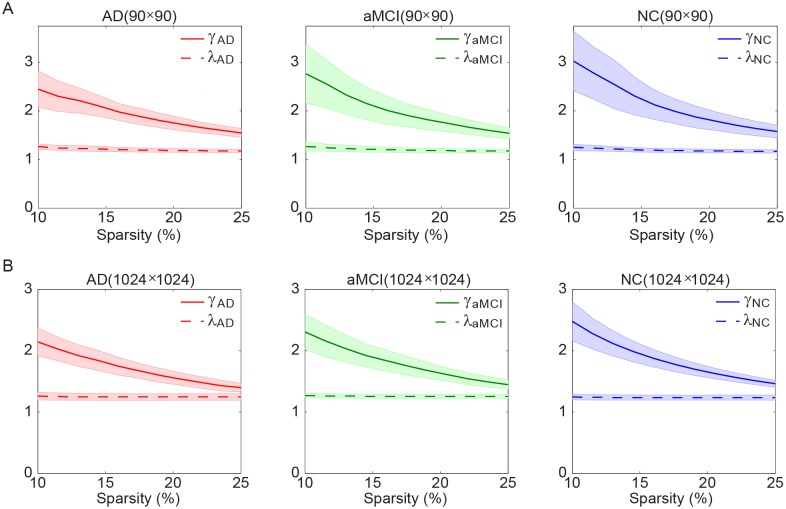
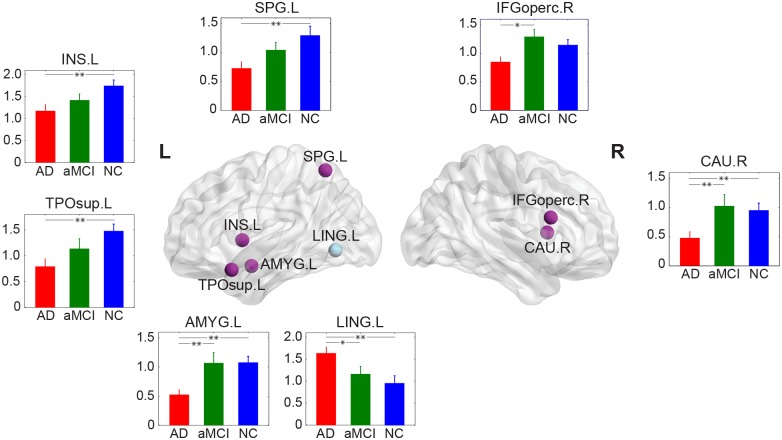
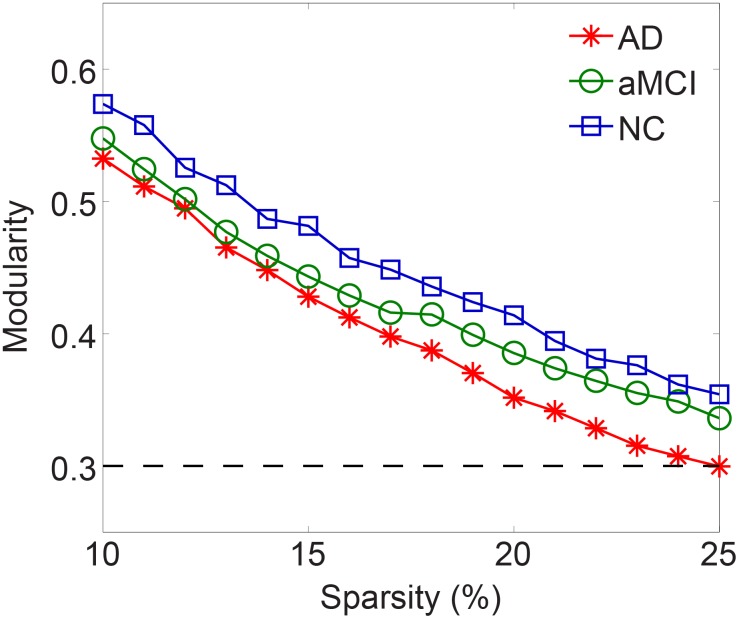
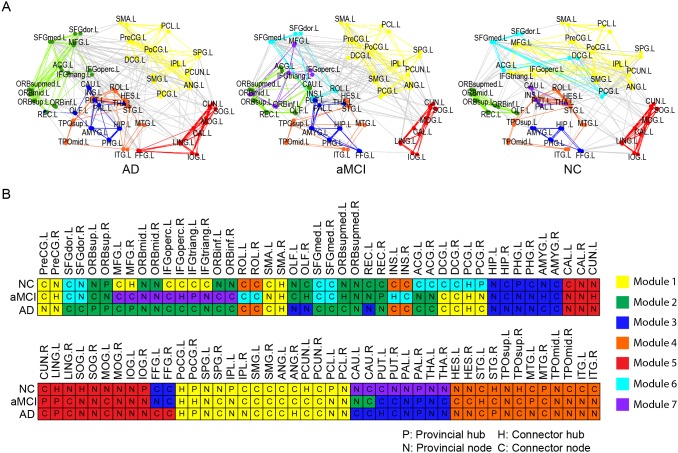
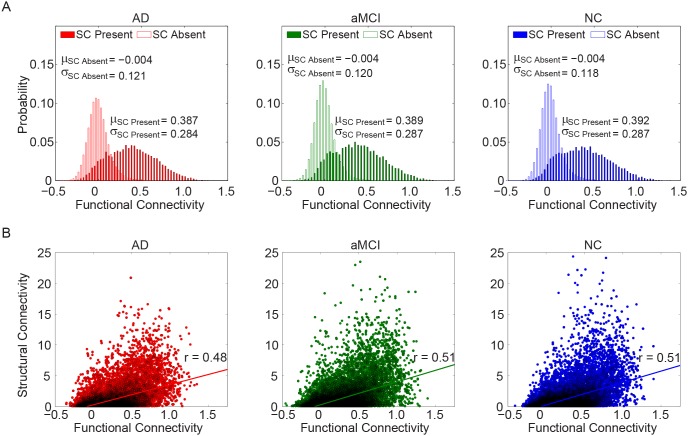
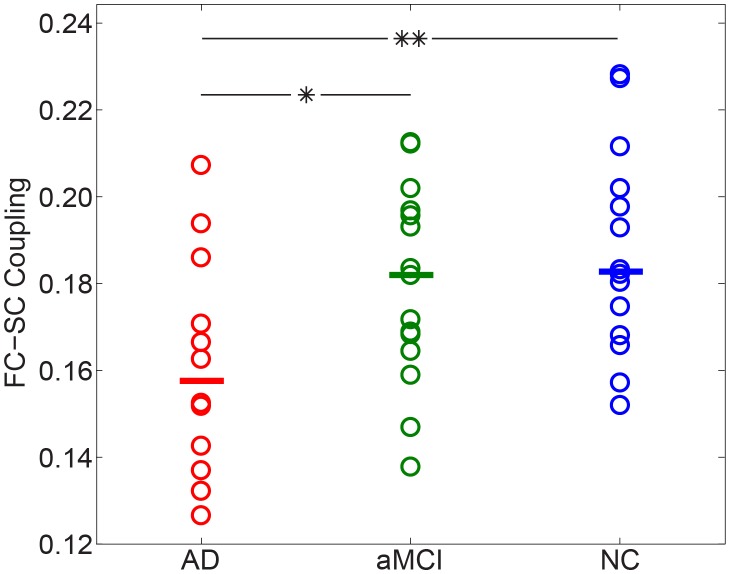
Although anomalies in the topological architecture of whole-brain connectivity have been found to be associated with Alzheimer's disease (AD), our understanding about the progression of AD in a functional connectivity (FC) perspective is still rudimentary and few study has explored the function-structure relations in brain networks of AD patients. By using resting-state functional MRI (fMRI), this study firstly investigated organizational alternations in FC networks in 12 AD patients, 15 amnestic mild cognitive impairment (aMCI) patients, and 14 age-matched healthy aging subjects and found that all three groups exhibit economical small-world network properties. Nonetheless, we found a decline of the optimal architecture in the progression of AD, represented by a more localized modular organization with less efficient local information transfer. Our results also show that aMCI forms a boundary between normal aging and AD and represents a functional continuum between healthy aging and the earliest signs of dementia. Moreover, we revealed a dissociated relationship between the overall FC and structural connectivity (SC) in AD patients. In this study, diffusion tensor imaging tractography was used to map the structural network of the same individuals. The decreased FC-SC coupling may be indicative of more stringent and less dynamic brain function in AD patients. Our findings provided insightful implications for understanding the pathophysiological mechanisms of brain dysfunctions in aMCI and AD patients and demonstrated that functional disorders can be characterized by multimodal neuroimaging-based metrics.
Overview
The claims and statistics of this paper haven’t been checked yet.
Run the check — free, no account needed. It reads the open-access text and checks the sources it cites.
Integrity signals
Registry
Cites
Statistics
Figures
Verification
Claims the paper makes
The claims and statistics of this paper haven’t been checked yet.
Run the check — free, no account needed. It reads the open-access text and checks the sources it cites.
Claims other papers make about this one
Each is checked against this paper’s own text: does it say what the citing paper says it does?
The cited source says what the claim attributes to it.
In the citing paper
“Previous DTI and fMRI connectome studies of patients with AD have also demonstrated lower normalized clustering, small-worldness, and modularity (Brier et al., 2014; Sun et al., 2014; Supekar, Menon, Rubin, Musen, & Greicius, 2008).”
From Functional and structural connectome properties in the 5XFAD transgenic mouse model of Alzheimer’s disease (2018) · cites this paper as Sun et al., 2014
The cited source says what the claim attributes to it.
In the citing paper
“However, Sun et al. (2014) observed lower structure-function coupling in connectomes of patients with AD.”
From Functional and structural connectome properties in the 5XFAD transgenic mouse model of Alzheimer’s disease (2018) · cites this paper as Sun et al. (2014)
Self-check
Percentages, sums and reported differences re-computed from the paper’s own numbers.
The self-check needs the paper’s full text.
Citations
Cites
Folstein, M. F., Folstein, S. E., & McHugh, P. R. (1975) · Journal of Psychiatric Research · doi:10.1016/0022-3956(75)90026-6 · Cited by 88,282
Collective dynamics of ‘small-world’ networks
Watts, D. J., & Strogatz, S. H. (1998) · Nature · doi:10.1038/30918 · Cited by 43,060
McKhann, G., Drachman, D., Folstein, M., Katzman, R., Price, D., & Stadlan, E. M. (1984) · Neurology · doi:10.1212/wnl.34.7.939 · Cited by 27,915
Hirono, N., Mori, E., Ikejiri, Y., Imamura, T., Shimomura, T., Hashimoto, M., Yamashita, H., & Ikeda, M. (1997) · PubMed · Cited by 21,012
Kok, J. S., Berg, I. J., & Scherder, E. J. A. (2013) · Dementia and Geriatric Cognitive Disorders Extra · doi:10.1159/000353441 · Cited by 20,589
Older Adults' Reasons for Using Technology while Aging in Place
Peek, S. T. M., Luijkx, K. G., Rijnaard, M. D., Nieboer, M. E., van der Voort, C. S., Aarts, S., van Hoof, J., Vrijhoef, H. J., & Wouters, E. (2015) · Gerontology · doi:10.1159/000430949 · Cited by 19,852
Sensitivity and False Alarm Rate of a Fall Sensor in Long-Term Fall Detection in the Elderly
Kangas, M., Korpelainen, R., Vikman, I., Nyberg, L., & Jämsä, T. J. (2014) · Gerontology · doi:10.1159/000362720 · Cited by 19,007
Studies of interference in serial verbal reactions
Stroop, J. R. (1935) · Journal of Experimental Psychology · doi:10.1037/h0054651 · Cited by 18,622
Assessment of Older People: Self-Maintaining and Instrumental Activities of Daily Living
Lawton, M. P., & Brody, E. M. (1969) · The Gerontologist · doi:10.1093/geront/9.3_part_1.179 · Cited by 18,540
Tzourio-Mazoyer, N., Landeau, B., Papathanassiou, D., Crivello, F., Etard, O., Delcroix, N., Mazoyer, B., & Joliot, M. (2002) · NeuroImage · doi:10.1006/nimg.2001.0978 · Cited by 16,319
Research works printed but not linked: 1
- Q Guo, 2009, A comparison study of mild cognitive impairment with 3 memory tests among Chinese individuals, Alzheimer Dis Assoc Disord, 23, 253, 10.1097/WAD.0b013e3181999e92 · DOI
Cited by
Sorted by citations
Mendez, M. F. (2017) · Neurologic Clinics · doi:10.1016/j.ncl.2017.01.005 · Cited by 389
Structure–function coupling in macroscale human brain networks
Fotiadis, P., Parkes, L., Davis, K. A., Satterthwaite, T. D., Shinohara, R. T., & Bassett, D. S. (2024) · Nature reviews. Neuroscience · doi:10.1038/s41583-024-00846-6 · Cited by 280
Hohenfeld, C., Werner, C. J., & Reetz, K. (2018) · NeuroImage: Clinical · doi:10.1016/j.nicl.2018.03.013 · Cited by 232
Ye, M., Yang, T., Qing, P., Lei, X., Qiu, J., & Liu, G. (2015) · PLoS ONE · doi:10.1371/journal.pone.0133775 · Cited by 155
Li, F., Wang, J., Liao, Y., Yi, C., Jiang, Y., Si, Y., Peng, W., Yao, D., Zhang, Y., Dong, W., et al. (2019) · IEEE Transactions on Neural Systems and Rehabilitation Engineering · doi:10.1109/tnsre.2019.2900725 · Cited by 125
Metadata
- Authors
- Sun, Y., Yin, Q., Fang, R., Yan, X., Wang, Y., Bezerianos, A., Tang, H., Miao, F., & Sun, J.
- Affiliations
- National University of Singapore (SG)
- Shanghai Jiao Tong University (CN)
- Corresponding author
- Tang, Huidong
- Miao, Fei
- Sun, Junfeng
- ORCID
- Venue
- PLoS ONE
- Publisher
- Public Library of Science (PLoS)
- Published
- 2014-05-07
- Volume
- 9
- Issue
- 5
- Pages
- e96505
- ISSN
- 1932-6203 (ISSN-L)
- PMC
- PMC4013022
- OpenAlex
- W1998486151
- Cited by
- 122
- References
- 83
- Citations by year
- 2026: 4 · 2025: 11 · 2024: 11 · 2023: 6 · 2022: 8 · 2021: 9 · 2020: 12 · 2019: 10 · 2018: 14 · 2017: 11 · 2016: 11 · 2015: 12 · 2014: 3
- FWCI
- 6.88
- Type
- journal article
- Language
- en
- Open access
- gold
- doi.org
- Locations
- PLoS ONE (publishedVersion, cc-by)
- Europe PMC (PubMed Central) (publishedVersion, other-oa)
- PubMed Central (publishedVersion, cc-by)
- PubMed (publishedVersion)
- National University of Singapore (submittedVersion)
- RePEc: Research Papers in Economics (submittedVersion)
- DOAJ (DOAJ: Directory of Open Access Journals) (submittedVersion, cc-by-sa)
- Figshare (submittedVersion, cc-by)
- Funders
- Shanghai Jiao Tong University (YG2012MS09)
- National Key Research and Development Program of China (2011CB013304)
- Topics
- Life Sciences › Neuroscience › Cognitive Neuroscience › Functional Brain Connectivity Studies
- Health Sciences › Medicine › Psychiatry and Mental health › Dementia and Cognitive Impairment Research
- Health Sciences › Medicine › Radiology, Nuclear Medicine and Imaging › Advanced Neuroimaging Techniques and Applications
- Keywords
- Alzheimer's disease, amnestic mild cognitive impairment, functional connectivity, structural connectivity, small-world networks, brain network topology, modular organization, healthy aging, dementia continuum, diffusion tensor tractography
- MeSH terms
- Aged, Aged, 80 and over, Aging, Alzheimer Disease, Amnesia, Brain, Brain Mapping, Female, Humans, Magnetic Resonance Imaging, Male, Middle Aged, Nerve Net, Neuropsychological Tests, Disease Progression, Diffusion Tensor Imaging, Neuroimaging, Cognitive Dysfunction
About these checks
Registry, retraction, Cites and statistics results are computed, not judged, with one exception: a printed reference that no index lists is read once by a model before it counts as a citation error. Claims are extracted by a model and kept only when their quote appears verbatim in the text; each cited source is then checked, with a model’s help, for whether it says what the claim relies on. Those verdicts can be wrong — read the claim’s quote and the cited source before relying on one.
Statistics and arithmetic are recomputed, not judged.
Confidence bands are shown only for fields calibrated on our annotated test set. None is calibrated yet, so no band is shown.
What counts as a claim ›How we measure confidence ›How we check this ›
Are you an author, or do you see a problem with this page? Request a review
