

The DOI matches its Crossref record; 53 of the 53 references it cites were found in a registry or an index.
Upregulation of miR-21 in Cisplatin Resistant Ovarian Cancer via JNK-1/c-Jun Pathway
Open accessAbstract
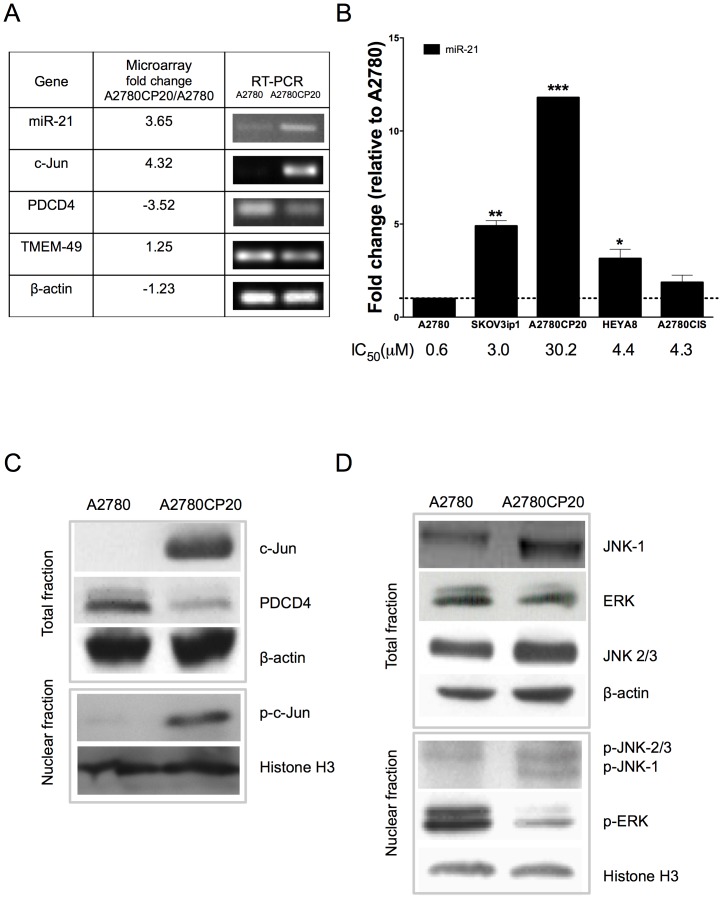
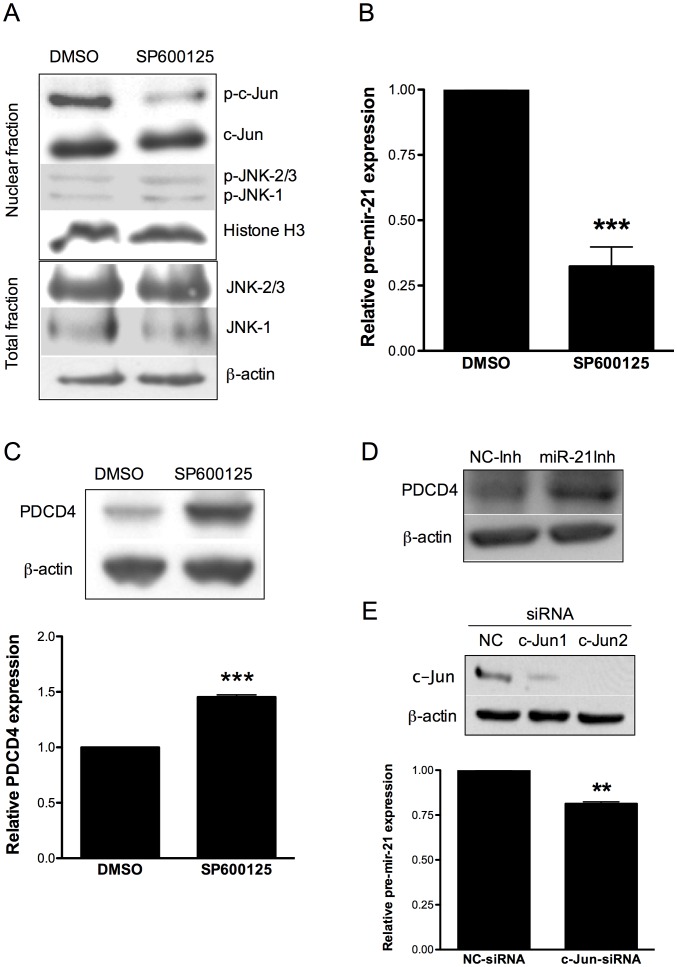
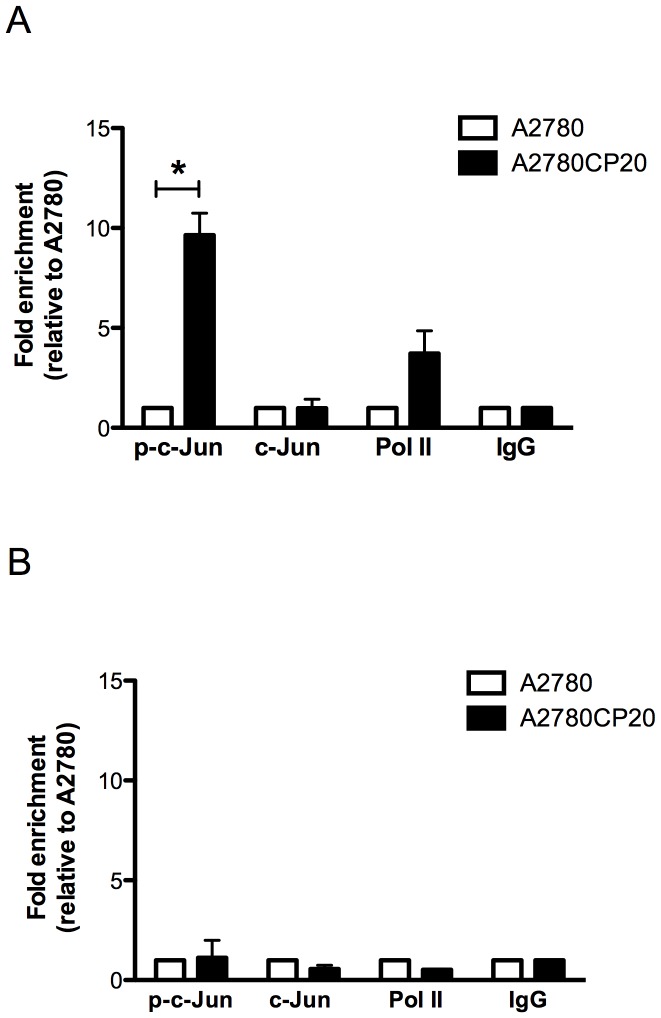
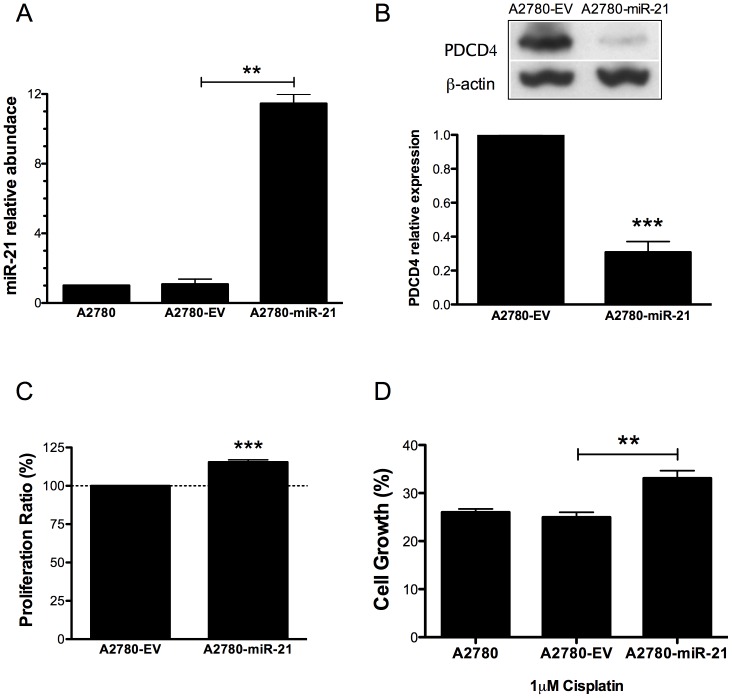
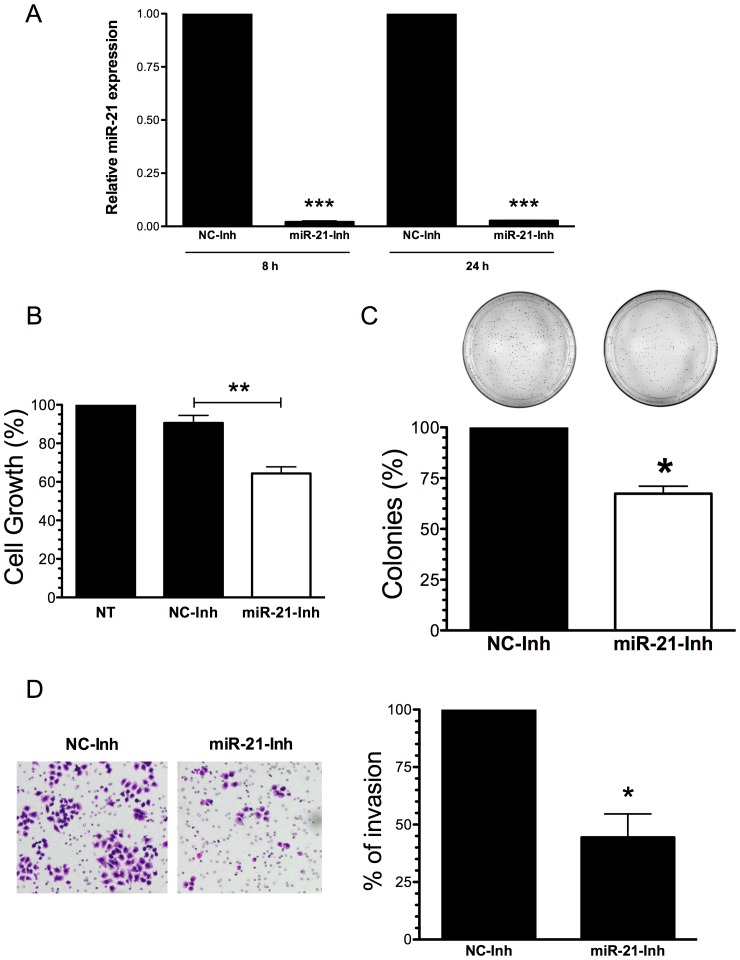
Cisplatin has been the most accepted drug for the treatment of ovarian cancer for almost 40 years. Although the majority of patients with ovarian cancer respond to front-line platinum combination chemotherapy, many patients will develop cisplatin-resistance disease, which is extremely rapid and fatal. Although various mechanisms of cisplatin resistance have been postulated, the key molecules involved in such resistance have not been identified. MiRNAs are endogenously expressed small non-coding RNAs, which are evolutionarily conserved and function as post-transcriptional regulators of gene expression. Dysregulation of miRNAs have been associated with cancer initiation, progression and drug resistance. The oncogenic miRNA-21, one of the best-studied miRNAs, is upregulated in almost all human cancers. However, the regulation of miR-21 in cisplatin resistant ovarian cancer cells has not been assessed. In this study, we measured the miR-21 expression by real-time PCR and found upregulation of miR-21 in cisplatin resistant compared with cisplatin sensitive ovarian cancer cells. Chromatin immunoprecipitation studies demonstrated the association of the c-Jun transcription factor to the pri-mir-21 DNA promoter regions. Blocking the JNK-1, the major activator of c-Jun phosphorylation, reduced the expression of pre-mir-21 and increased the expression of its well-known target gene, PDCD4. Overexpression of miR-21 in cisplatin sensitive cells decreased PDCD4 levels and increased cell proliferation. Finally, targeting miR-21 reduced cell growth, proliferation and invasion of cisplatin resistant ovarian cancer cells. These results suggest that the JNK-1/c-Jun/miR-21 pathway contributes to the cisplatin resistance of ovarian cancer cells and demonstrated that miR-21 is a plausible target to overcome cisplatin resistance.
Overview
The claims and statistics of this paper haven’t been checked yet.
Run the check — free, no account needed. It reads the open-access text and checks the sources it cites.
Integrity signals
Registry
Cites
Statistics
Figures
Verification
Claims the paper makes
The claims and statistics of this paper haven’t been checked yet.
Run the check — free, no account needed. It reads the open-access text and checks the sources it cites.
Claims other papers make about this one
Each is checked against this paper’s own text: does it say what the citing paper says it does?
The cited source says what the claim attributes to it.
In the citing paper
“miRNAs play a key role in the progression of malignant tumors, they are considered potential anti-tumor therapeutic targets24, 25.”
From miR-21-5p Inhibits the Proliferation, Migration, and Invasion of Glioma by Targeting S100A10 (2023) · cites this paper as [24]
Self-check
Percentages, sums and reported differences re-computed from the paper’s own numbers.
The self-check needs the paper’s full text.
Citations
Cites
1 retracted
RETRACTED: The Role of microRNAs in the Tumorigenesis of Ovarian Cancer
Leva, G. D., & Croce, C. M. (2013) · Frontiers in Oncology · doi:10.3389/fonc.2013.00153 · Cited by 90
RetractedBartel (2004) · doi:10.1016/s0092-8674(04)00045-5 · Cited by 34,714
Analyzing real-time PCR data by the comparative CT method
Schmittgen, T. D., & Livak, K. J. (2008) · Nature Protocols · doi:10.1038/nprot.2008.73 · Cited by 26,190
Siegel, R., Naishadham, D., & Jemal, A. (2013) · CA A Cancer Journal for Clinicians · doi:10.3322/caac.21166 · Cited by 11,825
Integrated genomic analyses of ovarian carcinoma
Perou, C. M. (2019) · Carolina Digital Repository (University of North Carolina at Chapel Hill) · doi:10.17615/hvp3-wg08 · Cited by 7,927
Rubin, M., & Stephen, C. D. (1993) · Cited by 3,149
Molecular mechanisms of cisplatin resistance
Galluzzi, L., Senovilla, L., Vitale, I., Michels, J., Martins, I., Kepp, O., Castedo, M., & Kroemer, G. (2012) · Oncogene · doi:10.1038/onc.2011.384 · Cited by 2,760
SP600125, an anthrapyrazolone inhibitor of Jun N-terminal kinase
Bennett, B. L., Sasaki, D. T., Murray, B. W., O'Leary, E. C., Sakata, S. T., Xu, W., Leisten, J. C., Motiwala, A., Pierce, S., Satoh, Y., et al. (2001) · Proceedings of the National Academy of Sciences · doi:10.1073/pnas.251194298 · Cited by 2,558
The Regulation of AP-1 Activity by Mitogen-activated Protein Kinases
Karin, M. (1995) · Journal of Biological Chemistry · doi:10.1074/jbc.270.28.16483 · Cited by 2,423
Si, M.-L., Zhu, S., Wu, H., Lu, Z., Wu, F., & Mo, Y.-Y. (2007) · Oncogene · doi:10.1038/sj.onc.1210083 · Cited by 1,600
Cited by
Sorted by citations
Emerging role of microRNA-21 in cancer
Feng, Y., & Tsao, C. (2016) · Biomedical Reports · doi:10.3892/br.2016.747 · Cited by 464
miRNAs: Potential as Biomarkers and Therapeutic Targets for Cancer
Chakrabortty, A., Patton, D. J., Smith, B. F., & Agarwal, P. (2023) · Genes · doi:10.3390/genes14071375 · Cited by 272
Linking the future of anticancer metal-complexes to the therapy of tumour metastases
Bergamo, A., & Sava, G. (2015) · Chemical Society Reviews · doi:10.1039/c5cs00134j · Cited by 225
Bioinformatic tools for microRNA dissection
Akhtar, M. M., Micolucci, L., Islam, M. S., Olivieri, F., & Procopio, A. D. (2015) · Nucleic Acids Research · doi:10.1093/nar/gkv1221 · Cited by 220
Hashemi, M., Mirdamadi, M. S. A., Talebi, Y., Khaniabad, N., Banaei, G., Daneii, P., Gholami, S., Ghorbani, A., Tavakolpournegari, A., Farsani, Z. M., et al. (2023) · Pharmacological Research · doi:10.1016/j.phrs.2022.106568 · Cited by 153
Metadata
- Authors
- Echevarría-Vargas, I. M., Valiyeva, F., & Vivas-Mejía, P. E.
- Affiliations
- University of Puerto Rico, Medical Sciences Campus (PR)
- University of Puerto Rico System (PR)
- Venue
- PLoS ONE
- Publisher
- Public Library of Science (PLoS)
- Published
- 2014-05-27
- Volume
- 9
- Issue
- 5
- Pages
- e97094
- ISSN
- 1932-6203 (ISSN-L)
- PMC
- PMC4035252
- OpenAlex
- W2077670883
- Cited by
- 118
- References
- 53
- Citations by year
- 2026: 4 · 2025: 4 · 2024: 6 · 2023: 13 · 2022: 14 · 2021: 13 · 2020: 12 · 2019: 10 · 2018: 8 · 2017: 8 · 2016: 8 · 2015: 16 · 2014: 2
- FWCI
- 3.63
- Type
- journal article
- Language
- en
- Update notices
- correction (2014-12-26)
- Open access
- gold
- doi.org
- Locations
- PLoS ONE (publishedVersion, cc-by)
- Europe PMC (PubMed Central) (publishedVersion, cc-by)
- PubMed Central (publishedVersion, cc-by)
- PubMed (publishedVersion)
- DOAJ (DOAJ: Directory of Open Access Journals) (submittedVersion, cc-by-sa)
- Figshare (submittedVersion, cc-by)
- Funders
- National Institutes of Health
- National Cancer Institute (K22CA166226)
- National Institute of General Medical Sciences (R25GM061838)
- National Institute on Minority Health and Health Disparities (U54MD008149)
- Topics
- Life Sciences › Biochemistry, Genetics and Molecular Biology › Cancer Research › MicroRNA in disease regulation
- Health Sciences › Medicine › Oncology › Ovarian cancer diagnosis and treatment
- Life Sciences › Biochemistry, Genetics and Molecular Biology › Cancer Research › Cancer-related molecular mechanisms research
- Keywords
- miR-21, cisplatin resistance, ovarian cancer, JNK1, c-Jun, JNK/c-Jun signaling pathway, PDCD4, microRNA regulation, cell proliferation, cell invasion, drug resistance
- MeSH terms
- Antineoplastic Agents, Cell Movement, Cisplatin, Female, Humans, Ovarian Neoplasms, Promoter Regions, Genetic, RNA, Messenger, Tumor Cells, Cultured, Blotting, Western, RNA-Binding Proteins, Apoptosis, Drug Resistance, Neoplasm, Reverse Transcriptase Polymerase Chain Reaction, Chromatin Immunoprecipitation, JNK Mitogen-Activated Protein Kinases, Mitogen-Activated Protein Kinase 8, Cell Proliferation, Apoptosis Regulatory Proteins, Real-Time Polymerase Chain Reaction
About these checks
Registry, retraction, Cites and statistics results are computed, not judged, with one exception: a printed reference that no index lists is read once by a model before it counts as a citation error. Claims are extracted by a model and kept only when their quote appears verbatim in the text; each cited source is then checked, with a model’s help, for whether it says what the claim relies on. Those verdicts can be wrong — read the claim’s quote and the cited source before relying on one.
Statistics and arithmetic are recomputed, not judged.
Confidence bands are shown only for fields calibrated on our annotated test set. None is calibrated yet, so no band is shown.
What counts as a claim ›How we measure confidence ›How we check this ›
Are you an author, or do you see a problem with this page? Request a review
