

The DOI matches its Crossref record; 25 of the 25 references it cites were found in a registry or an index.
ForceAtlas2, a Continuous Graph Layout Algorithm for Handy Network Visualization Designed for the Gephi Software
Open accessAbstract
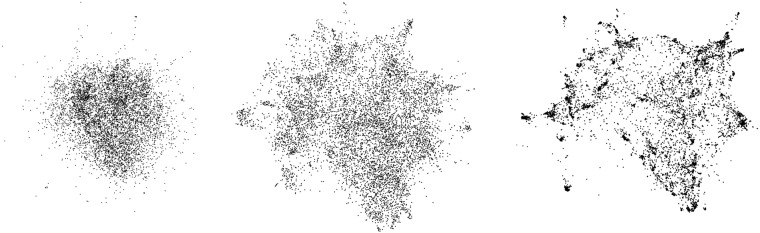
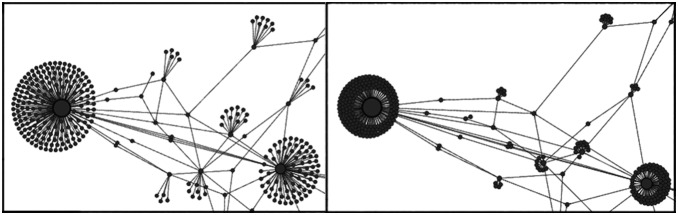
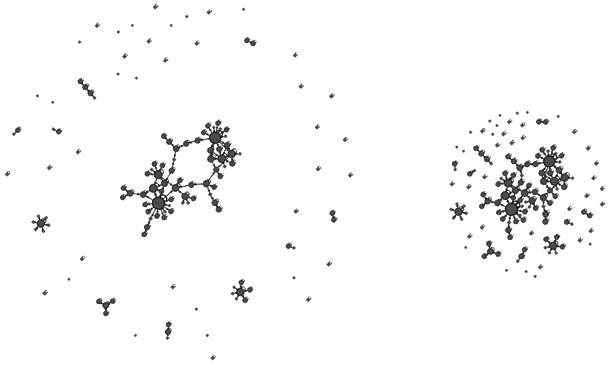
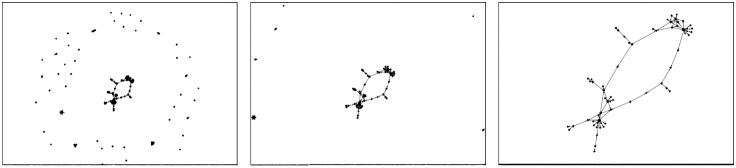
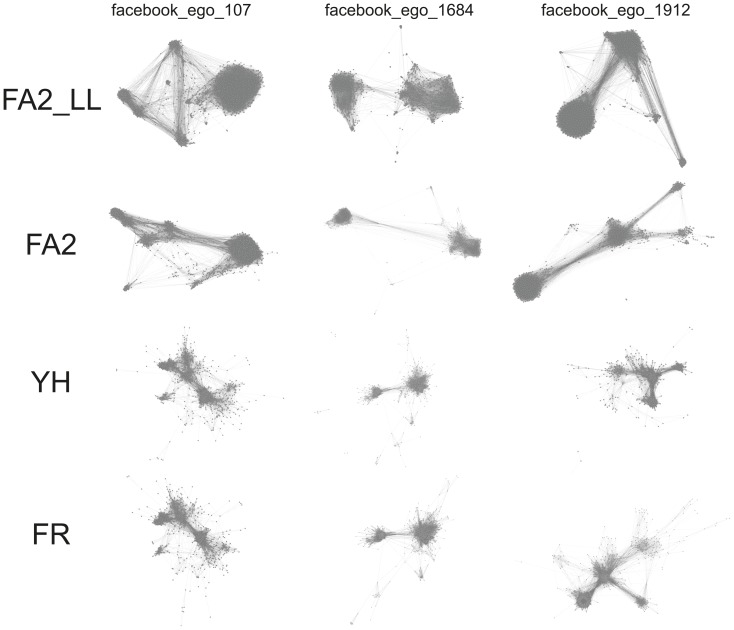
Gephi is a network visualization software used in various disciplines (social network analysis, biology, genomics...). One of its key features is the ability to display the spatialization process, aiming at transforming the network into a map, and ForceAtlas2 is its default layout algorithm. The latter is developed by the Gephi team as an all-around solution to Gephi users' typical networks (scale-free, 10 to 10,000 nodes). We present here for the first time its functioning and settings. ForceAtlas2 is a force-directed layout close to other algorithms used for network spatialization. We do not claim a theoretical advance but an attempt to integrate different techniques such as the Barnes Hut simulation, degree-dependent repulsive force, and local and global adaptive temperatures. It is designed for the Gephi user experience (it is a continuous algorithm), and we explain which constraints it implies. The algorithm benefits from much feedback and is developed in order to provide many possibilities through its settings. We lay out its complete functioning for the users who need a precise understanding of its behaviour, from the formulas to graphic illustration of the result. We propose a benchmark for our compromise between performance and quality. We also explain why we integrated its various features and discuss our design choices.
Overview
The claims and statistics of this paper haven’t been checked yet.
Free: it reads the open-access text and checks the first 5 claims that cite a source we can check. Create a free account to check every claim.
Integrity signals
Registry
Cites
Statistics
Figures
Verification
Claims the paper makes
The claims and statistics of this paper haven’t been checked yet.
Free: it reads the open-access text and checks the first 5 claims that cite a source we can check. Create a free account to check every claim.
Claims other papers make about this one
Each is checked against this paper’s own text: does it say what the citing paper says it does?
The source backs part of the claim, not all of it — or backs it for a different population, condition or comparison.
In the citing paper
“Force Atlas 2 results in a layout that gathers stone blocks, sharing similar pictorial programs of images.”
From Connecting the Sacred: Network Analysis of Buddhist Images on Early Medieval Chinese Pagodas from Nannieshui, Shanxi (2023) · cites this paper as Jacomy et al. 2014
Experimental — accuracy not yet measuredThe source backs part of the claim, not all of it — or backs it for a different population, condition or comparison.
In the citing paper
“Gephi processes large networks with complex datasets in real time and produces visual results that are valuable to explore and interpret networks.”
From Connecting the Sacred: Network Analysis of Buddhist Images on Early Medieval Chinese Pagodas from Nannieshui, Shanxi (2023) · cites this paper as Jacomy et al. 2014
Experimental — accuracy not yet measuredThe check wasn’t confident either way, so it gives no verdict — never disputed.
In the citing paper
“We find that our new random-walk-based measure outperforms existing ones in capturing the intuitive notion of controversy”
From Quantifying controversy on social media (2018) · cites this paper as [27]
Experimental — accuracy not yet measuredThe check wasn’t confident either way, so it gives no verdict — never disputed.
In the citing paper
“The work by Guerra et al. [27] presents clear arguments and examples of why modularity should be avoided.”
From Quantifying controversy on social media (2018) · cites this paper as [27]
Experimental — accuracy not yet measured
Self-check
Percentages, sums and reported differences re-computed from the paper’s own numbers.
The self-check needs the paper’s full text.
Citations
Cites
Modularity and community structure in networks
Newman, M. E. J. (2006) · Proceedings of the National Academy of Sciences · doi:10.1073/pnas.0601602103 · Cited by 12,256
Gephi: An Open Source Software for Exploring and Manipulating Networks
Bastian, M., Heymann, S., & Jacomy, M. (2009) · Proceedings of the International AAAI Conference on Web and Social Media · doi:10.1609/icwsm.v3i1.13937 · Cited by 11,675
Self-citationAuthoritative sources in a hyperlinked environment
Kleinberg, J. M. (1999) · Journal of the ACM · doi:10.1145/324133.324140 · Cited by 8,959
Graph drawing by force‐directed placement
Fruchterman, T. M. J., & Reingold, E. M. (1991) · Software: Practice and Experience · doi:10.1002/spe.4380211102 · Cited by 6,352
A hierarchical O(N log N) force-calculation algorithm
Barnes, J., & Hut, P. (1986) · Nature · doi:10.1038/324446a0 · Cited by 3,698
An algorithm for drawing general undirected graphs
Kamada, T., & Kawai, S. (1989) · Information Processing Letters · doi:10.1016/0020-0190(89)90102-6 · Cited by 2,698
Newman, M. E. J. (2004) · Physical Review E · doi:10.1103/physreve.70.056131 · Cited by 2,476
Authoritative sources in a hyperlinked environment
Kleinberg, J. M. (1998) · Symposium on Discrete Algorithms · doi:10.5555/314613.315045 · Cited by 1,814
Talking about tactile experiences
Obrist, M., Seah, S. A., & Subramanian, S. (2013) · Proceedings of the SIGCHI Conference on Human Factors in Computing Systems · doi:10.1145/2470654.2466220 · Cited by 1,613
Pajek - Program for Large Network Analysis
Batagelj, V., & Mrvar, A. (1999) · Cited by 1,455
Cited by
Wolf, F. A., Hamey, F. K., Plass, M., Solana, J., Dahlin, J. S., Göttgens, B., Rajewsky, N., Simon, L., & Theis, F. J. (2019) · Genome Biology · doi:10.1186/s13059-019-1663-x · Cited by 1,698
Single-cell transcriptional diversity is a hallmark of developmental potential
Gulati, G. S., Sikandar, S. S., Wesche, D. J., Manjunath, A., Bharadwaj, A., Berger, M. J., Ilagan, F., Kuo, A. H., Hsieh, R. W., Cai, S., et al. (2020) · Science · doi:10.1126/science.aax0249 · Cited by 1,571
A single-cell molecular map of mouse gastrulation and early organogenesis
Pijuan-Sala, B., Griffiths, J. A., Guibentif, C., Hiscock, T. W., Jawaid, W., Calero-Nieto, F. J., Mulas, C., Ibarra-Soria, X., Tyser, R. C. V., Ho, D. L. L., et al. (2019) · Nature · doi:10.1038/s41586-019-0933-9 · Cited by 1,033
Single-cell mapping of gene expression landscapes and lineage in the zebrafish embryo
Wagner, D. E., Weinreb, C., Collins, Z. M., Briggs, J. A., Megason, S. G., & Klein, A. M. (2018) · Science · doi:10.1126/science.aar4362 · Cited by 849
Interpretable machine learning: Fundamental principles and 10 grand challenges
Rudin, C., Chen, C., Chen, Z., Huang, H., Semenova, L., & Zhong, C. (2022) · Statistics Surveys · doi:10.1214/21-ss133 · Cited by 958
Metadata
- Authors
- Jacomy, M., Venturini, T., Heymann, S., & Bastian, M.
- Affiliations
- Institut d'Etudes Politiques de Paris (FR)
- Corresponding author
- Jacomy, Mathieu
- Venue
- PLoS ONE
- Publisher
- Public Library of Science (PLoS)
- Published
- 2014-06-10
- Volume
- 9
- Issue
- 6
- Pages
- e98679
- ISSN
- 1932-6203 (ISSN-L)
- PMC
- PMC4051631
- OpenAlex
- W2028695285
- Cited by
- 2,909
- References
- 25
- Citations by year
- 2026: 191 · 2025: 267 · 2024: 303 · 2023: 326 · 2022: 322 · 2021: 355 · 2020: 319 · 2019: 210 · 2018: 224 · 2017: 176 · 2016: 113 · 2015: 73 · 2014: 21
- FWCI
- 114.20
- Type
- journal article
- Language
- en
- Open access
- gold
- doi.org
- Locations
- PLoS ONE (publishedVersion, cc-by)
- PubMed Central (publishedVersion, cc-by)
- PubMed (publishedVersion)
- Archive ouverte UNIGE (University of Geneva) (publishedVersion, other-oa)
- HAL (submittedVersion, cc-by)
- HAL (submittedVersion)
- RePEc: Research Papers in Economics (submittedVersion)
- DOAJ (DOAJ: Directory of Open Access Journals) (submittedVersion, cc-by-sa)
- Research Portal (King's College London) (submittedVersion, cc-by)
- SPIRE (Sciences Po) (submittedVersion)
- Archive ouverte UNIGE (University of Geneva) (submittedVersion, other-oa)
- Topics
- Physical Sciences › Computer Science › Computer Graphics and Computer-Aided Design › Data Visualization and Analytics
- Physical Sciences › Physics and Astronomy › Statistical and Nonlinear Physics › Complex Network Analysis Techniques
- Physical Sciences › Computer Science › Computational Theory and Mathematics › Graph Theory and Algorithms
- Keywords
- force-directed layout, network visualization, Gephi, graph layout algorithms, spatialization, scale-free networks
- MeSH terms
- Algorithms, Computer Graphics, Software
About these checks
Registry, retraction, Cites and statistics results are computed, not judged, with one exception: a printed reference that no index lists is read once by a model before it counts as a citation error. Claims are extracted by a model and kept only when their quote appears verbatim in the text; each cited source is then checked, with a model’s help, for whether it says what the claim relies on. Those verdicts can be wrong — read the claim’s quote and the cited source before relying on one.
Statistics and arithmetic are recomputed, not judged.
Confidence bands are shown only for fields calibrated on our annotated test set. None is calibrated yet, so no band is shown.
What counts as a claim ›How we measure confidence ›How we check this ›
Are you an author, or do you see a problem with this page? Request a review
How to cite
Cite CoChat for the checks on this page, and the paper for its own findings.
- This page
- CoChat. (2026). Citation check: ForceAtlas2, a Continuous Graph Layout Algorithm for Handy Network Visualization Designed for the Gephi Software. https://app.cochat.ai/papers/10.1371/journal.pone.0098679
- The paper
- Jacomy, M., Venturini, T., Heymann, S., & Bastian, M. (2014). ForceAtlas2, a Continuous Graph Layout Algorithm for Handy Network Visualization Designed for the Gephi Software. PLoS ONE. https://doi.org/10.1371/journal.pone.0098679
Data sources
Bibliographic data: Semantic Scholar, OpenAlex, Crossref.
Contains information from the Semantic Scholar Academic Graph Datasets, made available under the ODC Attribution License (ODC-BY 1.0).
Semantic Scholar’s data is described in: Kinney, R., et al. (2023). The Semantic Scholar Open Data Platform. arXiv:2301.10140.
