

The DOI matches its Crossref record; 40 of the 40 references it cites were found in a registry or an index.
Wound Administration of M2-Polarized Macrophages Does Not Improve Murine Cutaneous Healing Responses
Open accessAbstract
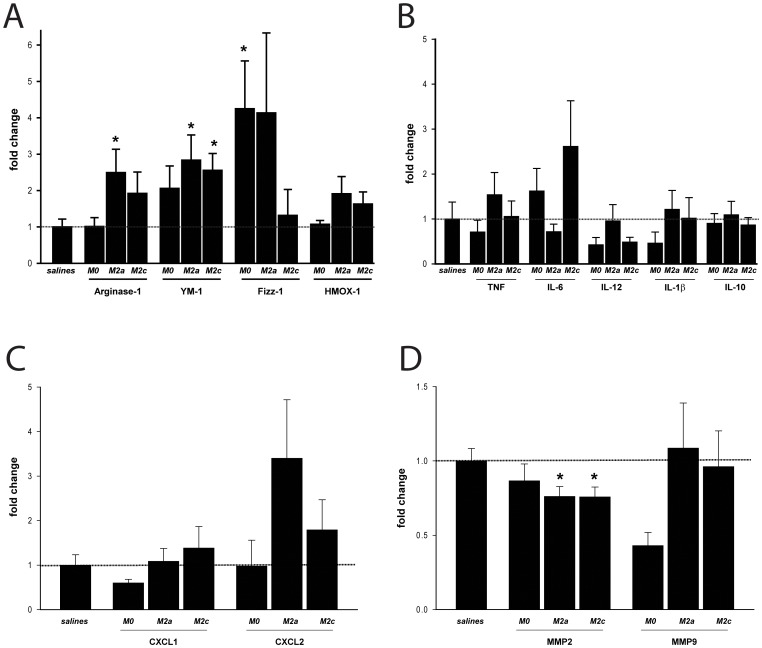
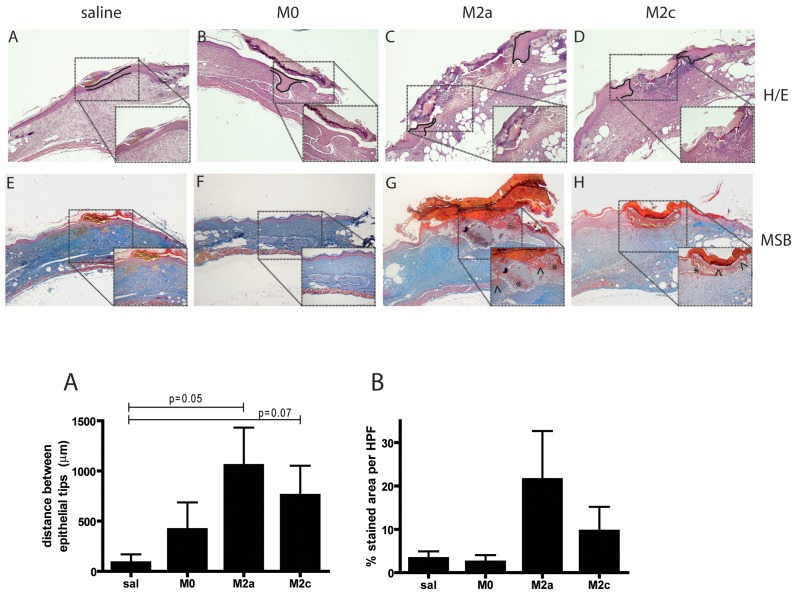
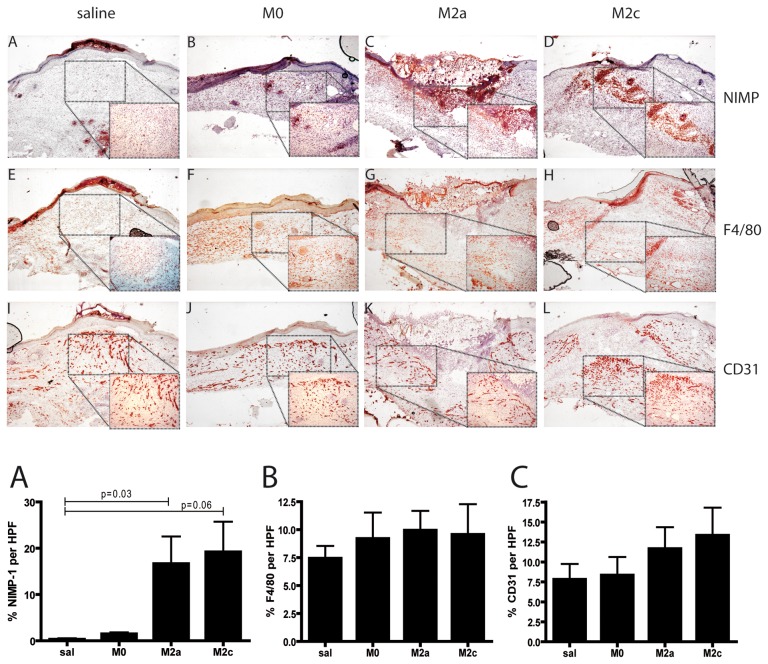
Macrophages play a crucial role in all stages of cutaneous wound healing responses and dysregulation of macrophage function can result in derailed wound repair. The phenotype of macrophages is influenced by the wound microenvironment and evolves during healing from a more pro-inflammatory (M1) profile in early stages, to a less inflammatory pro-healing (M2) phenotype in later stages of repair. The aim of the current study was to investigate the potential of exogenous administration of M2 macrophages to promote wound healing in an experimental mouse model of cutaneous injury. Bone marrow derived macrophages were stimulated in-vitro with IL-4 or IL-10 to obtain two different subsets of M2-polarized cells, M2a or M2c respectively. Polarized macrophages were injected into full-thickness excisional skin wounds of either C57BL/6 or diabetic db/db mice. Control groups were injected with non-polarized (M0) macrophages or saline. Our data indicate that despite M2 macrophages exhibit an anti-inflammatory phenotype in-vitro, they do not improve wound closure in wild type mice while they delay healing in diabetic mice. Examination of wounds on day 15 post-injury indicated delayed re-epithelialization and persistence of neutrophils in M2 macrophage treated diabetic wounds. Therefore, topical application of ex-vivo generated M2 macrophages is not beneficial and contraindicated for cell therapy of skin wounds.
Overview
The claims and statistics of this paper haven’t been checked yet.
Run the check — free, no account needed. It reads the open-access text and checks the sources it cites.
Integrity signals
Registry
Cites
Statistics
Figures
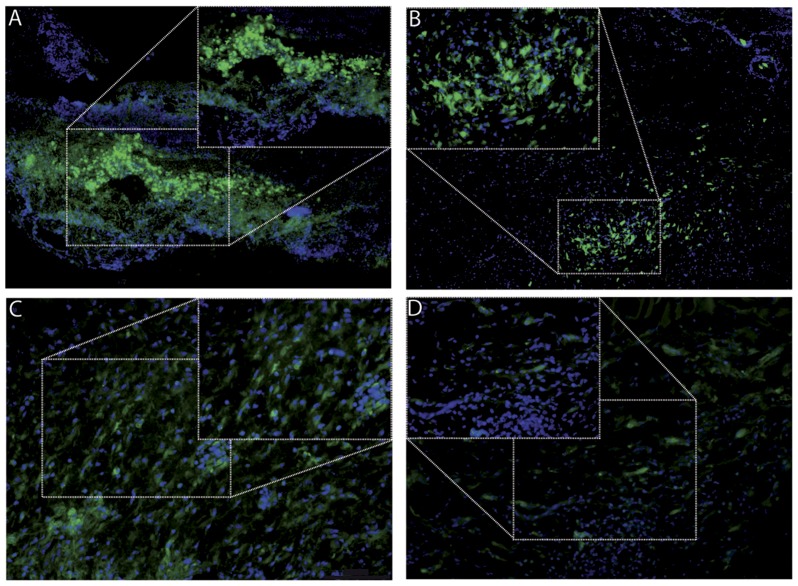
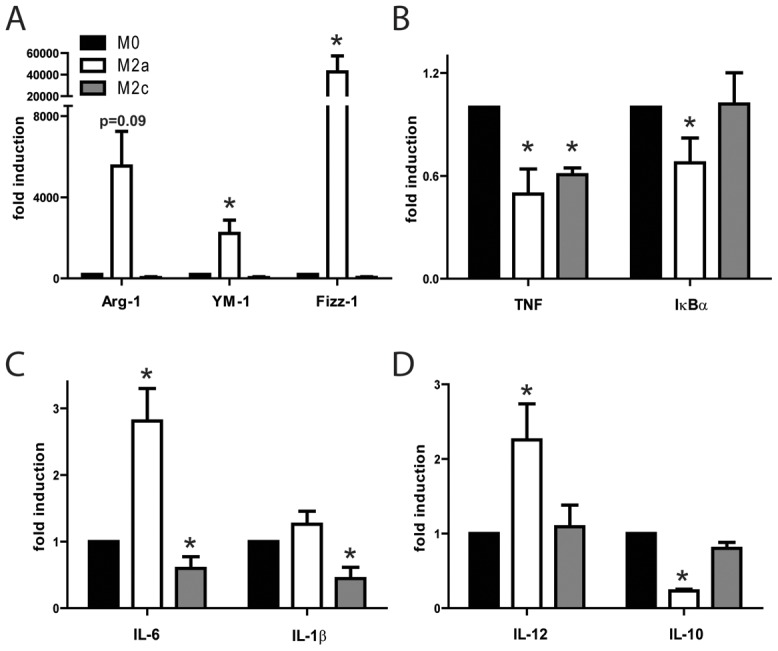
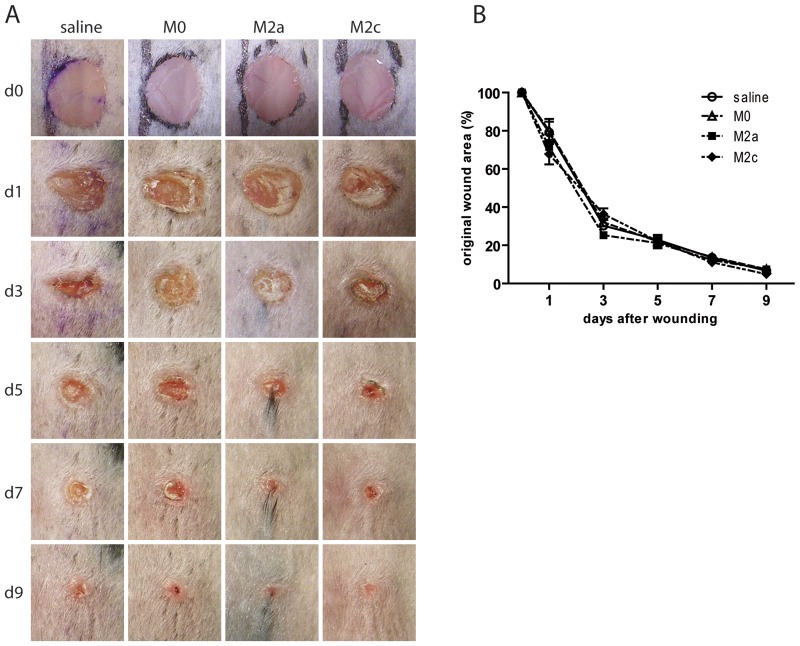
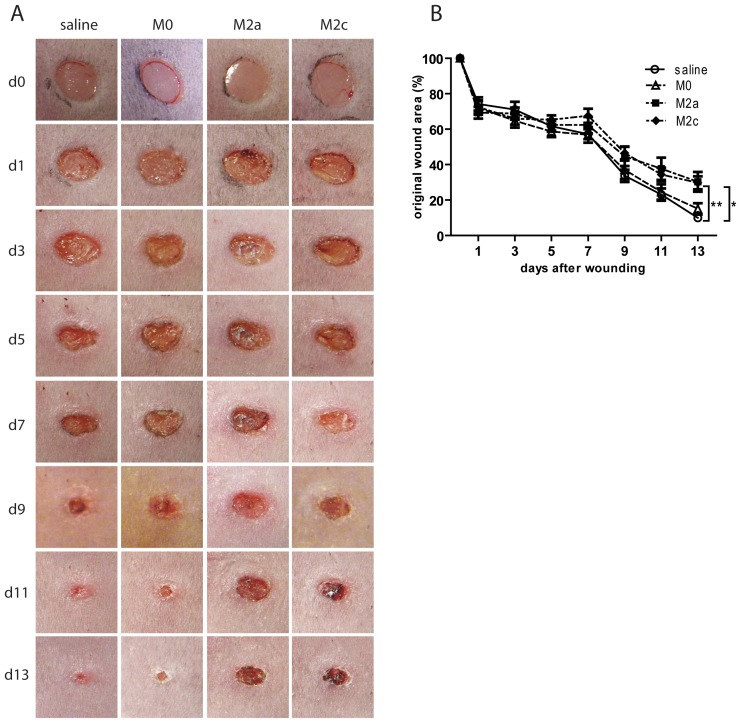
Verification
Claims the paper makes
The claims and statistics of this paper haven’t been checked yet.
Run the check — free, no account needed. It reads the open-access text and checks the sources it cites.
Claims other papers make about this one
Each is checked against this paper’s own text: does it say what the citing paper says it does?
The source backs part of the claim, not all of it — or backs it for a different population, condition or comparison.
In the citing paper
“Timing of release is crucial where, especially in older organisms, the balance between M1 and M2 polarization may be dysregulated and impairs wound healing.[ 223 ]”
From Unraveling and Harnessing the Immune Response at the Cell–Biomaterial Interface for Tissue Engineering Purposes (2024) · cites this paper as [223]
Experimental — accuracy not yet measuredIn the citing paper
“It is also consistent with the observation that the addition of macrophages induced with IL-4 or IL-10 delays wound healing in db/db mice.107”
From The Innate Immune System in Acute and Chronic Wounds (2016) · cites this paper as [107]
Self-check
Percentages, sums and reported differences re-computed from the paper’s own numbers.
The self-check needs the paper’s full text.
Citations
Cites
Exploring the full spectrum of macrophage activation
Mosser, D. M., & Edwards, J. P. (2008) · Nature Reviews Immunology · doi:10.1038/nri2448 · Cited by 9,144
Gurtner, G. C., Werner, S., Barrandon, Y., & Longaker, M. T. (2008) · Nature · doi:10.1038/nature07039 · Cited by 6,542
The chemokine system in diverse forms of macrophage activation and polarization
MANTOVANI, A., SICA, A., SOZZANI, S., ALLAVENA, P., VECCHI, A., & LOCATI, M. (2004) · Trends in Immunology · doi:10.1016/j.it.2004.09.015 · Cited by 6,534
Inflammation in Wound Repair: Molecular and Cellular Mechanisms
Eming, S. A., Krieg, T., & Davidson, J. M. (2007) · Journal of Investigative Dermatology · doi:10.1038/sj.jid.5700701 · Cited by 2,429
Identification of splenic reservoir monocytes and their deployment to inflammatory sites
Swirski, F. K., Nahrendorf, M., Etzrodt, M., Wildgruber, M., Cortez-Retamozo, V., Panizzi, P., Figueiredo, J.-L., Kohler, R. H., Chudnovskiy, A., Waterman, P., et al. (2009) · Science · doi:10.1126/science.1175202 · Cited by 2,221
Differential Roles of Macrophages in Diverse Phases of Skin Repair
Lucas, T., Waisman, A., Ranjan, R., Roes, J., Krieg, T., Müller, W., Roers, A., & Eming, S. A. (2010) · The Journal of Immunology · doi:10.4049/jimmunol.0903356 · Cited by 1,205 · cited 1×
“In line, ablation of macrophages during the early phases of repair [6] or loss of TNF [38], was shown to retard re-epithelialization and wound closure of murine cutaneous wounds.”
BackgroundSindrilaru, A., Peters, T., Wieschalka, S., Baican, C., Baican, A., Peter, H., Hainzl, A., Schatz, S., Qi, Y., Schlecht, A., et al. (2011) · Journal of Clinical Investigation · doi:10.1172/jci44490 · Cited by 1,100 · cited 2×
“It was shown that persistence of an unrestrained M1 macrophage population with incomplete switch to an antiinflammatory, pro-healing M2 phenotype is a common feature of non-healing wounds such as chronic venous leg ulcers [12] or diabetic wounds of humans and mice [13–15].”
BackgroundVerreck, F. A. W., de Boer, T., Langenberg, D. M. L., Hoeve, M. A., Kramer, M., Vaisberg, E., Kastelein, R., Kolk, A. H. J., Malefyt, R. D. W., & Ottenhoff, T. H. M. (2004) · Proceedings of the National Academy of Sciences · doi:10.1073/pnas.0400983101 · Cited by 969
Anti-inflammatory M2, but not pro-inflammatory M1 macrophages promote angiogenesis in vivo
Jetten, N., Verbruggen, S. E. L., Gijbels, M. J., Post, M. J., de Winther, M. P. J., & Donners, M. M. P. C. (2013) · Angiogenesis · doi:10.1007/s10456-013-9381-6 · Cited by 878
Self-citationMacrophage Dysfunction Impairs Resolution of Inflammation in the Wounds of Diabetic Mice
Khanna, S., Biswas, S., Shang, Y., Collard, E., Azad, A., Kauh, C., Bhasker, V., Gordillo, G. M., Sen, C. K., & Roy, S. (2010) · PLoS ONE · doi:10.1371/journal.pone.0009539 · Cited by 694
Research works printed but not linked: 1
- U Mirastschijski, 2002, Matrix metalloproteinase inhibitor BB-3103 unlike the serine proteinase inhibitor aprotinin abrogates epidermal healing of human skin wounds ex vivo, J Invest Dermatol, 118, 55
Cited by
Sorted by citations
Wound healing: cellular mechanisms and pathological outcomes
Wilkinson, H. N., & Hardman, M. J. (2020) · Open Biology · doi:10.1098/rsob.200223 · Cited by 1,975
Krzyszczyk, P., Schloss, R. S., Palmer, A. F., & Francois Berthiaume, B. (2018) · Frontiers in Physiology · doi:10.3389/fphys.2018.00419 · Cited by 1,606
Falanga, V., Isseroff, R. R., Soulika, A. M., Romanelli, M., Margolis, D. J., Kapp, S., Granick, M. S., & Harding, K. G. (2022) · Nature Reviews Disease Primers · doi:10.1038/s41572-022-00377-3 · Cited by 1,160
Macrophage Phenotypes Regulate Scar Formation and Chronic Wound Healing
Hesketh, M., Sahin, K. B., West, Z. E., & Murray, R. Z. (2017) · International Journal of Molecular Sciences · doi:10.3390/ijms18071545 · Cited by 852
Macrophages in bone fracture healing: Their essential role in endochondral ossification
Schlundt, C., Khassawna, T. E., Serra, A., Dienelt, A., Wendler, S., Schell, H., van Rooijen, N., Radbruch, A., Lucius, R., Hartmann, S., et al. (2015) · Bone · doi:10.1016/j.bone.2015.10.019 · Cited by 635
Metadata
- Authors
- Jetten, N., Roumans, N., Gijbels, M. J., Romano, A., Post, M. J., de Winther, M. P. J., van der Hulst, R. R. W. J., & Xanthoulea, S.
- Affiliations
- Maastricht University (NL)
- Maastricht University Medical Centre (NL)
- Corresponding author
- Xanthoulea, Sofia
- Venue
- PLoS ONE
- Publisher
- Public Library of Science (PLoS)
- Published
- 2014-07-28
- Volume
- 9
- Issue
- 7
- Pages
- e102994
- ISSN
- 1932-6203 (ISSN-L)
- PMC
- PMC4113363
- OpenAlex
- W2036736332
- Cited by
- 162
- References
- 40
- Citations by year
- 2026: 5 · 2025: 15 · 2024: 20 · 2023: 16 · 2022: 24 · 2021: 10 · 2020: 13 · 2019: 18 · 2018: 11 · 2017: 14 · 2016: 10 · 2015: 4 · 2014: 2
- FWCI
- 9.68
- Type
- journal article
- Language
- en
- Open access
- gold
- doi.org
- Locations
- PLoS ONE (publishedVersion, cc-by)
- Europe PMC (PubMed Central) (publishedVersion, cc-by)
- PubMed Central (publishedVersion, cc-by)
- PubMed (publishedVersion)
- Research Publications (Maastricht University) (publishedVersion, cc-by)
- Pure Amsterdam UMC (publishedVersion, other-oa)
- Data Archiving and Networked Services (DANS) (submittedVersion, other-oa)
- DOAJ (DOAJ: Directory of Open Access Journals) (submittedVersion, cc-by-sa)
- Figshare (submittedVersion, cc-by)
- Research Publications (Maastricht University) (submittedVersion, other-oa)
- Funders
- Universiteit Maastricht
- Maastricht Universitair Medisch Centrum
- Topics
- Health Sciences › Medicine › Surgery › Wound Healing and Treatments
- Life Sciences › Immunology and Microbiology › Immunology › Immune cells in cancer
- Life Sciences › Immunology and Microbiology › Immunology › Macrophage Migration Inhibitory Factor
- Keywords
- M2 macrophages, macrophage polarization, skin wound healing, diabetic wounds, IL-4, IL-10, re-epithelialization, neutrophils, db/db mice, full-thickness skin wounds
- MeSH terms
- Animals, Diabetes Mellitus, Experimental, Disease Models, Animal, Female, Immunohistochemistry, Macrophages, Skin, Wound Healing, Gene Expression, Genes, Reporter, Mice
About these checks
Registry, retraction, Cites and statistics results are computed, not judged, with one exception: a printed reference that no index lists is read once by a model before it counts as a citation error. Claims are extracted by a model and kept only when their quote appears verbatim in the text; each cited source is then checked, with a model’s help, for whether it says what the claim relies on. Those verdicts can be wrong — read the claim’s quote and the cited source before relying on one.
Statistics and arithmetic are recomputed, not judged.
Confidence bands are shown only for fields calibrated on our annotated test set. None is calibrated yet, so no band is shown.
What counts as a claim ›How we measure confidence ›How we check this ›
Are you an author, or do you see a problem with this page? Request a review
