

The DOI matches its Crossref record; 54 of the 54 references it cites were found in a registry or an index.
SOX9 Regulates Multiple Genes in Chondrocytes, Including Genes Encoding ECM Proteins, ECM Modification Enzymes, Receptors, and Transporters
Open accessAbstract
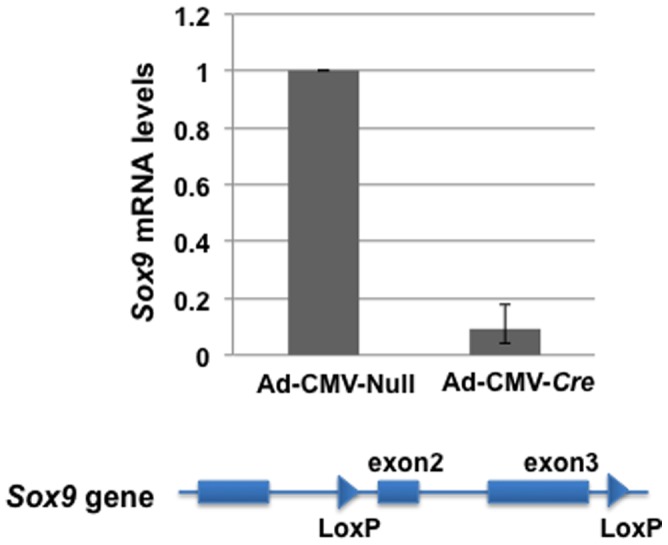
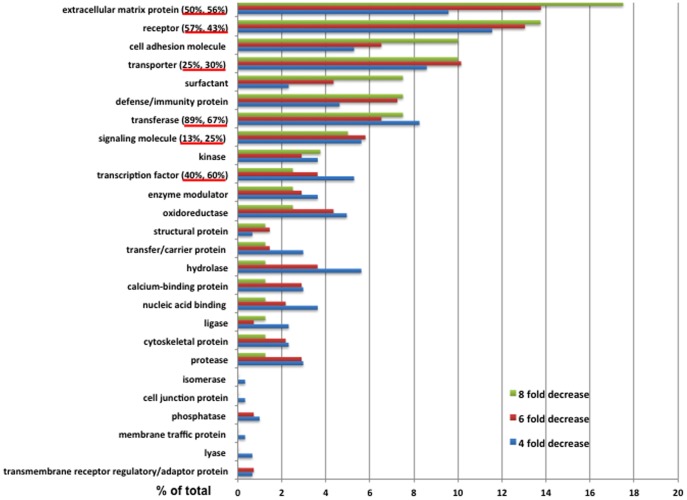
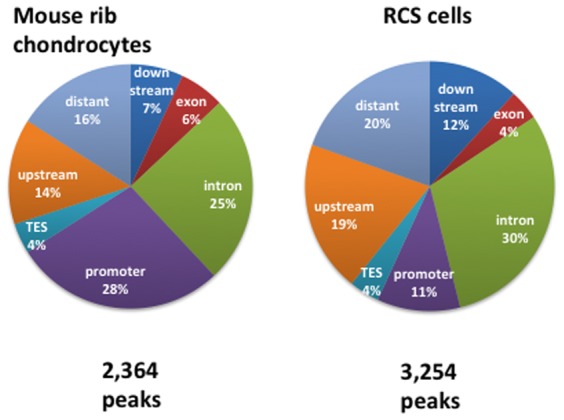
The transcription factor SOX9 plays an essential role in determining the fate of several cell types and is a master factor in regulation of chondrocyte development. Our aim was to determine which genes in the genome of chondrocytes are either directly or indirectly controlled by SOX9. We used RNA-Seq to identify genes whose expression levels were affected by SOX9 and used SOX9 ChIP-Seq to identify those genes that harbor SOX9-interaction sites. For RNA-Seq, the RNA expression profile of primary Sox9flox/flox mouse chondrocytes infected with Ad-CMV-Cre was compared with that of the same cells infected with a control adenovirus. Analysis of RNA-Seq data indicated that, when the levels of Sox9 mRNA were decreased more than 8-fold by infection with Ad-CMV-Cre, 196 genes showed a decrease in expression of at least 4-fold. These included many cartilage extracellular matrix (ECM) genes and a number of genes for ECM modification enzymes (transferases), membrane receptors, transporters, and others. In ChIP-Seq, 75% of the SOX9-interaction sites had a canonical inverted repeat motif within 100 bp of the top of the peak. SOX9-interaction sites were found in 55% of the genes whose expression was decreased more than 8-fold in SOX9-depleted cells and in somewhat fewer of the genes whose expression was reduced more than 4-fold, suggesting that these are direct targets of SOX9. The combination of RNA-Seq and ChIP-Seq has provided a fuller understanding of the SOX9-controlled genetic program of chondrocytes.
Overview
The claims and statistics of this paper haven’t been checked yet.
Run the check — free, no account needed. It reads the open-access text and checks the sources it cites.
Integrity signals
Registry
Cites
Statistics
Figures
Verification
Claims the paper makes
The claims and statistics of this paper haven’t been checked yet.
Run the check — free, no account needed. It reads the open-access text and checks the sources it cites.
Claims other papers make about this one
Each is checked against this paper’s own text: does it say what the citing paper says it does?
The cited source says what the claim attributes to it.
In the citing paper
“Among the upregulated genes were previously characterized SOX9 target genes, such as ECM genes encoding collagens IX and XI (53), as well as other TF genes like SOX5, SOX6, CREB3L2, and NFIA”
From SOX9 reprograms endothelial cells by altering the chromatin landscape (2022) · cites this paper as [53]
The cited source says what the claim attributes to it.
In the citing paper
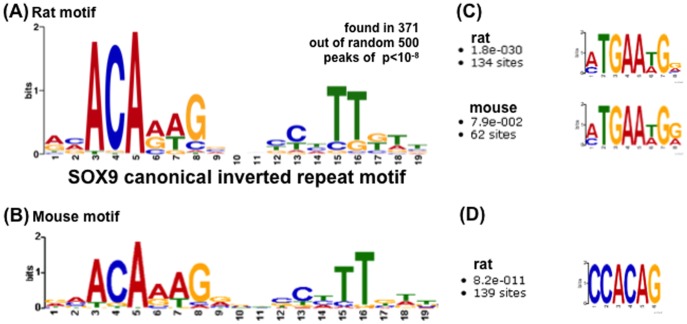
“which are similar to previously identified motifs for SOX9 (5,17,53,62).”
From SOX9 reprograms endothelial cells by altering the chromatin landscape (2022) · cites this paper as [53]
Self-check
Percentages, sums and reported differences re-computed from the paper’s own numbers.
The self-check needs the paper’s full text.
Citations
Cites
Comprehensive molecular characterization of human colon and rectal cancer
The Cancer Genome Atlas Network (2012) · Nature · doi:10.1038/nature11252 · Cited by 8,499
Mammalian microRNAs predominantly act to decrease target mRNA levels
Guo, H., Ingolia, N. T., Weissman, J. S., & Bartel, D. P. (2010) · Nature · doi:10.1038/nature09267 · Cited by 3,886
Akiyama, H., Chaboissier, M.-C., Martin, J. F., Schedl, A., & de Crombrugghe, B. (2002) · Genes & Development · doi:10.1101/gad.1017802 · Cited by 1,721 · cited 4×
“, floxed) [2] or wild-type mice and were cultured as described previously [54].”
BackgroundMethodInfluentialCampomelic dysplasia and autosomal sex reversal caused by mutations in an SRY-related gene
Foster, J. W., Dominguez-Steglich, M., Guioli, S., Kwok, C., Weller, P., Stevanović, M., Weissenbach, J., Mansour, S., Young, I., Goodfellow, P., et al. (1994) · Nature · doi:10.1038/372525a0 · Cited by 1,602 · cited 1×
“Heterozygous mutations in Sox9 cause campomelic dysplasia, a generalized and severe disease of cartilage characterized by hypoplasia of endochondral bone [3,4].”
BackgroundShiang, R., Thompson, L. M., Zhu, Y., Church, D. M., Fielder, T. J., Bocian, M. E., Winokur, S. T., & Wasmuth, J. J. (1994) · Cell · doi:10.1016/0092-8674(94)90302-6 · Cited by 1,329 · cited 1×
“Mutations in the transmembrane domain of FGFR3 cause the most common genetic form of dwarfism, achondroplasia [20], probably because FGFR3 controls the proliferation of chondrocytes and has been shown to stimulate SOX9 expression [10].”
BackgroundSOX9 Is a Potent Activator of the Chondrocyte-Specific Enhancer of the Proα1(II) Collagen Gene
Lefebvre, V., Huang, W., Harley, V. R., Goodfellow, P. N., & Crombrugghe, B. D. (1997) · Molecular and Cellular Biology · doi:10.1128/mcb.17.4.2336 · Cited by 1,077
Lefebvre, V., Li, P., & de Crombrugghe, B. (1998) · The EMBO Journal · doi:10.1093/emboj/17.19.5718 · Cited by 811 · cited 1×
“It is possible that SOX5 and SOX6 bind near SOX9-binding sites and regulate gene expression together with SOX9 [49].”
BackgroundA Stem Cell–Based Approach to Cartilage Repair
Johnson, K., Zhu, S., Tremblay, M. S., Payette, J. N., Wang, J., Bouchez, L. C., Meeusen, S., Althage, A., Cho, C. Y., Wu, X., et al. (2012) · Science · doi:10.1126/science.1215157 · Cited by 810
Interactions between Sox9 and β-catenin control chondrocyte differentiationPreprint
Akiyama, H., Lyons, J. P., Mori–Akiyama, Y., Yang, X., Zhang, R., Zhang, Z., Deng, J. M., Taketo, M. M., Nakamura, T., Behringer, R. R., et al. (2004) · Genes & Development · doi:10.1101/gad.1171104 · Cited by 755
Self-citationMaskless fabrication of light-directed oligonucleotide microarrays using a digital micromirror array
Singh‐Gasson, S., Green, R. D., Yue, Y., Nelson, C. J., Blattner, F. R., Sussman, M. R., & Cerrina, F. (1999) · Nature Biotechnology · doi:10.1038/13664 · Cited by 733 · cited 1×
“To identify all the direct targets of SOX9 in the genome of chondrocytes, we used chromatin immunoprecipitation sequencing (ChIP-Seq), a method for genome-wide profiling of DNA binding and chromatin proteins, which offers higher resolution and greater coverage than its array-based predecessor ChIP on chip array [16,17…”
MethodComputation for ChIP-seq and RNA-seq studies
Pepke, S., Wold, B. J., & Mortazavi, A. (2009) · Nature Methods · doi:10.1038/nmeth.1371 · Cited by 568 · cited 1×
“By using the genome-wide RNA-Seq method, the RNA profile of these cells was then compared to that of the same primary chondrocytes infected with a control adenovirus [15].”
MethodSOX9 is required for maintenance of the pancreatic progenitor cell pool
Seymour, P. A., Freude, K., Tran, M. N., Mayes, E., Jensen, J. N., Kist, R., Scherer, G., & Sander, M. (2007) · Proceedings of the National Academy of Sciences · doi:10.1073/pnas.0609217104 · Cited by 567 · cited 1×
“Recent reports have shown that SOX9 regulates programing of pancreatic and liver progenitors [40,41], and mutations in SOX9 have been identified in colorectal cancer cells [42].”
BackgroundPece-Barbara, N., Wrana, J. L., & Letarte, M. (1999) · Journal of Biological Chemistry · doi:10.1074/jbc.274.2.584 · Cited by 564 · cited 1×
“Bmp signaling is needed for formation of chondrogenic mesenchymal condensations and for expression or maintenance of Sox9 RNA at this step [9].”
BackgroundBi, W., Huang, W., Whitworth, D. J., Deng, J. M., Zhang, Z., Behringer, R. R., & Crombrugghe, B. D. (2001) · Proceedings of the National Academy of Sciences · doi:10.1073/pnas.111092198 · Cited by 541 · cited 1×
“Heterozygous mutations in Sox9 cause campomelic dysplasia, a generalized and severe disease of cartilage characterized by hypoplasia of endochondral bone [3,4].”
BackgroundSekiya, I., Tsuji, K., Koopman, P. A., Watanabe, H., Yamada, Y., Shinomiya, K., Nifuji, A., & Noda, M. (2000) · Journal of Biological Chemistry · doi:10.1074/jbc.275.15.10738 · Cited by 491
Kingsley, D. M., Bland, A. E., Grubber, J. M., Marker, P. C., Russell, L. B., Copeland, N. G., & Jenkins, N. A. (1992) · Cell · doi:10.1016/0092-8674(92)90510-j · Cited by 482
Targeted Mutagenesis of the Endogenous Mouse Mis Gene Promoter
Arango, N. A., Lovell-Badge, R. H., & Behringer, R. R. (1999) · Cell · doi:10.1016/s0092-8674(00)81527-5 · Cited by 449
Highly conserved non-coding elements on either side of SOX9 associated with Pierre Robin sequence
Benko, S., Fantes, J. A., Amiel, J., Kleinjan, D., Thomas, S., Ramsay, J. K., Jamshidi, N., Essafi, A., Heaney, S. J. H., Gordon, C. T., et al. (2009) · Nature Genetics · doi:10.1038/ng.329 · Cited by 447 · cited 1×
“A related disease called Pierre Robin sequence, which mainly affects the craniofacial skeleton, is associated with mutations in conserved DNA elements on either side of the Sox9 gene [5].”
BackgroundMurakami, S., Kan, M., McKeehan, W. L., & Crombrugghe, B. D. (2000) · Proceedings of the National Academy of Sciences · doi:10.1073/pnas.97.3.1113 · Cited by 377 · cited 1×
“Mutations in the transmembrane domain of FGFR3 cause the most common genetic form of dwarfism, achondroplasia [20], probably because FGFR3 controls the proliferation of chondrocytes and has been shown to stimulate SOX9 expression [10].”
BackgroundHan, Y., & Lefebvre, V. (2008) · Molecular and Cellular Biology · doi:10.1128/mcb.00695-08 · Cited by 302 · cited 2×
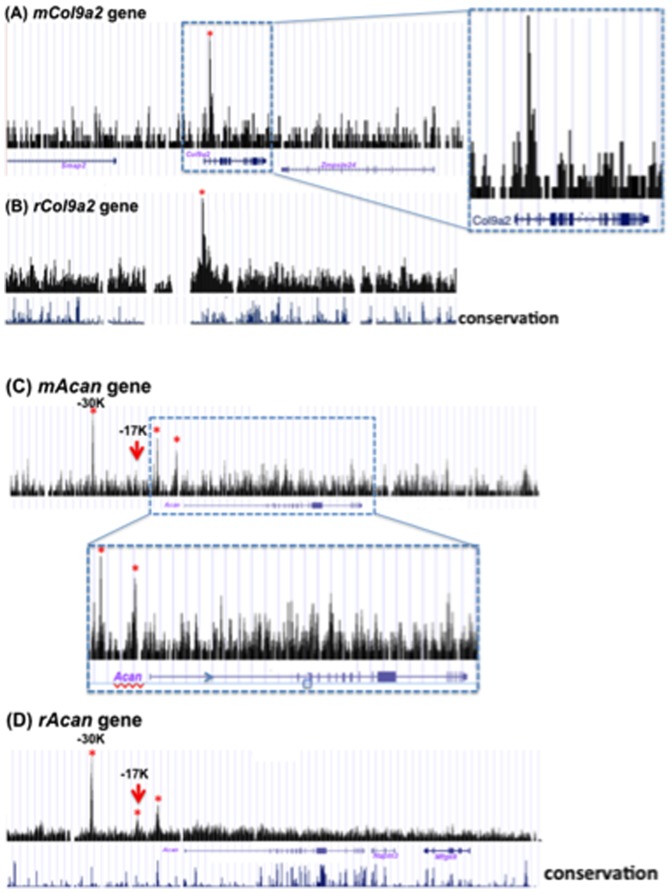
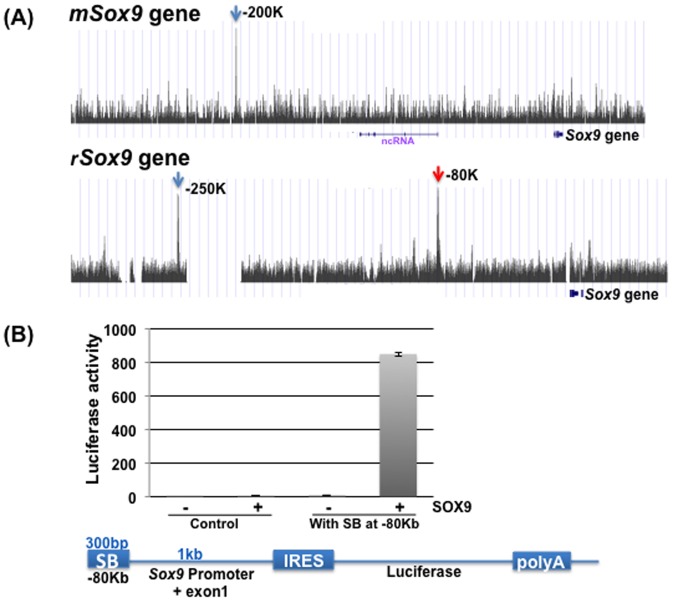
“The red arrows show the peaks that have been shown to have SOX9/SOX5/SOX6-dependent enhancer activity [33].”
BackgroundBridgewater, L. C., Lefebvre, V., & Crombrugghe, B. D. (1998) · Journal of Biological Chemistry · doi:10.1074/jbc.273.24.14998 · Cited by 287
Murakami, S., Lefebvre, V., & Crombrugghe, B. D. (2000) · Journal of Biological Chemistry · doi:10.1074/jbc.275.5.3687 · Cited by 273
Hoang, B. H., Moos, M. C., Vukičević, S., & Luyten, F. P. (1996) · Journal of Biological Chemistry · doi:10.1074/jbc.271.42.26131 · Cited by 248
Huang, W., Chung, U., Kronenberg, H. M., & Crombrugghe, B. D. (2000) · Proceedings of the National Academy of Sciences · doi:10.1073/pnas.98.1.160 · Cited by 243
Oncogenicity of the Developmental Transcription Factor Sox9
Matheu, A., Collado, M., Wise, C., Manterola, L., Cekaite, L., Tye, A. J., Cañamero, M., Bujanda, L., Schedl, A., Cheah, K. S. E., et al. (2012) · Cancer Research · doi:10.1158/0008-5472.can-11-3660 · Cited by 211 · cited 1×
“In cancer cells, SOX9 might regulate genes associated with tumorigenesis [43].”
BackgroundTsuda, M., Takahashi, S., Takahashi, Y. K., & Asahara, H. (2003) · Journal of Biological Chemistry · doi:10.1074/jbc.m303471200 · Cited by 211
Dimerization of SOX9 is required for chondrogenesis, but not for sex determination
Bernard, P. (2003) · Human Molecular Genetics · doi:10.1093/hmg/ddg182 · Cited by 167
Wwp2 is essential for palatogenesis mediated by the interaction between Sox9 and mediator subunit 25
Nakamura, Y., Yamamoto, K., He, X., Otsuki, B., Kim, Y., Murao, H., Soeda, T., Tsumaki, N., Deng, J. M., Zhang, Z., et al. (2011) · Nature Communications · doi:10.1038/ncomms1242 · Cited by 148
SOX9 is a key player in ultraviolet B-induced melanocyte differentiation and pigmentation
Passeron, T., Valencia, J. C., Bertolotto, C., Hoashi, T., Pape, E. L., Takahashi, K., Ballotti, R., & Hearing, V. J. (2007) · Proceedings of the National Academy of Sciences · doi:10.1073/pnas.0705117104 · Cited by 146
Mukhopadhyay, K., Lefebvre, V., Zhou, G. D., Garofalo, S., Kimura, J. H., & Crombrugghe, B. D. (1995) · Journal of Biological Chemistry · doi:10.1074/jbc.270.46.27711 · Cited by 146
Lefèbvre, V., Garofalo, S., Zhou, G. D., Metsäranta, M., VUORIO, E. I., & Crombrugghe, B. D. (1994) · Matrix Biology · doi:10.1016/0945-053x(94)90199-6 · Cited by 144
Sock, E. (2003) · Human Molecular Genetics · doi:10.1093/hmg/ddg158 · Cited by 142
Abnormal development of the apical ectodermal ridge and polysyndactyly in Megf7-deficient mice
Johnson, E. B., Hammer, R. E., & Herz, J. (2005) · Human Molecular Genetics · doi:10.1093/hmg/ddi381 · Cited by 141 · cited 1×
“The genes for Wnt antagonists FZD9 and FRZB [22–24] were downregulated more than 10-fold, whereas the gene for LRP4 [25], which acts as a negative regulator of Wnt signaling, was also downregulated.”
BackgroundTrans-activation of the Mouse Cartilage-Derived Retinoic Acid-Sensitive Protein Gene by Sox9
Xie, W., Zhang, X., Sakano, S., Lefèbvre, V., & Sandell, L. J. (1999) · Journal of Bone and Mineral Research · doi:10.1359/jbmr.1999.14.5.757 · Cited by 129
Sox9 and programming of liver and pancreatic progenitors
Kawaguchi, Y. (2013) · Journal of Clinical Investigation · doi:10.1172/jci66022 · Cited by 122 · cited 1×
“Recent reports have shown that SOX9 regulates programing of pancreatic and liver progenitors [40,41], and mutations in SOX9 have been identified in colorectal cancer cells [42].”
BackgroundAutomated parallel DNA sequencing on multiple channel microchips
Liu, S., Ren, H., Gao, Q., Roach, D. J., Loder, R. T., Armstrong, T. M., Mao, Q., Blaga, I., Barker, D. L. A., & Jovanovich, S. B. (2000) · Proceedings of the National Academy of Sciences · doi:10.1073/pnas.100113197 · Cited by 115 · cited 1×
“To identify all the direct targets of SOX9 in the genome of chondrocytes, we used chromatin immunoprecipitation sequencing (ChIP-Seq), a method for genome-wide profiling of DNA binding and chromatin proteins, which offers higher resolution and greater coverage than its array-based predecessor ChIP on chip array [16,17…”
MethodConditional inactivation of Sox9: A mouse model for campomelic dysplasia
Kist, R., Schrewe, H., Balling, R., & Scherer, G. (2002) · genesis · doi:10.1002/gene.10050 · Cited by 109 · cited 1×
“Several lines of evidence indicate that the transcription factor SOX9 acts as a master regulatory factor in this multistep pathway of chondrocyte differentiation [1,2].”
BackgroundDistribution of the collagen-binding integrin α10β1 during mouse development
Camper, L., Holmvall, K., Wängnerud, C., Aszódi, A., & Evy Lundgren-akerlund, B. (2001) · Cell and Tissue Research · doi:10.1007/s004410100385 · Cited by 108
Identification of SOX9 Interaction Sites in the Genome of Chondrocytes
Oh, C., Maity, S. N., Lu, J.-F., Zhang, J., Liang, S., Coustry, F., Crombrugghe, B. D., & Yasuda, H. (2010) · PLoS ONE · doi:10.1371/journal.pone.0010113 · Cited by 99 · cited 5×
“qPCR was performed using primers specific for each RNA, SYBR Master Mix, and an ABI 7900 real-time PCR system (Applied Biosystems, Foster City, CA), as described elsewhere [31].”
BackgroundMethodInfluentialSelf-citationLeijten, J., Bos, S. D., Landman, E. B. M., Georgi, N., Jahr, H., Meulenbelt, I., Post, J. N., van Blitterswijk, C., & Karperien, M. (2013) · Arthritis Research & Therapy · doi:10.1186/ar4306 · Cited by 91
Hattori, T., Coustry, F., Stephens, S., Eberspaecher, H., Takigawa, M., Yasuda, H., & Crombrugghe, B. D. (2008) · Nucleic Acids Research · doi:10.1093/nar/gkn150 · Cited by 90
Self-citationBridgewater, L. C. (2003) · Nucleic Acids Research · doi:10.1093/nar/gkg230 · Cited by 74
Takigawa, Y., Hata, K., Muramatsu, S., Amano, K., Ono, K., Wakabayashi, M., Matsuda, A., Takada, K., Nishimura, R., & Yoneda, T. (2010) · Journal of Cell Science · doi:10.1242/jcs.071373 · Cited by 68
Arid5a cooperates with Sox9 to stimulate chondrocyte-specific transcription
Amano, K., Hata, K., Muramatsu, S., Wakabayashi, M., Takigawa, Y., Ono, K., Nakanishi, M., Takashima, R., Kogo, M., Matsuda, A., et al. (2011) · Molecular Biology of the Cell · doi:10.1091/mbc.e10-07-0566 · Cited by 59
A Col9a1 enhancer element activated by two interdependent SOX9 dimers
Genzer, M. A., & Bridgewater, L. C. (2007) · Nucleic Acids Research · doi:10.1093/nar/gkm014 · Cited by 59
Reevaluation of a genetic model for the development of exostosis in hereditary multiple exostosis
Hall, C. R., Cole, W. G., Haynes, R., & Hecht, J. T. (2002) · American Journal of Medical Genetics · doi:10.1002/ajmg.10635 · Cited by 56 · cited 1×
“For instance, mutations in exostosin-like 1, an enzyme that modifies ECM proteins, are associated with skeletal malfunction [18].”
BackgroundCEACAM1, a SOX9 direct transcriptional target identified in the colon epithelium
Zalzali, H., Naudin, C., Bastide, P., Prévostel, C., Yaghi, C., Poulat, F., Jay, P., & Blache, P. (2008) · Oncogene · doi:10.1038/onc.2008.331 · Cited by 42
Wakahara, T., Kusu, N., Yamauchi, H., Kimura, I., Konishi, M., Miyake, A., & Itoh, N. (2006) · Developmental Biology · doi:10.1016/j.ydbio.2006.11.041 · Cited by 38 · cited 1×
“Among other genes that were markedly downregulated by SOX deletion is fibin, which has been shown recently to regulate fin development of the zebrafish skeleton [19].”
BackgroundHuang, B., Brugger, S. M., & Lyons, K. M. (2010) · Journal of Biological Chemistry · doi:10.1074/jbc.m110.108498 · Cited by 37
Coustry, F., Oh, C.-D., Hattori, T., Maity, S. N., de Crombrugghe, B., & Yasuda, H. (2010) · Nucleic Acids Research · doi:10.1093/nar/gkq417 · Cited by 37
Self-citationSOX9 directly regulates IGFBP-4 in the intestinal epithelium
Shi, Z., Chiang, C.-I., Mistretta, T., Major, A. M., & Mori–Akiyama, Y. (2013) · American Journal of Physiology-Gastrointestinal and Liver Physiology · doi:10.1152/ajpgi.00086.2013 · Cited by 35
Self-citationWroblewski, J., & Edwall-Arvidsson, C. (1992) · Cell Biology International Reports · doi:10.1016/s0309-1651(06)80107-4 · Cited by 31
Disruption of a Sox9–β-catenin circuit by mutant Fgfr3 in thanatophoric dysplasia type II
Shung, C.-Y., Ota, S., Zhou, Z.-Q., Keene, D. R., & Hurlin, P. J. (2012) · Human Molecular Genetics · doi:10.1093/hmg/dds305 · Cited by 27
Expression of frizzled genes in mouse costochondral chondrocytes
Xu, L. (2001) · Matrix Biology · doi:10.1016/s0945-053x(00)00138-4 · Cited by 12
Cited by
Sorted by citations
Fibroblast growth factor signaling in skeletal development and diseasePreprint
Ornitz, D. M., & Marie, P. J. (2015) · Genes & Development · doi:10.1101/gad.266551.115 · Cited by 419
“Fgfr3 expression in proliferating chondrocytes requires Sox9, and Sox9-binding sites are found in the Fgfr3 gene (Oh et al. 2014).”
BackgroundThe Role of Chondrocyte Hypertrophy and Senescence in Osteoarthritis Initiation and Progression
Rim, Y. A., Nam, Y., & Ju, J. H. (2020) · International Journal of Molecular Sciences · doi:10.3390/ijms21072358 · Cited by 386
“PTHrP increased GAG contents and expression of SOX9 and COL2A1 in pellets generated from bone marrow stromal cells and adipose-derived stromal cells, and downregulated the expression of COL10A1 and RUNX2 in a dose-dependent manner [100].”
BackgroundInfluentialSOX9 and the many facets of its regulation in the chondrocyte lineage
Lefebvre, V., & Dvir‐Ginzberg, M. (2016) · Connective Tissue Research · doi:10.1080/03008207.2016.1183667 · Cited by 349
“DNA-binding, reporter and other in vitro assays traditionally used to probe one gene at a time have recently been complemented with genome-wide high-throughput sequencing assays for immunoprecipitated chromatin (ChIP-seq) (3,4,14-16).”
Liu, C.-F., & Lefebvre, V. (2015) · Nucleic Acids Research · doi:10.1093/nar/gkv688 · Cited by 287
“identified a best motif for SOX9 in chondrocytes that matches the top-ranking motifs found in SOX9 peaks in our study (22).”
BackgroundResultCartilage Homeostasis and Osteoarthritis
Fujii, Y., Liu, L., Yagasaki, L., Inotsume, M., Chiba, T., & Asahara, H. (2022) · International Journal of Molecular Sciences · doi:10.3390/ijms23116316 · Cited by 206
“Their results show that Sox9 regulates a specific set of cartilage ECM genes, including Acan and Col2a1, and controls the differentiation of cartilage ECM cells [21,56].”
Metadata
- Authors
- Oh, C.-D., Lu, Y., Liang, S., Mori-Akiyama, Y., Chen, D., de Crombrugghe, B., & Yasuda, H.
- Affiliations
- The University of Texas MD Anderson Cancer Center (US)
- Rush University Medical Center (US)
- Corresponding author
- Yasuda, Hideyo
- Venue
- PLoS ONE
- Publisher
- Public Library of Science (PLoS)
- Published
- 2014-09-17
- Volume
- 9
- Issue
- 9
- Pages
- e107577
- ISSN
- 1932-6203 (ISSN-L)
- PMC
- PMC4168005
- OpenAlex
- W2040278668
- Cited by
- 101
- References
- 54
- Citations by year
- 2026: 2 · 2025: 6 · 2024: 7 · 2023: 4 · 2022: 9 · 2021: 9 · 2020: 17 · 2019: 10 · 2018: 6 · 2017: 6 · 2016: 11 · 2015: 14
- FWCI
- 8.59
- Type
- journal article
- Language
- en
- Update notices
- correction (2015-11-12)
- Open access
- gold
- doi.org
- Locations
- PLoS ONE (publishedVersion, cc-by)
- Europe PMC (PubMed Central) (publishedVersion, cc-by)
- PubMed Central (publishedVersion, cc-by)
- PubMed (publishedVersion)
- DOAJ (DOAJ: Directory of Open Access Journals) (submittedVersion, cc-by-sa)
- Figshare (submittedVersion, cc-by)
- Funders
- National Institutes of Health (CA-16 672)
- University of Texas MD Anderson Cancer Center (#CA16672)
- National Cancer Institute (CA-16672, P30CA016672)
- National Institute of Arthritis and Musculoskeletal and Skin Diseases (R01AR309854, R01AR054465)
- Topics
- Health Sciences › Medicine › Rheumatology › Osteoarthritis Treatment and Mechanisms
- Life Sciences › Biochemistry, Genetics and Molecular Biology › Molecular Biology › Genomics and Chromatin Dynamics
- Life Sciences › Biochemistry, Genetics and Molecular Biology › Cell Biology › Proteoglycans and glycosaminoglycans research
- Keywords
- SOX9, chondrocytes, transcriptional regulation, extracellular matrix genes, transcription factor binding sites, gene expression profiling, Cre-loxP conditional knockout, chondrogenesis, cell surface receptors, transporters
- MeSH terms
- Animals, Binding Sites, Gene Expression Regulation, Humans, Protein Binding, Gene Expression, Extracellular Matrix Proteins, Mice, Knockout, Chondrocytes, Gene Expression Profiling, Protein Transport, Chromatin Immunoprecipitation, Mice, SOX9 Transcription Factor, Position-Specific Scoring Matrices, High-Throughput Nucleotide Sequencing, Nucleotide Motifs
About these checks
Registry, retraction, Cites and statistics results are computed, not judged, with one exception: a printed reference that no index lists is read once by a model before it counts as a citation error. Claims are extracted by a model and kept only when their quote appears verbatim in the text; each cited source is then checked, with a model’s help, for whether it says what the claim relies on. Those verdicts can be wrong — read the claim’s quote and the cited source before relying on one.
Statistics and arithmetic are recomputed, not judged.
Confidence bands are shown only for fields calibrated on our annotated test set. None is calibrated yet, so no band is shown.
What counts as a claim ›How we measure confidence ›How we check this ›
Are you an author, or do you see a problem with this page? Request a review
