Cited by 11

The DOI matches its Crossref record; 5 of the 5 references it cites were found in a registry or an index.

ELMO1 Is Upregulated in AML CD34+ Stem/Progenitor Cells, Mediates Chemotaxis and Predicts Poor Prognosis in Normal Karyotype AML

Capala, Marta E., Vellenga, Edo, Schuringa, Jan Jacob·2014·PLoS ONE

Overview

The claims and statistics of this paper haven’t been checked yet.

Run the check — free, no account needed. It reads the open-access text and checks the sources it cites.

A few free checks a day · papers already verified open instantly · results are public

Integrity signals

Registry

Crossref · 10.1371/journal.pone.0111568

Cites

5 of 5 references verified0 citation errors · 0 not checkable

Statistics

Figures

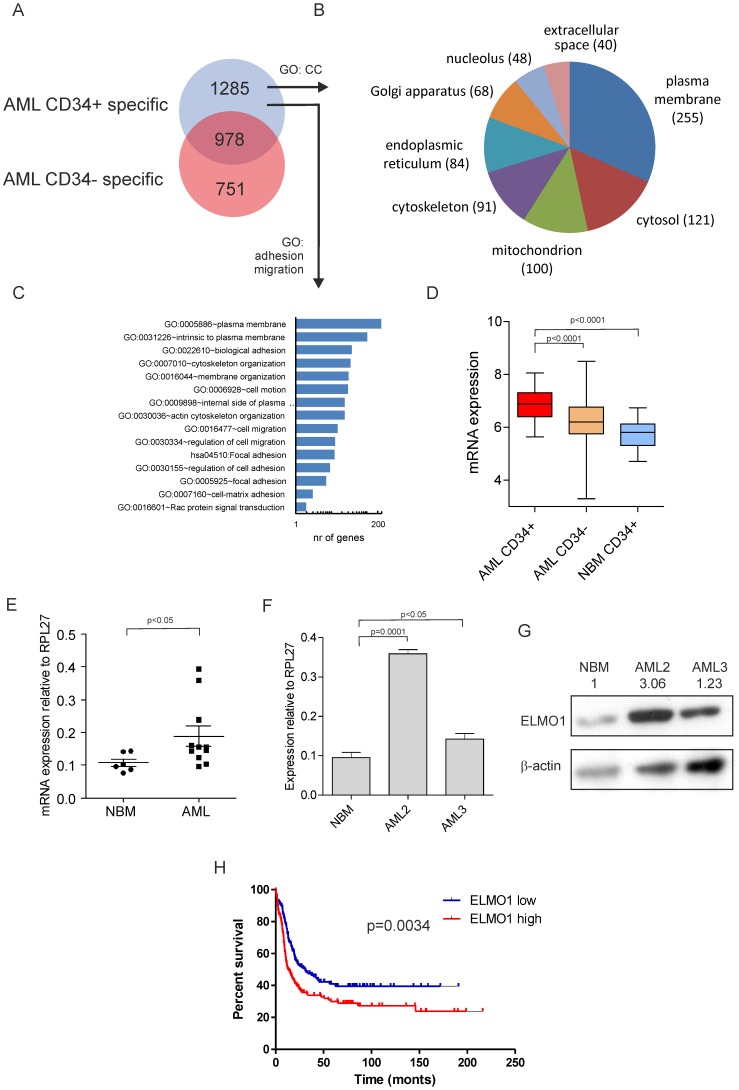
Figure 1 ELMO1 expression is increased in AML CD34+ cells and predicts poor prognosis in normal karyotype AML patients. (A) VENN diagram displaying the overlap in AML CD34+ specific and AML CD34− specific transcriptomes compared to NBM CD34+ cells [17], [18]. (B) 1677 AML CD34+-specific genes were subjected to Gene Ontology (GO) analysis for Cellular Component (CC) of which several CCs are shown. (C) 1677 AML CD34+-specific genes were subjected to GO analysis for terms associated with adhesion and migration. (D) ELMO1 mRNA was significantly higher expressed in AML CD34+ (n = 46) as compared to AML CD34− cells (p<0.0001), as well as to NBM CD34+ cells (n = 31) (p<0.0001). (E) Increased expression of ELMO1 was further confirmed by independent Q-PCRs in a panel of 11 AML and 6 NBM samples. (F, G) The increase in ELMO1 mRNA was paralleled by increased protein levels in two representative cases. (H) High expression of ELMO1 predicts poor survival in a cohort of NK AML patients (based on [6], [29]) (p = 0.0034).
Figure 1 ELMO1 expression is increased in AML CD34+ cells and predicts poor prognosis in normal karyotype AML patients. (A) VENN diagram displaying the overlap in AML CD34+ specific and AML CD34− specific transcriptomes compared to NBM CD34+ cells [17], [18]. (B) 1677 AML CD34+-specific genes were subjected to Gene Ontology (GO) analysis for Cellular Component (CC) of which several CCs are shown. (C) 1677 AML CD34+-specific genes were subjected to GO analysis for terms associated with adhesion and migration. (D) ELMO1 mRNA was significantly higher expressed in AML CD34+ (n = 46) as compared to AML CD34− cells (p<0.0001), as well as to NBM CD34+ cells (n = 31) (p<0.0001). (E) Increased expression of ELMO1 was further confirmed by independent Q-PCRs in a panel of 11 AML and 6 NBM samples. (F, G) The increase in ELMO1 mRNA was paralleled by increased protein levels in two representative cases. (H) High expression of ELMO1 predicts poor survival in a cohort of NK AML patients (based on [6], [29]) (p = 0.0034).CC BY · PubMed Central
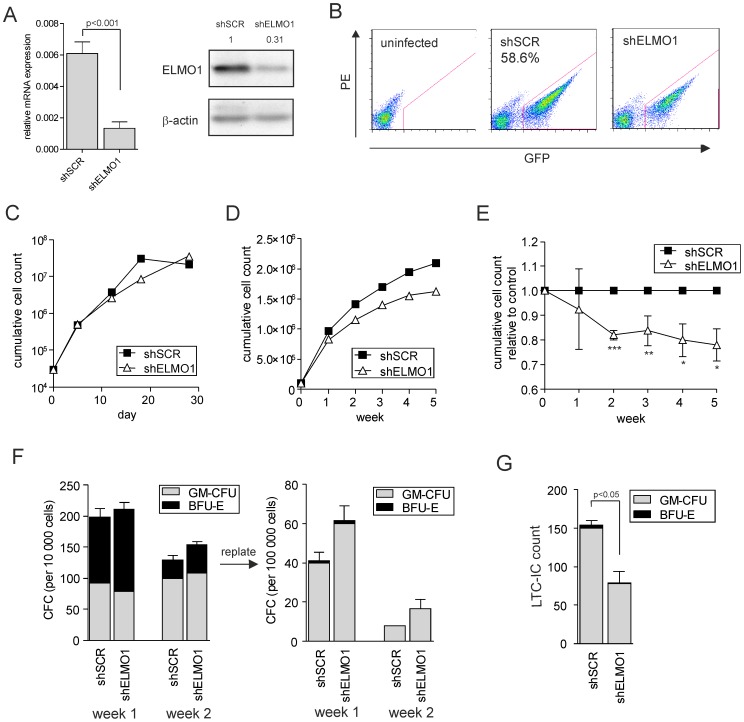
Figure 2 ELMO1 downmodulation in human CB CD34+ cells does not alter growth, colony formation or differentiation, but significantly decreases stem cell frequency. (A) K562 cells were transduced with control scrambled shRNA vector (shSCR) or with ELMO1-targeting shRNA vectors (shELMO1), sorted and used for RNA extraction. Quantitative PCR was performed to measure ELMO1 expression in transduced cells. ELMO1 mRNA levels were normalized against RPL27 mRNA expression. Alternatively, cells were used for Western blot analysis to determine ELMO1 protein levels. (B) FACS plots showing transduction efficiencies of cord blood (CB) CD34+ stem/progenitor cells transduced with shSCR or shELMO1. (C) 3×10⁵ transduced and sorted cells per group were plated in liquid culture and followed for thirty days. Cumulative cell count is showed representative of 3 independent experiments. (D) 105 transduced and sorted cells per group were plated on MS5 stromal cells and kept in the co-culture for 5 weeks; cultures were demi-depopulated weekly for analysis. Weekly cumulative cell growth is shown for a representative experiment of 3 independent experiments and the average of those 3 experiments is shown in (E). (F) Suspension cells from MS5 co-cultures as described in panel D were analyzed for progenitor frequency by CFC assay. 104 cells from each co-culture were plated in a CFC assay in methylcellulose in duplicate, and colonies were evaluated 2 weeks after plating. CFC cells were then harvested and 105 cells were re-plated to form secondary CFCs. CFU-GM and BFU-E numbers are shown from a representative of 3 independent experiments; error bars indicate standard deviation. (G) LTC-IC frequencies were determined in bulk on MS5 stromal cells. After 5 weeks of co-culture methylcellulose was added to and colonies were scored two weeks later. CFU -GM, colony-forming unit-granulocyte-macrophage; BFU-E, burst forming unit-erythroid. * P<0.05, ** P<0.01, *** P<0.001.
Figure 2 ELMO1 downmodulation in human CB CD34+ cells does not alter growth, colony formation or differentiation, but significantly decreases stem cell frequency. (A) K562 cells were transduced with control scrambled shRNA vector (shSCR) or with ELMO1-targeting shRNA vectors (shELMO1), sorted and used for RNA extraction. Quantitative PCR was performed to measure ELMO1 expression in transduced cells. ELMO1 mRNA levels were normalized against RPL27 mRNA expression. Alternatively, cells were used for Western blot analysis to determine ELMO1 protein levels. (B) FACS plots showing transduction efficiencies of cord blood (CB) CD34+ stem/progenitor cells transduced with shSCR or shELMO1. (C) 3×10⁵ transduced and sorted cells per group were plated in liquid culture and followed for thirty days. Cumulative cell count is showed representative of 3 independent experiments. (D) 105 transduced and sorted cells per group were plated on MS5 stromal cells and kept in the co-culture for 5 weeks; cultures were demi-depopulated weekly for analysis. Weekly cumulative cell growth is shown for a representative experiment of 3 independent experiments and the average of those 3 experiments is shown in (E). (F) Suspension cells from MS5 co-cultures as described in panel D were analyzed for progenitor frequency by CFC assay. 104 cells from each co-culture were plated in a CFC assay in methylcellulose in duplicate, and colonies were evaluated 2 weeks after plating. CFC cells were then harvested and 105 cells were re-plated to form secondary CFCs. CFU-GM and BFU-E numbers are shown from a representative of 3 independent experiments; error bars indicate standard deviation. (G) LTC-IC frequencies were determined in bulk on MS5 stromal cells. After 5 weeks of co-culture methylcellulose was added to and colonies were scored two weeks later. CFU -GM, colony-forming unit-granulocyte-macrophage; BFU-E, burst forming unit-erythroid. * P<0.05, ** P<0.01, *** P<0.001.CC BY · PubMed Central
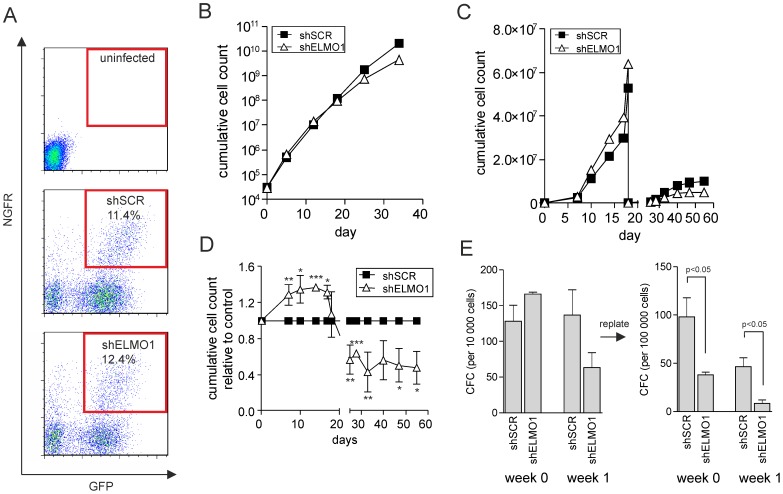
Figure 3 BCR-ABL-transformed human CB CD34+ show proliferative disadvantage and markedly reduced replating capacity upon ELMO1 depletion. (A) CB CD34+ stem/progenitor cells were double-transduced with BCR-ABL and either control scrambled shRNA vector (shSCR) or with ELMO1-targeting shRNA vector (shELMO1). FACS plots of transduction efficiency are shown. (B) 3×10⁵ double-transduced cells per group were plated in liquid culture and followed for 35 day. Cumulative cell count is shown representative of 3 independent experiments. (C) 5×10³ double-transduced cells were sorted per group and plated on MS5 stromal cells; cultures were demi-depopulated on indicated days for analysis and replated when stroma showed signs of detaching. Cumulative cell growth is shown for a representative experiment of 3 independent experiments and the average of those 3 experiments is shown in (D). (E) Suspension cells from MS5 co-cultures as described in panel B were analyzed for progenitor frequency by CFC assay. 103 freshly transduced cells or 104 cells from each co-culture were plated in a CFC assay in methylcellulose in duplicate, and colonies were evaluated 2 weeks after plating. CFC cells were harvested and 105 cells were replated to assess secondary CFC formation. Total CFC numbers are shown from a representative of 3 independent experiments; error bars indicate standard deviation. * P<0.05, ** P<0.01, *** P<0.001.
Figure 3 BCR-ABL-transformed human CB CD34+ show proliferative disadvantage and markedly reduced replating capacity upon ELMO1 depletion. (A) CB CD34+ stem/progenitor cells were double-transduced with BCR-ABL and either control scrambled shRNA vector (shSCR) or with ELMO1-targeting shRNA vector (shELMO1). FACS plots of transduction efficiency are shown. (B) 3×10⁵ double-transduced cells per group were plated in liquid culture and followed for 35 day. Cumulative cell count is shown representative of 3 independent experiments. (C) 5×10³ double-transduced cells were sorted per group and plated on MS5 stromal cells; cultures were demi-depopulated on indicated days for analysis and replated when stroma showed signs of detaching. Cumulative cell growth is shown for a representative experiment of 3 independent experiments and the average of those 3 experiments is shown in (D). (E) Suspension cells from MS5 co-cultures as described in panel B were analyzed for progenitor frequency by CFC assay. 103 freshly transduced cells or 104 cells from each co-culture were plated in a CFC assay in methylcellulose in duplicate, and colonies were evaluated 2 weeks after plating. CFC cells were harvested and 105 cells were replated to assess secondary CFC formation. Total CFC numbers are shown from a representative of 3 independent experiments; error bars indicate standard deviation. * P<0.05, ** P<0.01, *** P<0.001.CC BY · PubMed Central
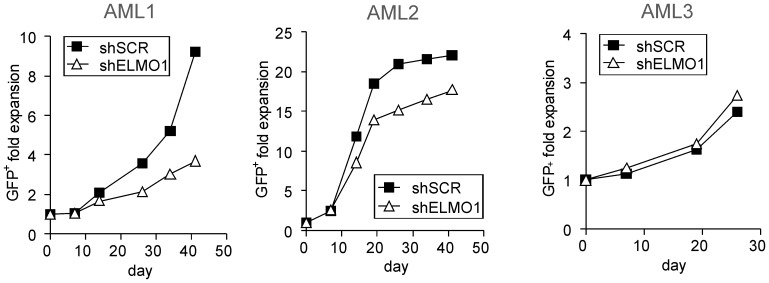
Figure 4 ELMO1 depletion in primary AML CD34+ cells impairs long-term expansion on stroma. AML CD34+ cells were transduced with control scrambled shRNA vector (shSCR) or with ELMO1-targeting shRNA vector (shELMO1). After washing away the virus all the cells were plated on MS5 stroma; cultures were demi-depopulated on indicated days for analysis. Cumulative cell growth is shown for each AML sample studied.
Figure 4 ELMO1 depletion in primary AML CD34+ cells impairs long-term expansion on stroma. AML CD34+ cells were transduced with control scrambled shRNA vector (shSCR) or with ELMO1-targeting shRNA vector (shELMO1). After washing away the virus all the cells were plated on MS5 stroma; cultures were demi-depopulated on indicated days for analysis. Cumulative cell growth is shown for each AML sample studied.CC BY · PubMed Central
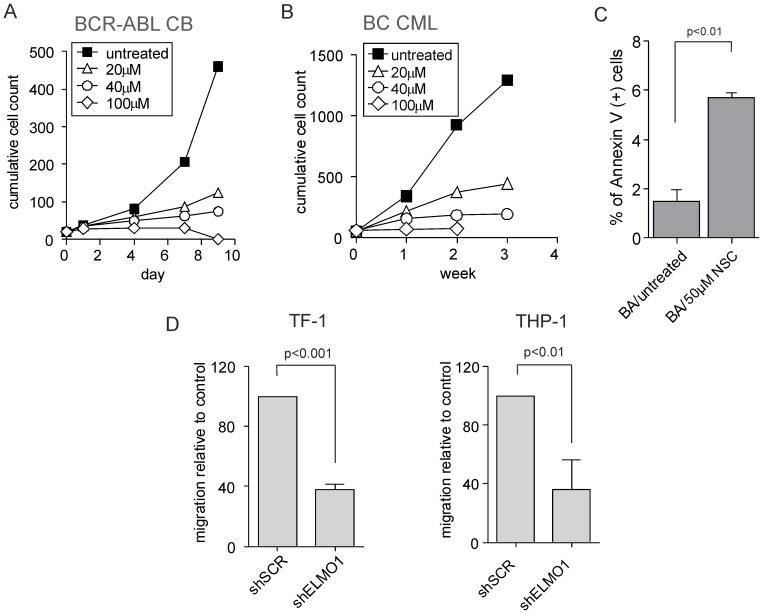
Figure 5 Global inhibition of RAC activity severely impairs proliferation and survival of leukemic cells while ELMO1 depletion strongly affects migration. (A) CB CD34+ cells were transduced with BCR-ABL-expressing vector, sorted and plated on MS5 stroma. Cells were allowed to proliferate for 5 days after which RAC inhibitor was added to the following concentrations: 20 µM, 40 µM or 100 µM. Co-cultures were demi-depopulated on indicated days for analysis. Cumulative cell count is shown representative of 3 independent experiments. (B) CD34+ cells were sorted from BC CML patient sample and plated on MS5 stroma. Cells were allowed to proliferate for 5 days after which RAC inhibitor was added to the following concentrations: 20 µM, 40 µM or 100 µM. Co-cultures were demi-depopulated on indicated days for analysis. Cumulative cell count is shown representative of 3 independent experiments. (C) BCR-ABL transduced cells as described in (A) were treated with 50 µM NSC for 3 days after which suspension cells were harvested and stained with Annexin V to assess apoptosis. (D) TF-1 and THP-1 cells were transduced with control scrambled shRNA vector (shSCR) or with ELMO1-targeting shRNA vector (shELMO1) and migration was evaluated in a transwell assay. The percentage of migrating cells relative to control is shown as an average of 3 independent experiments.
Figure 5 Global inhibition of RAC activity severely impairs proliferation and survival of leukemic cells while ELMO1 depletion strongly affects migration. (A) CB CD34+ cells were transduced with BCR-ABL-expressing vector, sorted and plated on MS5 stroma. Cells were allowed to proliferate for 5 days after which RAC inhibitor was added to the following concentrations: 20 µM, 40 µM or 100 µM. Co-cultures were demi-depopulated on indicated days for analysis. Cumulative cell count is shown representative of 3 independent experiments. (B) CD34+ cells were sorted from BC CML patient sample and plated on MS5 stroma. Cells were allowed to proliferate for 5 days after which RAC inhibitor was added to the following concentrations: 20 µM, 40 µM or 100 µM. Co-cultures were demi-depopulated on indicated days for analysis. Cumulative cell count is shown representative of 3 independent experiments. (C) BCR-ABL transduced cells as described in (A) were treated with 50 µM NSC for 3 days after which suspension cells were harvested and stained with Annexin V to assess apoptosis. (D) TF-1 and THP-1 cells were transduced with control scrambled shRNA vector (shSCR) or with ELMO1-targeting shRNA vector (shELMO1) and migration was evaluated in a transwell assay. The percentage of migrating cells relative to control is shown as an average of 3 independent experiments.CC BY · PubMed Central

Verification

Claims the paper makes

The claims and statistics of this paper haven’t been checked yet.

Run the check — free, no account needed. It reads the open-access text and checks the sources it cites.

A few free checks a day · papers already verified open instantly · results are public

Claims other papers make about this one

Each is checked against this paper’s own text: does it say what the citing paper says it does?

Self-check

Percentages, sums and reported differences re-computed from the paper’s own numbers.

The self-check needs the paper’s full text.

Citations

Cites

Show all 5 references

Research works printed but not linked: 36

  1. JC Byrd, 2002, Pretreatment cytogenetic abnormalities are predictive of induction success, cumulative incidence of relapse, and overall survival in adult patients with de novo acute myeloid leukemia: results from Cancer and Leukemia Group B (CALGB 8461), Blood, 100, 4325, 10.1182/blood-2002-03-0772 · DOI
  2. JW Vardiman, 2009, The 2008 revision of the World Health Organization (WHO) classification of myeloid neoplasms and acute leukemia: rationale and important changes, Blood, 114, 937, 10.1182/blood-2009-03-209262 · DOI
  3. M Alcalay, 2005, Acute myeloid leukemia bearing cytoplasmic nucleophosmin (NPMc+ AML) shows a distinct gene expression profile characterized by up-regulation of genes involved in stem-cell maintenance, Blood, 106, 899, 10.1182/blood-2005-02-0560 · DOI
  4. L Bullinger, 2004, Use of gene-expression profiling to identify prognostic subclasses in adult acute myeloid leukemia, N Engl J Med, 350, 1605, 10.1056/NEJMoa031046 · DOI
  5. MD Radmacher, 2006, Independent confirmation of a prognostic gene-expression signature in adult acute myeloid leukemia with a normal karyotype: a Cancer and Leukemia Group B study, Blood, 108, 1677, 10.1182/blood-2006-02-005538 · DOI
  6. BJ Wouters, 2009, A decade of genome-wide gene expression profiling in acute myeloid leukemia: flashback and prospects, Blood, 113, 291, 10.1182/blood-2008-04-153239 · DOI
  7. BJ Wouters, 2009, Double CEBPA mutations, but not single CEBPA mutations, define a subgroup of acute myeloid leukemia with a distinctive gene expression profile that is uniquely associated with a favorable outcome, Blood, 113, 3088, 10.1182/blood-2008-09-179895 · DOI
  8. D Bonnet, 1997, Human acute myeloid leukemia is organized as a hierarchy that originates from a primitive hematopoietic cell, Nat Med, 3, 730, 10.1038/nm0797-730 · DOI · Paper page
  9. T Lapidot, 2002, The essential roles of the chemokine SDF-1 and its receptor CXCR4 in human stem cell homing and repopulation of transplanted immune-deficient NOD/SCID and NOD/SCID/B2m(null) mice, Leukemia, 16, 1992, 10.1038/sj.leu.2402684 · DOI
  10. JJ Schuringa, 2009, Ex vivo assays to study self-renewal and long-term expansion of genetically modified primary human acute myeloid leukemia stem cells, Methods Mol Biol, 538, 287, 10.1007/978-1-59745-418-6_14 · DOI
  11. D van Gosliga, 2007, Establishing long-term cultures with self-renewing acute myeloid leukemia stem/progenitor cells, Exp Hematol, 35, 1538, 10.1016/j.exphem.2007.07.001 · DOI
  12. JK Warner, 2005, Direct evidence for cooperating genetic events in the leukemic transformation of normal human hematopoietic cells, Leukemia, 19, 1794, 10.1038/sj.leu.2403917 · DOI
  13. CT Jordan, 2000, The interleukin-3 receptor alpha chain is a unique marker for human acute myelogenous leukemia stem cells, Leukemia, 14, 1777, 10.1038/sj.leu.2401903 · DOI
  14. SW Lane, 2009, The leukemic stem cell niche: current concepts and therapeutic opportunities, Blood, 114, 1150, 10.1182/blood-2009-01-202606 · DOI
  15. T Lapidot, 1994, A cell initiating human acute myeloid leukaemia after transplantation into SCID mice, Nature, 367, 645, 10.1038/367645a0 · DOI · Paper page
  16. F Bonardi, 2013, A Proteomics and Transcriptomics Approach to Identify Leukemic Stem Cell (LSC) Markers, Mol Cell Proteomics, 12, 626, 10.1074/mcp.M112.021931 · DOI
  17. HJ de Jonge, 2011, Gene expression profiling in the leukemic stem cell-enriched CD34(+) fraction identifies target genes that predict prognosis in normal karyotype AML, Leukemia, 25, 1825, 10.1038/leu.2011.172 · DOI
  18. TL Gumienny, 2001, CED-12/ELMO, a Novel Member of the CrkII/Dock180/Rac Pathway, Is Required for Phagocytosis and Cell Migration, Cell, 107, 27, 10.1016/S0092-8674(01)00520-7 · DOI · Paper page
  19. M Lu, 2005, A Steric-Inhibition Model for Regulation of Nucleotide Exchange via the Dock180 Family of GEFs, Current Biology, 15, 371, 10.1016/j.cub.2005.01.050 · DOI · Paper page
  20. M Lu, 2006, Dock180-ELMO Cooperation in Rac Activation, Volume, 406, 388
  21. M Rozenveld-Geugien, 2007, Expansion of normal and leukemic human hematopoietic stem/progenitor cells requires rac-mediated interaction with stromal cells, Exp Hematol, 35, 782, 10.1016/j.exphem.2007.02.006 · DOI · Paper page
  22. H Schepers, 2007, STAT5 is required for long-term maintenance of normal and leukemic human stem/progenitor cells, Blood, 110, 2880, 10.1182/blood-2006-08-039073 · DOI
  23. A Rizo, 2010, BMI1 collaborates with BCR-ABL in leukemic transformation of human CD34+ cells, Blood, 116, 4621, 10.1182/blood-2010-02-270660 · DOI
  24. MJ Jarzynka, 2007, ELMO1 and Dock180, a Bipartite Rac1 Guanine Nucleotide Exchange Factor, Promote Human Glioma Cell Invasion, Cancer Research, 67, 7203, 10.1158/0008-5472.CAN-07-0473 · DOI
  25. A Shimazaki, 2006, ELMO1 increases expression of extracellular matrix proteins and inhibits cell adhesion to ECMs, Kidney Int, 70, 1769, 10.1038/sj.ki.5001939 · DOI
  26. H Schepers, 2007, Reintroduction of C/EBPalpha in leukemic CD34+ stem/progenitor cells impairs self-renewal and partially restores myelopoiesis, Blood, 110, 1317, 10.1182/blood-2006-10-052175 · DOI
  27. JJ Schuringa, 2004, Enforced activation of STAT5A facilitates the generation of embryonic stem-derived hematopoietic stem cells that contribute to hematopoiesis in vivo, Stem Cells, 22, 1191, 10.1634/stemcells.2004-0033 · DOI
  28. HJ de Jonge, 2010, High VEGFC expression is associated with unique gene expression profiles and predicts adverse prognosis in pediatric and adult acute myeloid leukemia, Blood, 116, 1747, 10.1182/blood-2010-03-270991 · DOI
  29. FO Bagger, 2012, HemaExplorer: a Web server for easy and fast visualization of gene expression in normal and malignant hematopoiesis, Blood, 119, 6394, 10.1182/blood-2012-05-427310 · DOI
  30. M Nieborowska-Skorska, 2012, Rac2-MRC-cIII-generated ROS cause genomic instability in chronic myeloid leukemia stem cells and primitive progenitors, Blood, 119, 4253, 10.1182/blood-2011-10-385658 · DOI · Paper page
  31. T Skorski, 1998, BCR/ABL-mediated leukemogenesis requires the activity of the small GTP-binding protein Rac, Proc Natl Acad Sci U S A, 95, 11858, 10.1073/pnas.95.20.11858 · DOI · Paper page
  32. EK Thomas, 2008, Rac GTPases as key regulators of p210-BCR-ABL-dependent leukemogenesis, Leukemia, 22, 898, 10.1038/leu.2008.71 · DOI · Paper page
  33. DA Williams, 2008, Rho GTPases and Regulation of Hematopoietic Stem Cell Localization, Volume, 439, 365
  34. H Li, 2013, Association between Gai2 and ELMO1/Dock180 connects chemokine signalling with Rac activation and metastasis, Nat Commun, 4, 1706, 10.1038/ncomms2680 · DOI
  35. H Wang, 2010, The role of Crk/Dock180/Rac1 pathway in the malignant behavior of human ovarian cancer cell SKOV3, Tumor Biol, 31, 59, 10.1007/s13277-009-0009-9 · DOI
  36. J Wang, 2014, Elmo1 Helps Dock180 to Regulate Rac1 Activity and Cell Migration of Ovarian Cancer, International Journal of Gynecological Cancer, 24, 10.1097/IGC.0000000000000137 · DOI

Cited by

Metadata

Authors
Capala, M. E., Vellenga, E., & Schuringa, J. J.
Venue
PLoS ONE
Published
2014-10-31
Volume
9
Issue
10
Pages
e111568
ISSN
1932-6203
Cited by
11
References
5
Language
en

About these checks

Registry, retraction, Cites and statistics results are computed, not judged, with one exception: a printed reference that no index lists is read once by a model before it counts as a citation error. Claims are extracted by a model and kept only when their quote appears verbatim in the text; each cited source is then checked, with a model’s help, for whether it says what the claim relies on. Those verdicts can be wrong — read the claim’s quote and the cited source before relying on one.

Statistics and arithmetic are recomputed, not judged.

Confidence bands are shown only for fields calibrated on our annotated test set. None is calibrated yet, so no band is shown.

What counts as a claim ›How we measure confidence ›How we check this ›

Are you an author, or do you see a problem with this page? Request a review