

The DOI matches its Crossref record; 24 of the 24 references it cites were found in a registry or an index.
Entropy-Based Financial Asset Pricing
Open accessAbstract
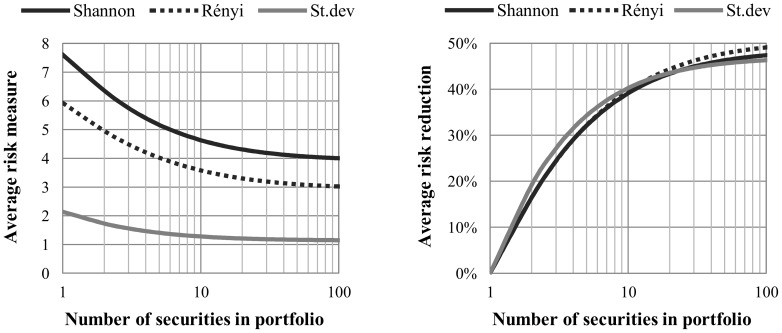
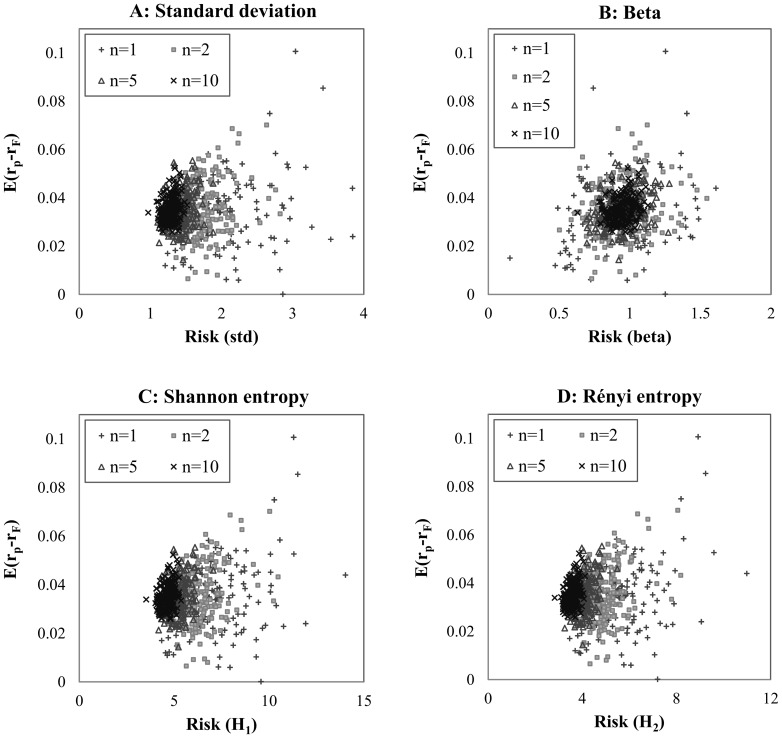
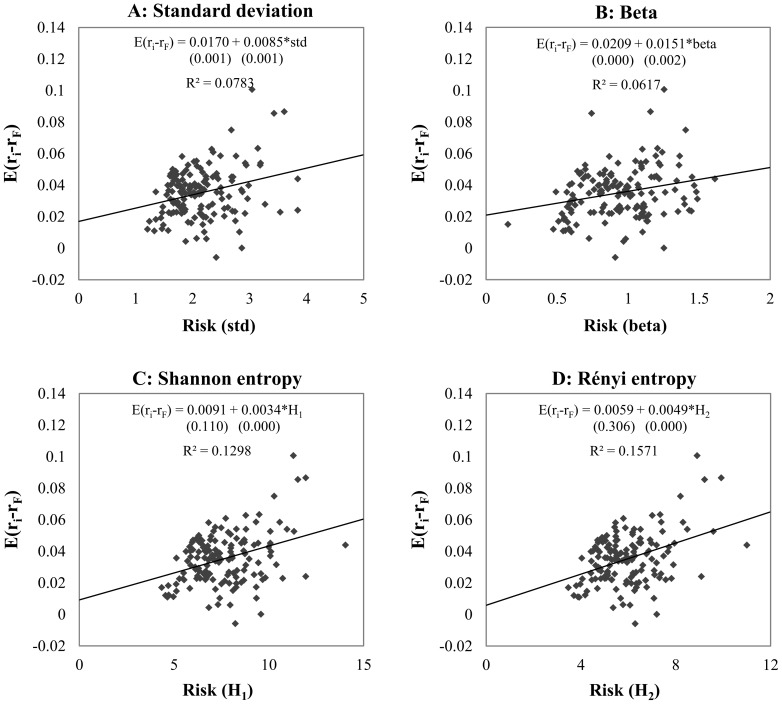
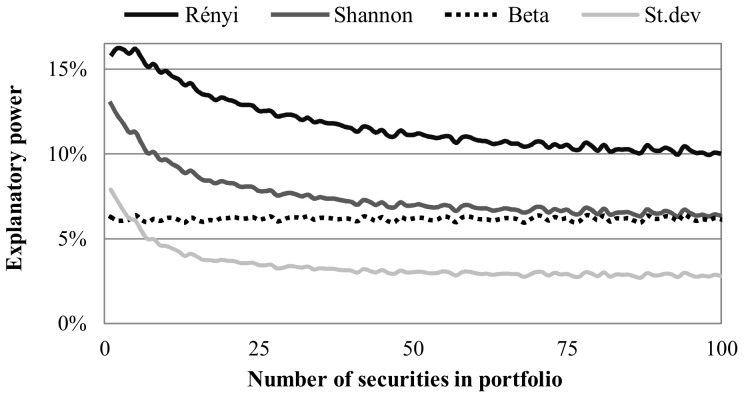
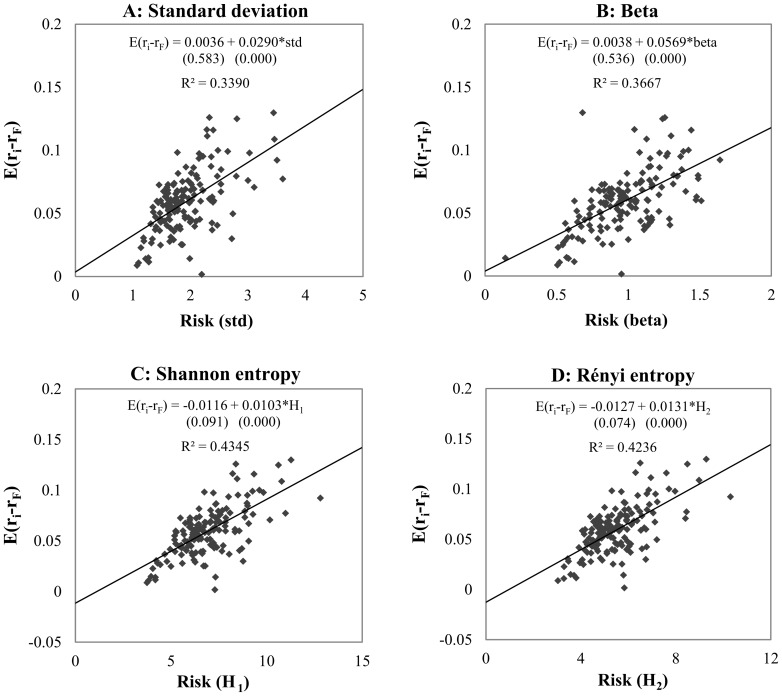
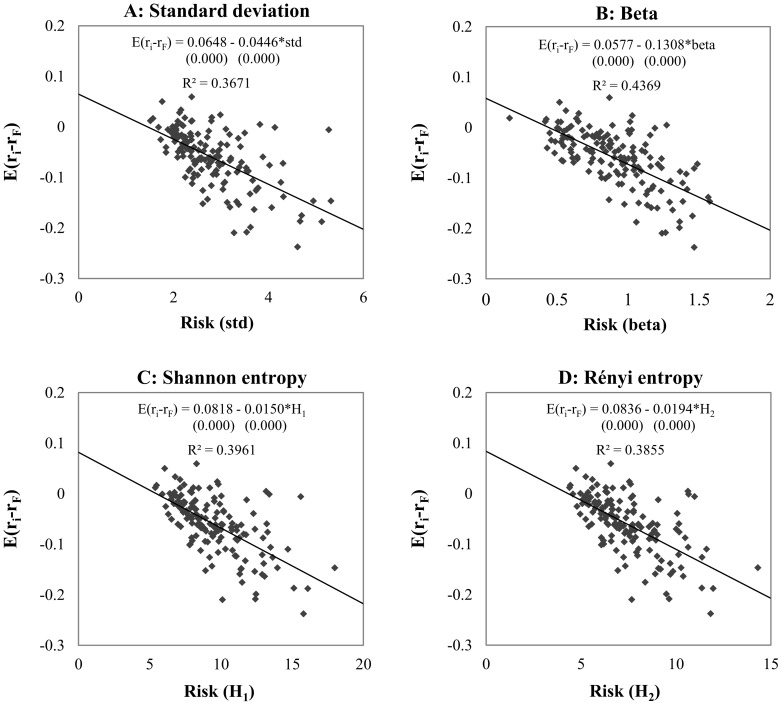
We investigate entropy as a financial risk measure. Entropy explains the equity premium of securities and portfolios in a simpler way and, at the same time, with higher explanatory power than the beta parameter of the capital asset pricing model. For asset pricing we define the continuous entropy as an alternative measure of risk. Our results show that entropy decreases in the function of the number of securities involved in a portfolio in a similar way to the standard deviation, and that efficient portfolios are situated on a hyperbola in the expected return-entropy system. For empirical investigation we use daily returns of 150 randomly selected securities for a period of 27 years. Our regression results show that entropy has a higher explanatory power for the expected return than the capital asset pricing model beta. Furthermore we show the time varying behavior of the beta along with entropy.
Overview
The claims and statistics of this paper haven’t been checked yet.
Run the check — free, no account needed. It reads the open-access text and checks the sources it cites.
Integrity signals
Registry
Cites
Statistics
Figures
Verification
Claims the paper makes
The claims and statistics of this paper haven’t been checked yet.
Run the check — free, no account needed. It reads the open-access text and checks the sources it cites.
Claims other papers make about this one
Each is checked against this paper’s own text: does it say what the citing paper says it does?
The cited source says what the claim attributes to it.
In the citing paper
“Their regression results show that entropy has higher explanatory power for the expected return than the capital asset pricing model (CAPM) beta and the standard deviation.”
From Methods and Analysis of Collar Strategies (2021) · cites this paper as Ormos & Zibriczky (2014)
Self-check
Percentages, sums and reported differences re-computed from the paper’s own numbers.
The self-check needs the paper’s full text.
Citations
Cites
A Mathematical Theory of Communication
Shannon, C. E. (1948) · Bell System Technical Journal · doi:10.1002/j.1538-7305.1948.tb01338.x · Cited by 88,486
A Mathematical Theory of Communication
Shannon, C. E. (1948) · The MIT Press eBooks · doi:10.1002/j.1538-7305.1948.tb00917.x · Cited by 50,398
CAPITAL ASSET PRICES: A THEORY OF MARKET EQUILIBRIUM UNDER CONDITIONS OF RISK*
Sharpe, W. F. (1964) · The Journal of Finance · doi:10.1111/j.1540-6261.1964.tb02865.x · Cited by 19,441
Markowitz, H. M. (1952) · The Journal of Finance · doi:10.1111/j.1540-6261.1952.tb01525.x · Cited by 18,429
Density Estimation for Statistics and Data Analysis
Silverman, B. W. (2018) · Routledge eBooks · doi:10.1201/9781315140919 · Cited by 15,938
Density Estimation for Statistics and Data Analysis
(1986) · Springer eBooks · doi:10.1007/978-1-4899-3324-9 · Cited by 8,569
THE PERFORMANCE OF MUTUAL FUNDS IN THE PERIOD 1945–1964
Jensen, M. C. (1968) · The Journal of Finance · doi:10.1111/j.1540-6261.1968.tb00815.x · Cited by 4,332
On Measures of Entropy and Information
Rényi, A. (1961) · Project Euclid (Cornell University) · Cited by 4,031
On Optimal and Data-Based Histograms
Scott, D. W. (1979) · Biometrika · doi:10.1093/biomet/66.3.605 · Cited by 1,875
On the histogram as a density estimator:L 2 theory
Freedman, D. A., & Diaconis, P. W. (1981) · Probability Theory and Related Fields · doi:10.1007/bf01025868 · Cited by 1,693
Research works printed but not linked: 1
- Turlach BA (1993) Bandwidth selection in kernel density estimation: A review: Université catholique de Louvain. DOI: 10.1.1.44.6770.
Cited by
Sorted by citations
Naffa, H., & Fain, M. (2020) · PLoS ONE · doi:10.1371/journal.pone.0244225 · Cited by 94
Foreign exchange rate entropy evolution during financial crises
Stošić, D., Stošić, D., Ludermir, T. B., de Oliveira, W. R., & Stošić, T. (2016) · Physica A Statistical Mechanics and its Applications · doi:10.1016/j.physa.2015.12.124 · Cited by 52
A weighted information-gain measure for ordinal classification trees
Singer, G., Anuar, R., & Ben‐Gal, I. (2020) · Expert Systems with Applications · doi:10.1016/j.eswa.2020.113375 · Cited by 42
Binary and multi-class motor imagery using Renyi entropy for feature extraction
Kee, C.-Y., Ponnambalam, S. G., & Loo, C. K. (2016) · Neural Computing and Applications · doi:10.1007/s00521-016-2178-y · Cited by 36
Information measure for financial time series: Quantifying short-term market heterogeneity
Ponta, L., & Carbone, A. (2018) · Physica A Statistical Mechanics and its Applications · doi:10.1016/j.physa.2018.06.085 · Cited by 29
Metadata
- Authors
- Ormos, M., & Zibriczky, D.
- Affiliations
- Budapest University of Technology and Economics (HU)
- Corresponding author
- Ormos, Mihály
- ORCID
- Ormos, Mihály
- Venue
- PLoS ONE
- Publisher
- Public Library of Science (PLoS)
- Published
- 2014-12-29
- Volume
- 9
- Issue
- 12
- Pages
- e115742
- ISSN
- 1932-6203 (ISSN-L)
- PMC
- PMC4278763
- OpenAlex
- W1964018898
- Cited by
- 70
- References
- 24
- Citations by year
- 2026: 2 · 2025: 6 · 2024: 1 · 2023: 1 · 2022: 6 · 2021: 7 · 2020: 17 · 2019: 12 · 2018: 4 · 2017: 9 · 2016: 3 · 2015: 2
- FWCI
- 8.54
- Type
- journal article
- Language
- en
- Open access
- gold
- doi.org
- Locations
- PLoS ONE (publishedVersion, cc-by)
- Europe PMC (PubMed Central) (publishedVersion, cc-by)
- PubMed Central (publishedVersion, cc-by)
- PubMed (publishedVersion)
- arXiv (Cornell University) (submittedVersion)
- RePEc: Research Papers in Economics (submittedVersion)
- DOAJ (DOAJ: Directory of Open Access Journals) (submittedVersion, cc-by-sa)
- Figshare (submittedVersion, cc-by)
- Topics
- Social Sciences › Economics, Econometrics and Finance › Finance › Financial Markets and Investment Strategies
- Social Sciences › Economics, Econometrics and Finance › Finance › Financial Risk and Volatility Modeling
- Social Sciences › Decision Sciences › Management Science and Operations Research › Risk and Portfolio Optimization
- Keywords
- entropy (information theory), asset pricing, equity premium, capital asset pricing model, beta, efficient frontier, expected returns, portfolio diversification, time-varying beta, daily stock returns
- MeSH terms
- Costs and Cost Analysis, Investments, Models, Theoretical, Risk Factors, Entropy
About these checks
Registry, retraction, Cites and statistics results are computed, not judged, with one exception: a printed reference that no index lists is read once by a model before it counts as a citation error. Claims are extracted by a model and kept only when their quote appears verbatim in the text; each cited source is then checked, with a model’s help, for whether it says what the claim relies on. Those verdicts can be wrong — read the claim’s quote and the cited source before relying on one.
Statistics and arithmetic are recomputed, not judged.
Confidence bands are shown only for fields calibrated on our annotated test set. None is calibrated yet, so no band is shown.
What counts as a claim ›How we measure confidence ›How we check this ›
Are you an author, or do you see a problem with this page? Request a review
How to cite
Cite CoChat for the checks on this page, and the paper for its own findings.
- This page
- CoChat. (2026). Citation check: Entropy-Based Financial Asset Pricing. https://app.cochat.ai/papers/10.1371/journal.pone.0115742
- The paper
- Ormos, M., & Zibriczky, D. (2014). Entropy-Based Financial Asset Pricing. PLoS ONE. https://doi.org/10.1371/journal.pone.0115742
