Cited by 151Alzheimer's disease research and treatmentsNeuroinflammation and Neurodegeneration MechanismsNeurological Disease Mechanisms and Treatments

The DOI matches its Crossref record; 55 of the 55 references it cites were found in a registry or an index.

Protection of TGF-β1 against Neuroinflammation and Neurodegeneration in Aβ1–42-Induced Alzheimer’s Disease Model Rats

Open access
Chen, Jia-Hui, Ke, Kai-Fu, Lu, Jian-Hua, Qiu, Yi-Hua, Peng, Yu-Ping·2015·PLOS ONE

Abstract

Neuroinflammation has been reported to be associated with Alzheimer's disease (AD) pathogenesis. Neuroinflammation is generally considered as an outcome of glial activation; however, we recently demonstrated that T helper (Th)17 cells, a subpopulation of proinflammatory CD4+ T cells, are also involved in AD pathogenesis. Transforming growth factor (TGF)-β1, a cytokine that can be expressed in the brain, can be immunosuppressive, but its effects on lymphocyte-mediated neuroinflammation in AD pathogenesis have not been well addressed. In the current study we administered TGF-β1 via intracerebroventricle (ICV) and intranasal (IN) routes in AD model rats to investigate its antiinflammatory and neuroprotective effects. The AD rat model was prepared by bilateral hippocampal injection of amyloid-β (Aβ)1-42. TGF-β1 was administered via ICV one hour prior to Aβ1-42 injection or via both nares seven days after Aβ1-42 injection. ICV administration of TGF-β1 before Aβ1-42 injection remarkably ameliorated Aβ1-42-induced neurodegeneration and prevented Aβ1-42-induced increases in glia-derived proinflammatory mediators (TNF-α, IL-1β and iNOS), as well as T cell-derived proinflammatory cytokines (IFN-γ, IL-2, IL-17 and IL-22), in the hypothalamus, serum or cerebrospinal fluid (CSF) in a concentration-dependent manner. TGF-β1 pretreatment also prevented Aβ1-42-induced decreases in the neurotrophic factors, IGF-1, GDNF and BDNF, and in the antiinflammatory cytokine, IL-10. Similarly, IN administration of TGF-β1 after Aβ1-42 injection reduced neurodegeneration, elevation of proinflammatory mediators and cytokines, and reduction of neurotrophic and antiinflammatory factors, in the hypothalamus, serum or CSF. These findings suggest that TGF-β1 suppresses glial and T cell-mediated neuroinflammation and thereby alleviates AD-related neurodegeneration. The effectiveness of IN administered TGF-β1 in reducing Aβ1-42 neurotoxicity suggests a possible therapeutic approach in patients with AD.

Overview

The claims and statistics of this paper haven’t been checked yet.

Run the check — free, no account needed. It reads the open-access text and checks the sources it cites.

A few free checks a day · papers already verified open instantly · results are public

Integrity signals

Registry

Crossref · 10.1371/journal.pone.0116549

Cites

55 of 55 references verified0 citation errors · 0 not checkable

Statistics

Figures

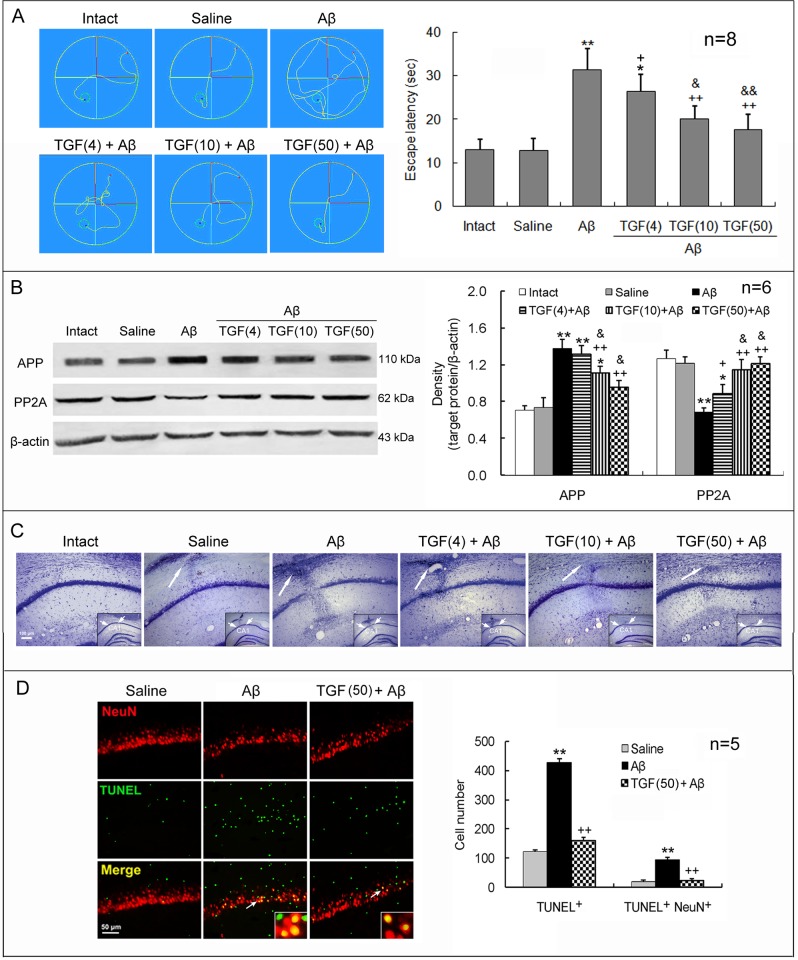
Figure 1 ICV TGF-β1 pretreatment prevents Aβ1–42-induced cognitive impairment and neuronal loss and apoptosis. TGF-β1 (4, 10 or 50 ng in 5 μl) was given ICV one hour prior to bilateral hippocampal Aβ1–42 injection in rats. On day 7 following TGF-β1 administration, behavioral and neuronal changes were measured. (A) Escape latency in Morris water maze. Left panel exhibits swimming tracks of rats in Morris water maze. The escape latency was recorded from the time the rats entered the water (the red points) until their arrival on the platform (the green small rounds). Right panel is a statistical histogram for these experiments. (B) Expression levels of APP and PP2A in the hippocampus. Left panel shows representative electrophoretic bands, and right panel indicates graphical results of repeated experiments. (C) Nissl stain of hippocampal CA1 region of rats. The big arrows point to locations where injection needles were placed and reactive gliosis is seen. Note that Aβ1–42 induced an obvious neuron loss in the CA1 region and that TGF-β1 reduced this loss, reflected by the density of cells with Nissl bodies. The insets within the images are general views of the hippocampus, in which the CA1 region is denoted. (D) Immunofluorescent histochemistry for NeuN and TUNEL in the hippocampus. Left panel is a representative image. The arrows point to the NeuN/TUNEL double-stained cells, which are magnified in the insets. Right panel is a statistical histogram of the repeated experiments. For each rat, a total of 15 visual fields in three hippocampal sections was counted for the TUNEL-positive cells. Aβ = Aβ1–42; TGF(4) = 4 ng of TGF-β1; TGF(10) = 10 ng of TGF-β1; TGF(50) = 50 ng of TGF-β1. *p<0.05, **p<0.01, versus intact or saline-treated rats; +p<0.05, ++p<0.01, versus alone Aβ1–42-injected rats; &p<0.05, &&p<0.01, versus 4 or 10 ng of TGF-β1 administered rats.
Figure 1 ICV TGF-β1 pretreatment prevents Aβ1–42-induced cognitive impairment and neuronal loss and apoptosis. TGF-β1 (4, 10 or 50 ng in 5 μl) was given ICV one hour prior to bilateral hippocampal Aβ1–42 injection in rats. On day 7 following TGF-β1 administration, behavioral and neuronal changes were measured. (A) Escape latency in Morris water maze. Left panel exhibits swimming tracks of rats in Morris water maze. The escape latency was recorded from the time the rats entered the water (the red points) until their arrival on the platform (the green small rounds). Right panel is a statistical histogram for these experiments. (B) Expression levels of APP and PP2A in the hippocampus. Left panel shows representative electrophoretic bands, and right panel indicates graphical results of repeated experiments. (C) Nissl stain of hippocampal CA1 region of rats. The big arrows point to locations where injection needles were placed and reactive gliosis is seen. Note that Aβ1–42 induced an obvious neuron loss in the CA1 region and that TGF-β1 reduced this loss, reflected by the density of cells with Nissl bodies. The insets within the images are general views of the hippocampus, in which the CA1 region is denoted. (D) Immunofluorescent histochemistry for NeuN and TUNEL in the hippocampus. Left panel is a representative image. The arrows point to the NeuN/TUNEL double-stained cells, which are magnified in the insets. Right panel is a statistical histogram of the repeated experiments. For each rat, a total of 15 visual fields in three hippocampal sections was counted for the TUNEL-positive cells. Aβ = Aβ1–42; TGF(4) = 4 ng of TGF-β1; TGF(10) = 10 ng of TGF-β1; TGF(50) = 50 ng of TGF-β1. *p<0.05, **p<0.01, versus intact or saline-treated rats; +p<0.05, ++p<0.01, versus alone Aβ1–42-injected rats; &p<0.05, &&p<0.01, versus 4 or 10 ng of TGF-β1 administered rats.CC BY · PubMed Central
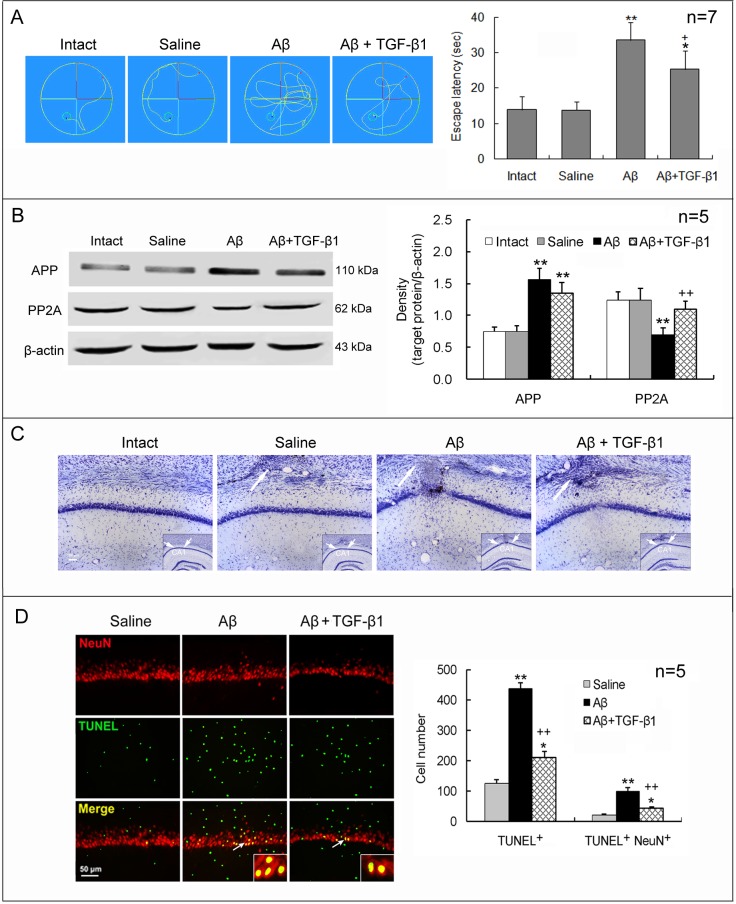
Figure 2 IN TGF-β1 post-treatment reduces Aβ1–42-induced cognitive impairment and neuronal loss and apoptosis. TGF-β1 (1.5 μg/30 μl) was given IN seven days after Aβ1–42 injection. On day 7 following TGF-β1 administration, escape latency in Morris water maze (A), expression of APP and PP2A (B), and neuronal loss (C) and apoptosis (D) in the hippocampus were measured. The design of the experiments and the meaning of the figure are similar to those of Fig. 1, except that TGF-β1 was given IN after Aβ1–42 injection at one concentration. *p<0.05, **p<0.01, versus intact or saline-treated rats; +p<0.05, ++p<0.01, versus alone Aβ1–42-injected rats.
Figure 2 IN TGF-β1 post-treatment reduces Aβ1–42-induced cognitive impairment and neuronal loss and apoptosis. TGF-β1 (1.5 μg/30 μl) was given IN seven days after Aβ1–42 injection. On day 7 following TGF-β1 administration, escape latency in Morris water maze (A), expression of APP and PP2A (B), and neuronal loss (C) and apoptosis (D) in the hippocampus were measured. The design of the experiments and the meaning of the figure are similar to those of Fig. 1, except that TGF-β1 was given IN after Aβ1–42 injection at one concentration. *p<0.05, **p<0.01, versus intact or saline-treated rats; +p<0.05, ++p<0.01, versus alone Aβ1–42-injected rats.CC BY · PubMed Central
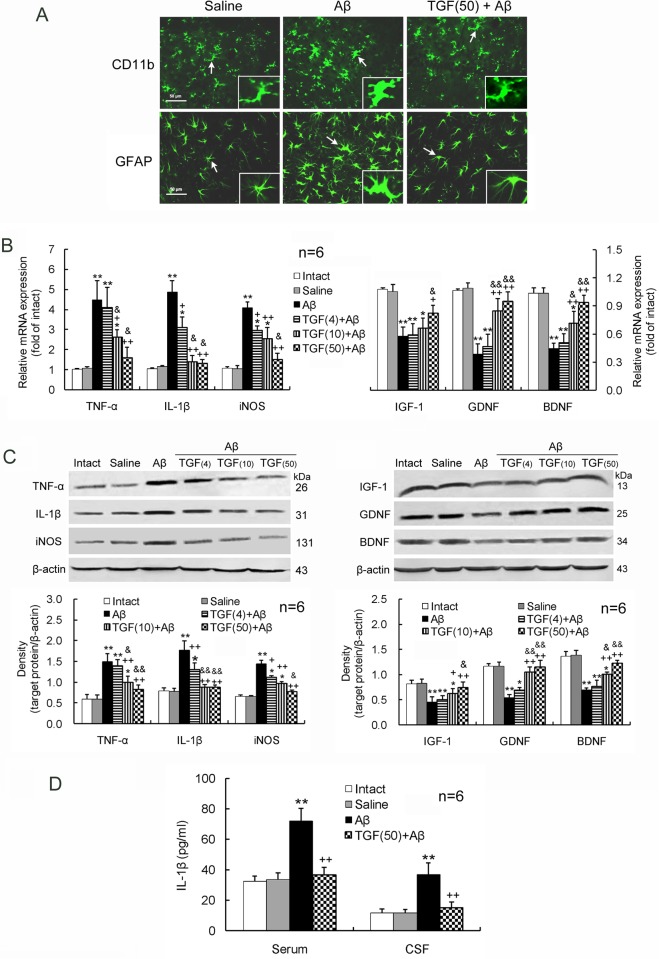
Figure 3 ICV TGF-β1 pretreatment prevents Aβ1–42-induced glial activation. TGF-β1 (4, 10 or 50 ng in 5 μl) was given ICV one hour prior to Aβ1–42 injection. On day 7 following TGF-β1 administration, glial cells including microglia and astrocytes in the hippocampus were evaluated for their activation and function. (A) Immunofluorescent histochemistry of hippocampal sections. Note that the microglia and astrocytes, tagged by CD11b and GFAP, respectively, are obviously increased in soma size with retraction of processes by the Aβ1–42 treatment. The characteristics meet morphological criteria of activation of microglia and astrocytes. TGF-β1 pretreatment before Aβ1–42 injection reduces soma size of microglia and astrocytes compared with Aβ1–42 injection alone. The insets are amplifications of the cells indicated by arrows. (B) mRNA expression levels of the proinflammatory mediators, TNF-α, IL-1β and iNOS, and the neurotrophic factors, IGF-1, GDNF and BDNF, in the hippocampus. (C) Protein expression levels of the proinflammatory mediators and the neurotrophic factors. (D) IL-1β concentrations in the serum and CSF measured by ELISA. *p<0.05, **p<0.01, versus intact or saline-treated rats; +p<0.05, ++p<0.01, versus alone Aβ1–42-injected rats; &p<0.05, &&p<0.01, versus 4 or 10 ng of TGF-β1 administered rats. Aβ = Aβ1–42; TGF(4) = 4 ng of TGF-β1; TGF(10) = 10 ng of TGF-β1; TGF(50) = 50 ng of TGF-β1.
Figure 3 ICV TGF-β1 pretreatment prevents Aβ1–42-induced glial activation. TGF-β1 (4, 10 or 50 ng in 5 μl) was given ICV one hour prior to Aβ1–42 injection. On day 7 following TGF-β1 administration, glial cells including microglia and astrocytes in the hippocampus were evaluated for their activation and function. (A) Immunofluorescent histochemistry of hippocampal sections. Note that the microglia and astrocytes, tagged by CD11b and GFAP, respectively, are obviously increased in soma size with retraction of processes by the Aβ1–42 treatment. The characteristics meet morphological criteria of activation of microglia and astrocytes. TGF-β1 pretreatment before Aβ1–42 injection reduces soma size of microglia and astrocytes compared with Aβ1–42 injection alone. The insets are amplifications of the cells indicated by arrows. (B) mRNA expression levels of the proinflammatory mediators, TNF-α, IL-1β and iNOS, and the neurotrophic factors, IGF-1, GDNF and BDNF, in the hippocampus. (C) Protein expression levels of the proinflammatory mediators and the neurotrophic factors. (D) IL-1β concentrations in the serum and CSF measured by ELISA. *p<0.05, **p<0.01, versus intact or saline-treated rats; +p<0.05, ++p<0.01, versus alone Aβ1–42-injected rats; &p<0.05, &&p<0.01, versus 4 or 10 ng of TGF-β1 administered rats. Aβ = Aβ1–42; TGF(4) = 4 ng of TGF-β1; TGF(10) = 10 ng of TGF-β1; TGF(50) = 50 ng of TGF-β1.CC BY · PubMed Central
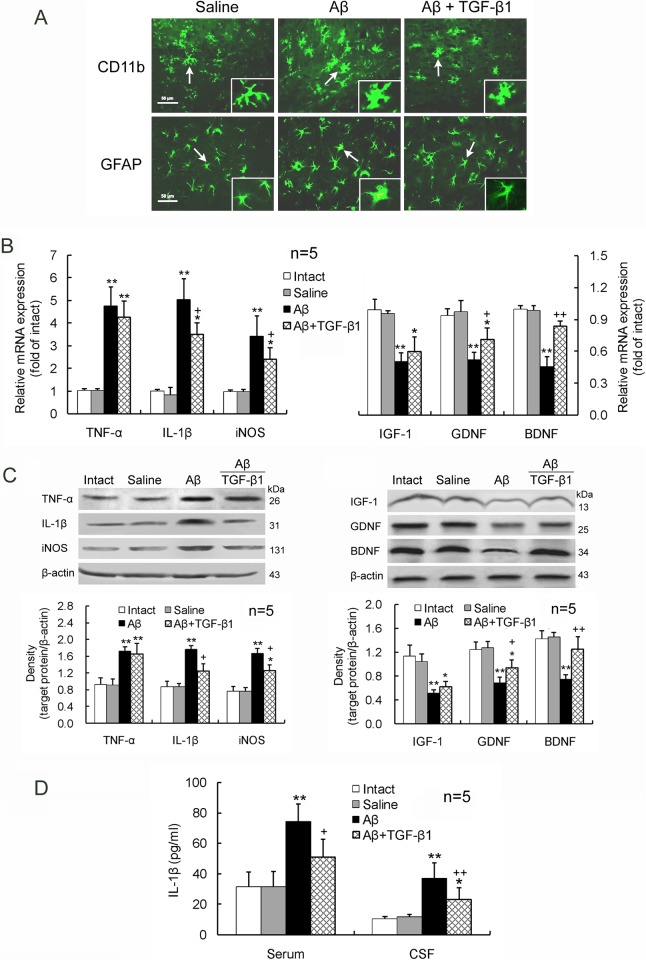
Figure 4 IN TGF-β1 post-treatment alleviates Aβ1–42-induced glial activation. TGF-β1 (1.5 μg/30 μl) was given IN seven days after Aβ1–42 injection. On day 7 following TGF-β1 administration, glial activation morphology (A), gene (B) and protein (C) expression levels of the proinflammatory mediators and neurotrophic factors in the hippocampus, as well as IL-1β concentrations in the serum and CSF (D) were measured. The design of the experiments and the meaning of the figure are similar to those of Fig. 3, except that TGF-β1 was given IN after Aβ1–42 invasion at one concentration. *p<0.05, **p<0.01, versus intact or saline-treated rats; +p<0.05, ++p<0.01, versus alone Aβ1–42-injected rats.
Figure 4 IN TGF-β1 post-treatment alleviates Aβ1–42-induced glial activation. TGF-β1 (1.5 μg/30 μl) was given IN seven days after Aβ1–42 injection. On day 7 following TGF-β1 administration, glial activation morphology (A), gene (B) and protein (C) expression levels of the proinflammatory mediators and neurotrophic factors in the hippocampus, as well as IL-1β concentrations in the serum and CSF (D) were measured. The design of the experiments and the meaning of the figure are similar to those of Fig. 3, except that TGF-β1 was given IN after Aβ1–42 invasion at one concentration. *p<0.05, **p<0.01, versus intact or saline-treated rats; +p<0.05, ++p<0.01, versus alone Aβ1–42-injected rats.CC BY · PubMed Central
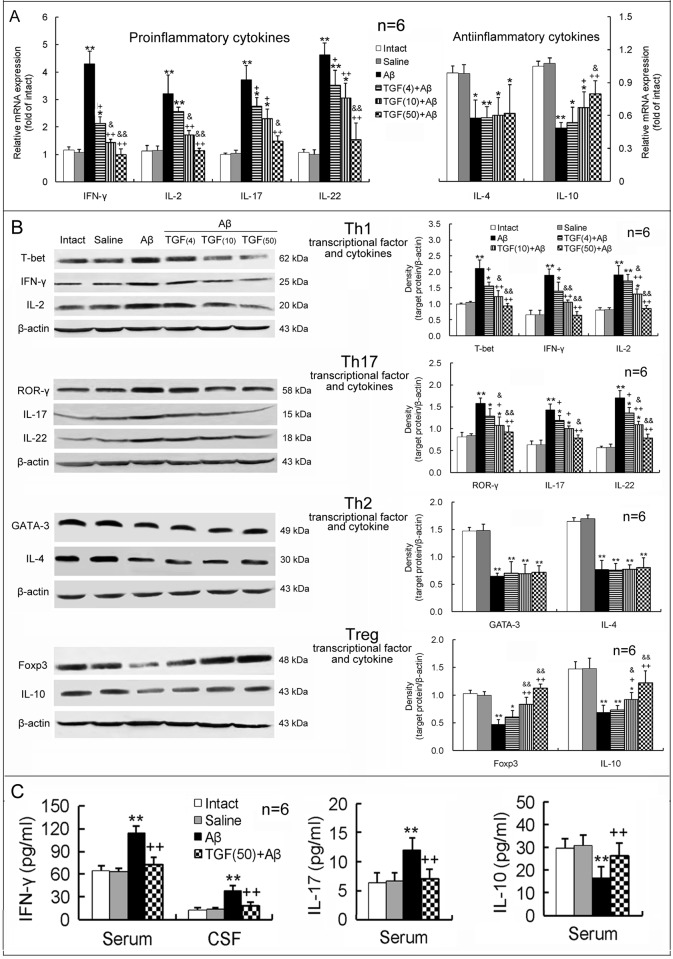
Figure 5 ICV TGF-β1 pretreatment prevents Aβ1–42-induced imbalance in proinflammatory/antiinflammatory responses of T lymphocytes. TGF-β1 (4, 10 or 50 ng in 5 μl) was given ICV one hour prior to Aβ1–42 injection. On day 7 following TGF-β1 administration, differentiation and function of Th1, Th17, Th2 and Treg cells were assessed by measuring levels of specific transcriptional factors and cytokines in the hippocampus, serum and CSF. (A) Gene expression of T lymphocyte-related proinflammatory and antiinflammatory cytokines in the hippocampus. (B) Protein expression of specific transcriptional factors (T-bet, ROR-γ, GATA-3 and Foxp3) and cytokines of T lymphocyte subsets in the hippocampus. (C) Concentrations of Th1- and Th17-related proinflammatory cytokines (IFN-γ and IL-17) and the Treg-related antiinflammatory cytokine (IL-10) in serum and/or CSF. *p<0.05, **p<0.01, versus intact or saline-treated rats; +p<0.05, ++p<0.01, versus alone Aβ1–42-injected rats; &p<0.05, &&p<0.01, versus 4 or 10 ng of TGF-β1 administered rats. Aβ = Aβ1–42; TGF(4) = 4 ng of TGF-β1; TGF(10) = 10 ng of TGF-β1; TGF(50) = 50 ng of TGF-β1.
Figure 5 ICV TGF-β1 pretreatment prevents Aβ1–42-induced imbalance in proinflammatory/antiinflammatory responses of T lymphocytes. TGF-β1 (4, 10 or 50 ng in 5 μl) was given ICV one hour prior to Aβ1–42 injection. On day 7 following TGF-β1 administration, differentiation and function of Th1, Th17, Th2 and Treg cells were assessed by measuring levels of specific transcriptional factors and cytokines in the hippocampus, serum and CSF. (A) Gene expression of T lymphocyte-related proinflammatory and antiinflammatory cytokines in the hippocampus. (B) Protein expression of specific transcriptional factors (T-bet, ROR-γ, GATA-3 and Foxp3) and cytokines of T lymphocyte subsets in the hippocampus. (C) Concentrations of Th1- and Th17-related proinflammatory cytokines (IFN-γ and IL-17) and the Treg-related antiinflammatory cytokine (IL-10) in serum and/or CSF. *p<0.05, **p<0.01, versus intact or saline-treated rats; +p<0.05, ++p<0.01, versus alone Aβ1–42-injected rats; &p<0.05, &&p<0.01, versus 4 or 10 ng of TGF-β1 administered rats. Aβ = Aβ1–42; TGF(4) = 4 ng of TGF-β1; TGF(10) = 10 ng of TGF-β1; TGF(50) = 50 ng of TGF-β1.CC BY · PubMed Central
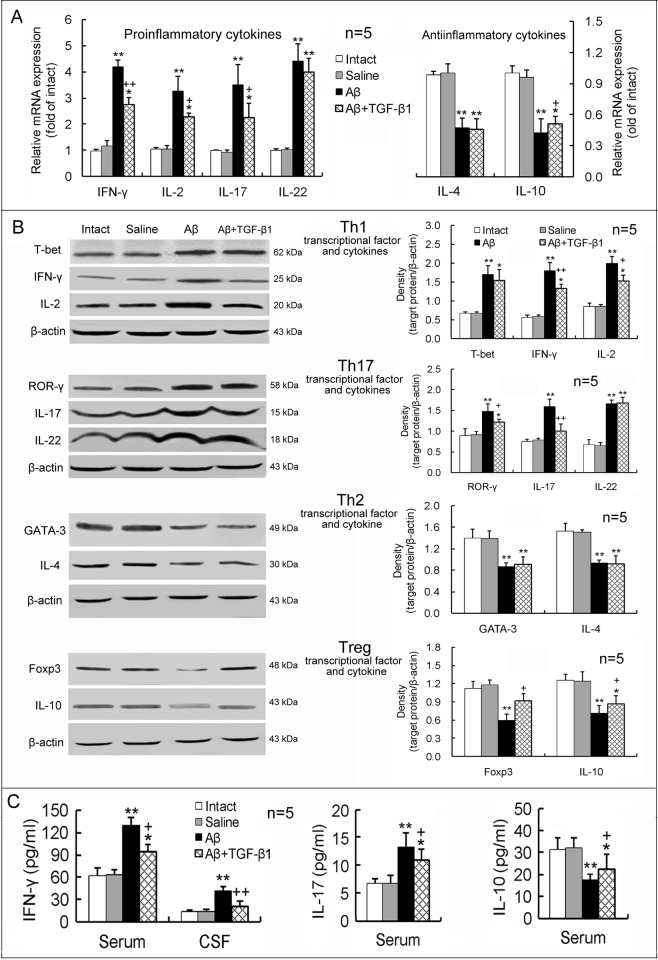
Figure 6 IN TGF-β1 post-treatment ameliorates Aβ1–42-induced imbalance in proinflammatory/antiinflammatory responses of T lymphocytes. TGF-β1 (1.5 μg/30 μl) was given IN seven days after Aβ1–42 injection. On the 7th day following TGF-β1 administration, differentiation and function of Th1, Th17, Th2 and Treg cells were measured. The design of the experiments and meaning of the figure are similar to those of Fig. 5, except that TGF-β1 was given IN after Aβ1–42 injection at one concentration. *p<0.05, **p<0.01, versus intact or saline-treated rats; +p<0.05, ++p<0.01, versus alone Aβ1–42-injected rats.
Figure 6 IN TGF-β1 post-treatment ameliorates Aβ1–42-induced imbalance in proinflammatory/antiinflammatory responses of T lymphocytes. TGF-β1 (1.5 μg/30 μl) was given IN seven days after Aβ1–42 injection. On the 7th day following TGF-β1 administration, differentiation and function of Th1, Th17, Th2 and Treg cells were measured. The design of the experiments and meaning of the figure are similar to those of Fig. 5, except that TGF-β1 was given IN after Aβ1–42 injection at one concentration. *p<0.05, **p<0.01, versus intact or saline-treated rats; +p<0.05, ++p<0.01, versus alone Aβ1–42-injected rats.CC BY · PubMed Central

Verification

Claims the paper makes

The claims and statistics of this paper haven’t been checked yet.

Run the check — free, no account needed. It reads the open-access text and checks the sources it cites.

A few free checks a day · papers already verified open instantly · results are public

Claims other papers make about this one

Each is checked against this paper’s own text: does it say what the citing paper says it does?

Self-check

Percentages, sums and reported differences re-computed from the paper’s own numbers.

The self-check needs the paper’s full text.

Citations

Cites

Show all 55 references

Cited by

Sorted by citations

See all 151

Metadata

Authors
Chen, J.-H., Ke, K.-F., Lu, J.-H., Qiu, Y.-H., & Peng, Y.-P.
Affiliations
Nantong University (CN)
Corresponding author
Peng, Yu-Ping
Venue
PLOS ONE
Published
2015-02-06
Volume
10
Issue
2
Pages
e0116549
ISSN
1932-6203 (ISSN-L)
OpenAlex
W2047256501
Cited by
151
References
55
Citations by year
2026: 9 · 2025: 17 · 2024: 11 · 2023: 9 · 2022: 10 · 2021: 17 · 2020: 20 · 2019: 12 · 2018: 18 · 2017: 10 · 2016: 14 · 2015: 4
FWCI
11.29
Type
journal article
Language
en
Open access
Locations
  • PLoS ONE (publishedVersion, cc-by)
  • PubMed Central (publishedVersion, cc-by)
  • PubMed (publishedVersion)
  • DOAJ (DOAJ: Directory of Open Access Journals) (submittedVersion, cc-by-sa)
Funders
  • University of Rochester
  • National Natural Science Foundation of China (31371182, 81271323)
  • Government of Jiangsu Province
  • Natural Science Foundation of Jiangsu Province
  • Priority Academic Program Development of Jiangsu Higher Education Institutions
Topics
  • Life Sciences › Neuroscience › Cellular and Molecular Neuroscience › Alzheimer's disease research and treatments
  • Life Sciences › Neuroscience › Neurology › Neuroinflammation and Neurodegeneration Mechanisms
  • Life Sciences › Neuroscience › Neurology › Neurological Disease Mechanisms and Treatments
Keywords
TGF-β1, Alzheimer's disease, neuroinflammation, neurodegeneration, amyloid-beta 42, Th17 cells, intranasal administration, intracerebroventricular administration, neuroprotection, neurotrophic factors, brain-derived neurotrophic factor, IL-10, inflammatory cytokines, glial activation, hypothalamus
MeSH terms
Administration, Intranasal, Alzheimer Disease, Animals, Anti-Inflammatory Agents, Disease Models, Animal, Hypothalamus, Inflammation, Injections, Nerve Degeneration, Neuroglia, Peptide Fragments, Cytokines, Amyloid beta-Peptides, Rats, Sprague-Dawley, Neuroprotective Agents, Rats, Transforming Growth Factor beta1

About these checks

Registry, retraction, Cites and statistics results are computed, not judged, with one exception: a printed reference that no index lists is read once by a model before it counts as a citation error. Claims are extracted by a model and kept only when their quote appears verbatim in the text; each cited source is then checked, with a model’s help, for whether it says what the claim relies on. Those verdicts can be wrong — read the claim’s quote and the cited source before relying on one.

Statistics and arithmetic are recomputed, not judged.

Confidence bands are shown only for fields calibrated on our annotated test set. None is calibrated yet, so no band is shown.

What counts as a claim ›How we measure confidence ›How we check this ›

Are you an author, or do you see a problem with this page? Request a review