

The DOI matches its Crossref record; 23 of the 23 references it cites were found in a registry or an index.
Th2 Cytokines Inhibit Lymphangiogenesis
Open accessAbstract
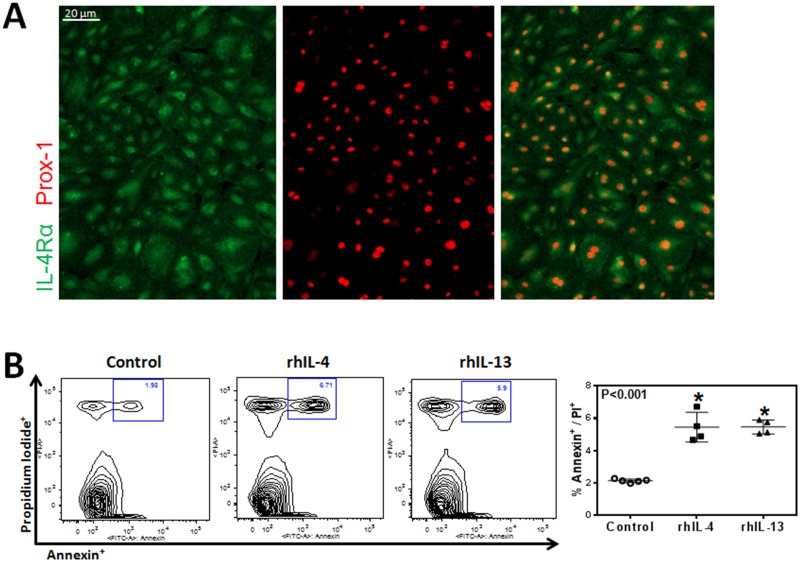
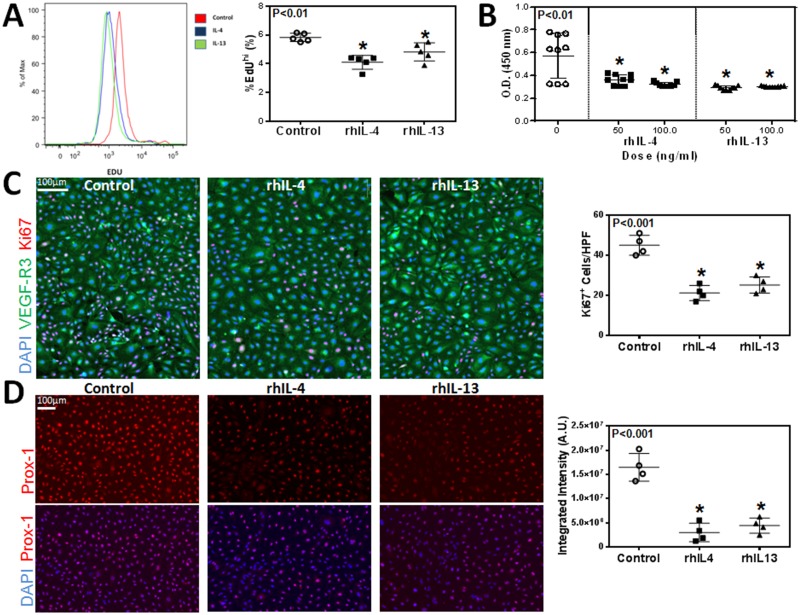
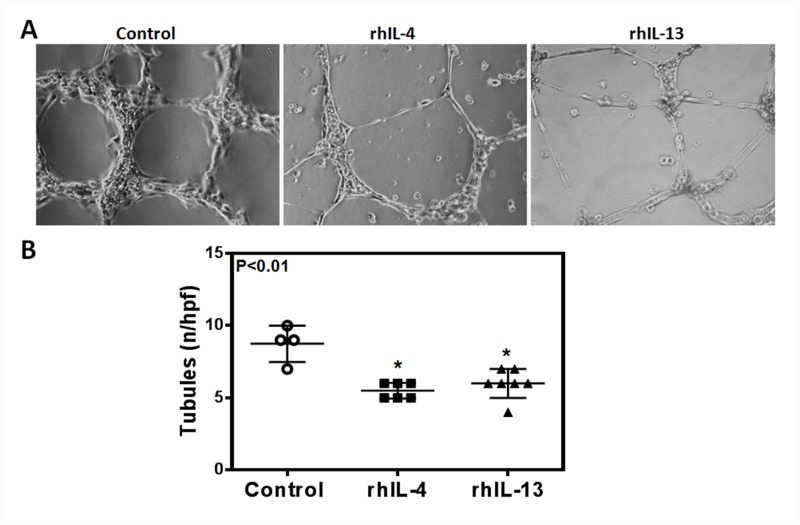
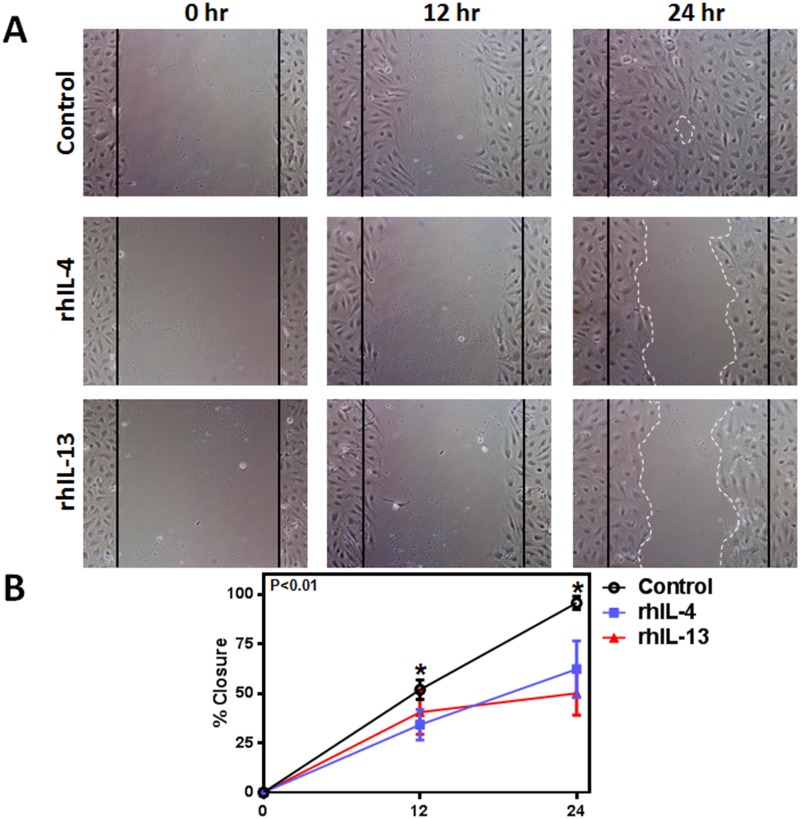
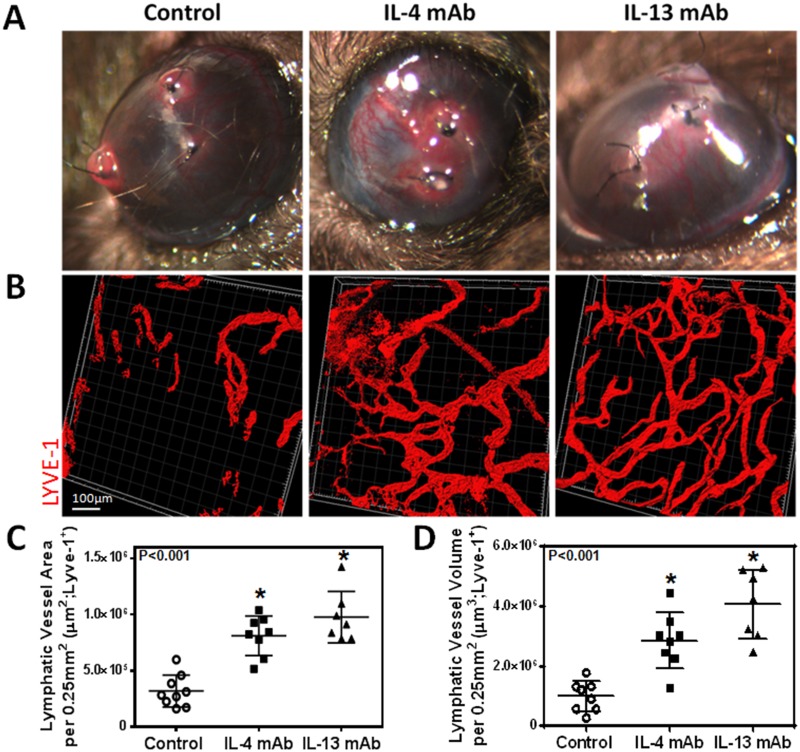
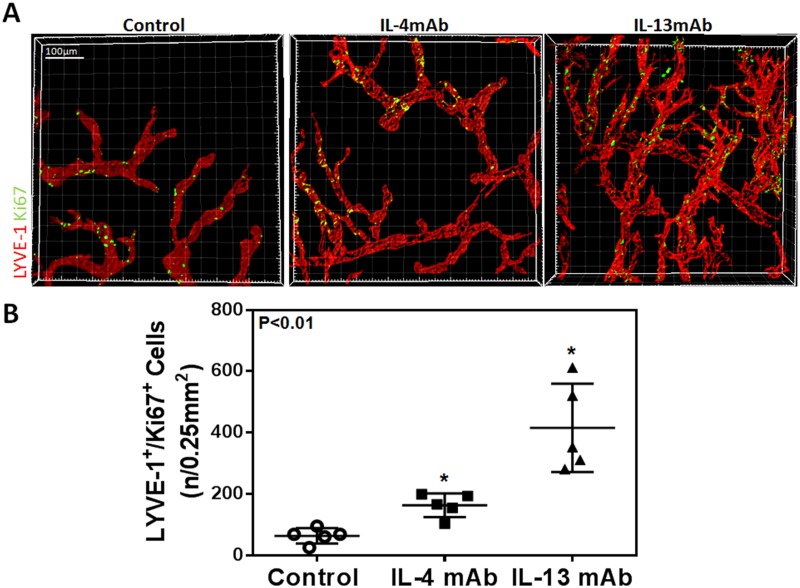
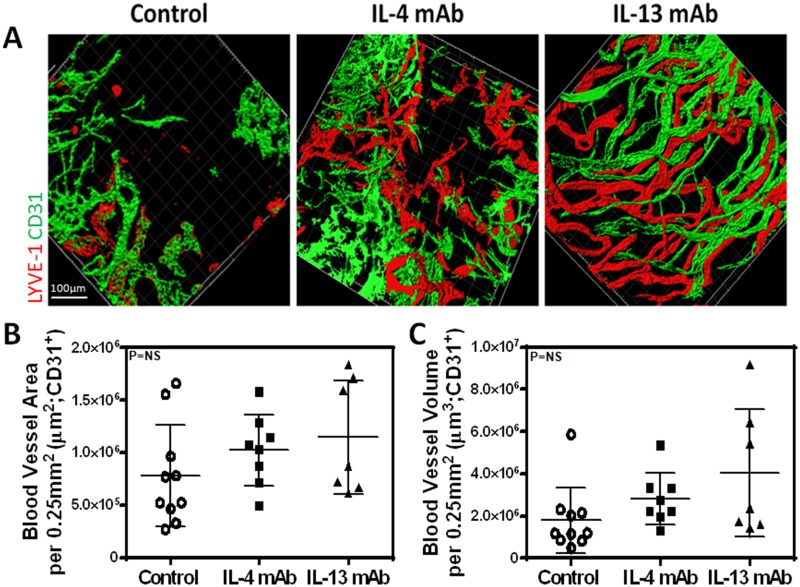
Lymphangiogenesis is the process by which new lymphatic vessels grow in response to pathologic stimuli such as wound healing, inflammation, and tumor metastasis. It is well-recognized that growth factors and cytokines regulate lymphangiogenesis by promoting or inhibiting lymphatic endothelial cell (LEC) proliferation, migration and differentiation. Our group has shown that the expression of T-helper 2 (Th2) cytokines is markedly increased in lymphedema, and that these cytokines inhibit lymphatic function by increasing fibrosis and promoting changes in the extracellular matrix. However, while the evidence supporting a role for T cells and Th2 cytokines as negative regulators of lymphatic function is clear, the direct effects of Th2 cytokines on isolated LECs remains poorly understood. Using in vitro and in vivo studies, we show that physiologic doses of interleukin-4 (IL-4) and interleukin-13 (IL-13) have profound anti-lymphangiogenic effects and potently impair LEC survival, proliferation, migration, and tubule formation. Inhibition of these cytokines with targeted monoclonal antibodies in the cornea suture model specifically increases inflammatory lymphangiogenesis without concomitant changes in angiogenesis. These findings suggest that manipulation of anti-lymphangiogenic pathways may represent a novel and potent means of improving lymphangiogenesis.
Overview
The claims and statistics of this paper haven’t been checked yet.
Run the check — free, no account needed. It reads the open-access text and checks the sources it cites.
Integrity signals
Registry
Cites
Statistics
Figures
Verification
Claims the paper makes
The claims and statistics of this paper haven’t been checked yet.
Run the check — free, no account needed. It reads the open-access text and checks the sources it cites.
Claims other papers make about this one
Each is checked against this paper’s own text: does it say what the citing paper says it does?
The cited source says what the claim attributes to it.
In the citing paper
“the Th2 cytokines IL-4 and IL-13 are linked to reduced LEC viability and LEC gene expression (143).”
From Transport and Immune Functions of the Lymphatic System. (2025) · cites this paper as [143]
Self-check
Percentages, sums and reported differences re-computed from the paper’s own numbers.
The self-check needs the paper’s full text.
Citations
Cites
In vitro scratch assay: a convenient and inexpensive method for analysis of cell migration in vitro
Liang, C.-C., Park, A. Y., & Guan, J.-L. (2007) · Nature Protocols · doi:10.1038/nprot.2007.30 · Cited by 4,696
Debnath, J., Muthuswamy, S. K., & Brugge, J. S. (2003) · Methods · doi:10.1016/s1046-2023(03)00032-x · Cited by 2,001
Karkkainen, M. J., Haiko, P., Sainio, K., Partanen, J. M., Taipale, J., Petrova, T. V., Jeltsch, M., Jackson, D. G., Talikka, M., Rauvala, H., et al. (2003) · Nature Immunology · doi:10.1038/ni1013 · Cited by 1,441
Lymphangiogenesis in development and human disease
Alitalo, K. K., Tammela, T., & Petrova, T. V. (2005) · Nature · doi:10.1038/nature04480 · Cited by 1,287
Cursiefen, C., Chen, L., Borges, L. P., Jackson, D. G., Cao, J., Radziejewski, C. H., D'Amore, P. A., Dana, M. R., Wiegand, S. J., & Streilein, J. W. (2004) · Journal of Clinical Investigation · doi:10.1172/jci20465 · Cited by 1,054
B Cell-Driven Lymphangiogenesis in Inflamed Lymph Nodes Enhances Dendritic Cell Mobilization
Angeli, V., Ginhoux, F., Llodrá, J., Quéméneur, L., Frenette, P. S., Skobe, M., Jessberger, R., Mérad, M., & Randolph, G. J. (2006) · Immunity · doi:10.1016/j.immuni.2006.01.003 · Cited by 436
Kataru, R. P., Jung, K., Jang, C., Yang, H., Schwendener, R. A., Baik, J. E., Han, S. H., Alitalo, K. K., & Koh, G. Y. (2009) · Blood · doi:10.1182/blood-2008-09-176776 · Cited by 403
Self-citationMolecular Biology and Pathology of Lymphangiogenesis
Kärpänen, T., & Alitalo, K. K. (2007) · Annual Review of Pathology Mechanisms of Disease · doi:10.1146/annurev.pathmechdis.3.121806.151515 · Cited by 351
Avraham, T., Zampell, J. C., Yan, A., Elhadad, S., Weitman, E. S., Rockson, S. G., Bromberg, J., & Mehrara, B. J. (2013) · The FASEB Journal · doi:10.1096/fj.12-222695 · Cited by 241
Self-citationCD4+ cells regulate fibrosis and lymphangiogenesis in response to lymphatic fluid stasis
Zampell, J. C., Yan, A., Elhadad, S., Avraham, T., Weitman, E., & Mehrara, B. J. (2012) · PLoS ONE · doi:10.1371/journal.pone.0049940 · Cited by 235
Self-citation
Cited by
Sorted by citations
Hos, D., Matthaei, M., Bock, F., Maruyama, K., Notara, M., Clahsen, T., Hou, Y., Le, V. N. H., Salabarria, A.-C., Horstmann, J., et al. (2019) · Progress in Retinal and Eye Research · doi:10.1016/j.preteyeres.2019.07.001 · Cited by 306
Inflammation and Lymphatic Function
Schwager, S., & Detmar, M. J. (2019) · Frontiers in Immunology · doi:10.3389/fimmu.2019.00308 · Cited by 268
Surgical Treatment of Lymphedema
Schaverien, M. V., & Coroneos, C. J. (2019) · Plastic & Reconstructive Surgery · doi:10.1097/prs.0000000000005993 · Cited by 208
The Lymphatic Vasculature: Its Role in Adipose Metabolism and Obesity
Escobedo, N., & Oliver, G. C. (2017) · Cell Metabolism · doi:10.1016/j.cmet.2017.07.020 · Cited by 186
Lymphedema: Pathogenesis and Novel Therapies
Dayan, J. H., Ly, C. L., Kataru, R. P., & Mehrara, B. J. (2017) · Annual Review of Medicine · doi:10.1146/annurev-med-060116-022900 · Cited by 182
Self-citationThe Unresolved Pathophysiology of Lymphedema
Azhar, S. H., Lim, H. Y., Tan, B., & Angeli, V. (2020) · Frontiers in Physiology · doi:10.3389/fphys.2020.00137 · Cited by 186
Inflammatory manifestations of lymphedema
Ly, C., Kataru, R., & Mehrara, B. (2017) · International Journal of Molecular Sciences · doi:10.3390/ijms18010171 · Cited by 164
Self-citationTumor lymphangiogenesis and new drug development
Dieterich, L. C., & Detmar, M. J. (2015) · Advanced Drug Delivery Reviews · doi:10.1016/j.addr.2015.12.011 · Cited by 145
Topical tacrolimus for the treatment of secondary lymphedema
Gardenier, J. C., Kataru, R. P., Hespe, G. E., Savetsky, I. L., Torrisi, J. S., Nores, G. D. G., Jowhar, D. K., Nitti, M. D., Schofield, R. C., Carlow, D. C., et al. (2017) · Nature Communications · doi:10.1038/ncomms14345 · Cited by 137
Self-citationCurrent Mechanistic Understandings of Lymphedema and Lipedema: Tales of Fluid, Fat, and Fibrosis
Duhon, B. H., Phan, T., Taylor, S. L., Crescenzi, R. L., & Rutkowski, J. M. (2022) · International Journal of Molecular Sciences · doi:10.3390/ijms23126621 · Cited by 136
Lymphatic Dysfunction, Leukotrienes, and Lymphedema
Jiang, X., Nicolls, M. R., Tian, W., & Rockson, S. G. (2017) · Annual Review of Physiology · doi:10.1146/annurev-physiol-022516-034008 · Cited by 133
Rockson, S. G. (2021) · Circulation Research · doi:10.1161/circresaha.121.318307 · Cited by 130
Obesity but not high-fat diet impairs lymphatic function
Nores, G. D. G., Cuzzone, D. A., Albano, N. J., Hespe, G. E., Kataru, R. P., Torrisi, J. S., Gardenier, J. C., Savetsky, I. L., Aschen, S. Z., Nitti, M. D., et al. (2016) · International Journal of Obesity · doi:10.1038/ijo.2016.96 · Cited by 117
Self-citationRegulation of Immune Function by the Lymphatic System in Lymphedema
Kataru, R. P., Baik, J. E., Park, H. J., Wiser, I., Rehal, S., Shin, J. Y., & Mehrara, B. J. (2019) · Frontiers in Immunology · doi:10.3389/fimmu.2019.00470 · Cited by 113
Self-citationCD4+ T cells are activated in regional lymph nodes and migrate to skin to initiate lymphedema
Nores, G. D. G., Ly, C. L., Cuzzone, D. A., Kataru, R. P., Hespe, G. E., Torrisi, J. S., Huang, J., Gardenier, J. C., Savetsky, I. L., Nitti, M. D., et al. (2018) · Nature Communications · doi:10.1038/s41467-018-04418-y · Cited by 98
Self-citationRegulation of IL-4 Expression in Immunity and Diseases
Ho, I., & Miaw, S. (2016) · Advances in experimental medicine and biology · doi:10.1007/978-94-024-0921-5_3 · Cited by 97
The vicious circle of stasis, inflammation, and fibrosis in lymphedema
Brown, S., Dayan, J. H., Kataru, R. P., & Mehrara, B. J. (2023) · Plastic & Reconstructive Surgery · doi:10.1097/prs.0000000000009866 · Cited by 93
Self-citationFibrosis and secondary lymphedema: chicken or egg?
Kataru, R. P., Wiser, I., Baik, J. E., Park, H. J., Rehal, S., Shin, J. Y., & Mehrara, B. J. (2019) · Translational research · doi:10.1016/j.trsl.2019.04.001 · Cited by 91
Self-citationHistopathologic Features of Lymphedema: A Molecular Review
Li, C. Y., Kataru, R. P., & Mehrara, B. J. (2020) · International Journal of Molecular Sciences · doi:10.3390/ijms21072546 · Cited by 89
Self-citationTGF‐β1 mediates pathologic changes of secondary lymphedema by promoting fibrosis and inflammation
Baik, J. E., Park, H. J., Kataru, R. P., Savetsky, I. L., Ly, C. L., Shin, J., Encarnacion, E. M., Cavali, M., Klang, M. G., Riedel, E., et al. (2022) · Clinical and Translational Medicine · doi:10.1002/ctm2.758 · Cited by 89
Self-citationExercise training improves obesity‐related lymphatic dysfunction
Hespe, G. E., Kataru, R. P., Savetsky, I. L., Nores, G. D. G., Torrisi, J. S., Nitti, M. D., Gardenier, J. C., Zhou, J., Yu, J. Z., Jones, L. W., et al. (2016) · The Journal of Physiology · doi:10.1113/jp271757 · Cited by 81
Self-citationCytokines regulating lymphangiogenesis
Sáinz‐Jaspeado, M., & Claesson, L. (2018) · Current Opinion in Immunology · doi:10.1016/j.coi.2018.04.003 · Cited by 79
Lymphatic vessels in the age of cancer immunotherapy
Karakousi, T. R., Mudianto, T., & Lund, A. W. (2024) · Nature reviews. Cancer · doi:10.1038/s41568-024-00681-y · Cited by 79
Regulation of Lymphatic Function in Obesity
Kataru, R. P., Park, H. J., Baik, J. E., Li, C., Shin, J., & Mehrara, B. J. (2020) · Frontiers in Physiology · doi:10.3389/fphys.2020.00459 · Cited by 81
Self-citationZhang, Y., Zhang, C., Li, L., Liang, X., Cheng, P., Li, Q., Chang, X., Wang, K., Huang, S., Li, Y., et al. (2021) · Cell Death and Disease · doi:10.1038/s41419-020-03385-x · Cited by 78
Tamburini, B. A. J., Finlon, J. M., Gillen, A. E., Kriss, M. S., Riemondy, K. A., Fu, R., Schuyler, R. P., Hesselberth, J. R., Rosen, H. R., & Burchill, M. A. (2019) · Frontiers in Immunology · doi:10.3389/fimmu.2019.01036 · Cited by 76
Challenging the Paradigm: Anti-Inflammatory Interleukins and Angiogenesis
Peluzzo, A. M., & Autieri, M. V. (2022) · Cells · doi:10.3390/cells11030587 · Cited by 64
Hepatic lymphatic vascular system in health and disease
Jeong, J., Tanaka, M., & Iwakiri, Y. (2022) · Journal of Hepatology · doi:10.1016/j.jhep.2022.01.025 · Cited by 66
Dubey, L. K., Karempudi, P., Luther, S. A., Ludewig, B., & Harris, N. L. (2017) · Nature Communications · doi:10.1038/s41467-017-00504-9 · Cited by 60
Docetaxel facilitates lymphatic-tumor crosstalk to promote lymphangiogenesis and cancer progression
Harris, A. R., Perez, M. J., & Munson, J. M. (2018) · BMC Cancer · doi:10.1186/s12885-018-4619-8 · Cited by 57
Mehrara, B. J., Park, H. J., Kataru, R. P., Bromberg, J., Coriddi, M. R., Baik, J. E., Shin, J., Li, C., Cavalli, M. R., Encarnacion, E. M., et al. (2021) · Biology · doi:10.3390/biology10090934 · Cited by 55
Self-citationDiphtheria toxin–mediated ablation of lymphatic endothelial cells results in progressive lymphedema
Gardenier, J. C., Hespe, G. E., Kataru, R. P., Savetsky, I. L., Torrisi, J. S., Nores, G. D. G., Dayan, J. J., Chang, D. W., Zampell, J. C., Martínez‐Corral, I., et al. (2016) · JCI Insight · doi:10.1172/jci.insight.84095 · Cited by 54
Self-citationCurrent Understanding of Pathological Mechanisms of Lymphedema
Sung, C., Wang, S., Hsu, J. F., Yu, R. P., & Wong, A. K. (2021) · Advances in Wound Care · doi:10.1089/wound.2021.0041 · Cited by 52
A Prospective Study on the Safety and Efficacy of Vascularized Lymph Node Transplant
Brown, S., Mehrara, B. J., Coriddi, M. R., McGrath, L., Cavalli, M., & Dayan, J. H. (2022) · Annals of Surgery · doi:10.1097/sla.0000000000005591 · Cited by 50
Self-citationPotential lymphangiogenesis therapies: Learning from current antiangiogenesis therapies—A review
Yamakawa, M., Doh, S. J., Santosa, S. M., Montana, M., Qin, E. C., Kong, H., Han, K., Yu, C. Q., Rosenblatt, M. I., Kazlauskas, A., et al. (2018) · Medicinal Research Reviews · doi:10.1002/med.21496 · Cited by 50
Molecular pathophysiology of secondary lymphedema
Lee, S., & Kim, I. (2024) · Frontiers in Cell and Developmental Biology · doi:10.3389/fcell.2024.1363811 · Cited by 48
Yeo, K. P., & Angeli, V. (2017) · Frontiers in Immunology · doi:10.3389/fimmu.2017.00083 · Cited by 50
T helper 2 differentiation is necessary for development of lymphedema
Ly, C. L., Nores, G. D. G., Kataru, R. P., & Mehrara, B. J. (2018) · Translational research · doi:10.1016/j.trsl.2018.12.003 · Cited by 46
Self-citationPathophysiology of lymphedema—Is there a chance for medication treatment?
Hespe, G. E., Nores, G. G., Huang, J., & Mehrara, B. J. (2016) · Journal of Surgical Oncology · doi:10.1002/jso.24414 · Cited by 45
Self-citationPharmacological Treatment of Secondary Lymphedema
Brown, S., Dayan, J. H., Coriddi, M. R., Campbell, A.-C., Kuonqui, K. G., Shin, J., Park, H. J., Mehrara, B. J., & Kataru, R. P. (2022) · Frontiers in Pharmacology · doi:10.3389/fphar.2022.828513 · Cited by 44
Self-citationTransport and Immune Functions of the Lymphatic System.
Davis, M. J., Zawieja, S. D., & King, P. D. (2025) · Annual Review of Physiology · doi:10.1146/annurev-physiol-022724-104908 · Cited by 42
The Role of Lymphatic Vascular Function in Metabolic Disorders
Norden, P. R., & Kume, T. (2020) · Frontiers in Physiology · doi:10.3389/fphys.2020.00404 · Cited by 41
Pfister, C., Dawczynski, H., & Schingale, F. J. (2020) · Nutrients · doi:10.3390/nu12051211 · Cited by 34
Schneider, C., Shen, C., Gopal, A. A., Douglas, T., Forestell, B., Kauffman, K. D., Rogers, D., Artusa, P., Zhang, Q., Jing, H., et al. (2020) · Nature Immunology · doi:10.1038/s41590-020-0795-1 · Cited by 31
Small Numbers of CD4+ T Cells Can Induce Development of Lymphedema
Ly, C. L., Cuzzone, D. A., Kataru, R. P., & Mehrara, B. J. (2018) · Plastic & Reconstructive Surgery · doi:10.1097/prs.0000000000005322 · Cited by 31
Self-citationEmerging Anti-Inflammatory Pharmacotherapy and Cell-Based Therapy for Lymphedema
Ogino, R., Yokooji, T., Hayashida, M., Suda, S., Yamakawa, S., & Hayashida, K. (2022) · International Journal of Molecular Sciences · doi:10.3390/ijms23147614 · Cited by 28
Antoniak-Pietrynczak, K., Hansdorfer-Korzon, R., Mrugacz, M., & Zorena, K. (2021) · Metabolites · doi:10.3390/metabo11090617 · Cited by 28
Crosstalk Between Adipose and Lymphatics in Health and Disease
Westcott, G. P., & Rosen, E. D. (2021) · Endocrinology · doi:10.1210/endocr/bqab224 · Cited by 27
Kimura, S., Noguchi, H., Nanbu, U., & Nakayama, T. (2021) · Oncology Letters · doi:10.3892/ol.2021.12644 · Cited by 24
Wu, T., Pu, J., Yao, Q., Chen, S., Yao, Y., Chang, S., Yang, R., & Shen, J. (2025) · Frontiers in Medicine · doi:10.3389/fmed.2025.1666522 · Cited by 21
Burger, F., Miteva, K., Baptista, D., Roth, A., Fraga-Silva, R. A., Martel, C., Stergiopulos, N., Mach, F., & Brandt, K. J. (2020) · Cardiovascular Research · doi:10.1093/cvr/cvaa069 · Cited by 21
Anuszkiewicz, K., Jankau, J. A., & Kur, M. (2022) · Breast Cancer · doi:10.1007/s12282-022-01428-z · Cited by 19
Follicular regulatory T cell in atherosclerosis
Baptista, D., Mach, F., & Brandt, K. J. (2018) · Journal of Leukocyte Biology · doi:10.1002/jlb.mr1117-469r · Cited by 19
Recent advances and new insights into muscular lymphangiogenesis in health and disease
Ji, R. (2018) · Life Sciences · doi:10.1016/j.lfs.2018.09.043 · Cited by 19
Lee, H. K., Lee, S. M., & Lee, D.-I. (2021) · International Journal of Molecular Sciences · doi:10.3390/ijms222111628 · Cited by 19
Interleukin-17A negatively regulates lymphangiogenesis in T helper 17 cell-mediated inflammation
Park, H. J., Yuk, C. M., Shin, K., & Lee, S.-H. (2017) · Mucosal Immunology · doi:10.1038/mi.2017.76 · Cited by 18
Emerging Roles for Lymphatics in Chronic Liver Disease
Burchill, M. A., Goldberg, A. R., & Tamburini, B. A. J. (2020) · Frontiers in Physiology · doi:10.3389/fphys.2019.01579 · Cited by 18
Pikuła, M., Dzierżyńska, M., Krzystyniak, A., Zieliński, M., Langa, P., Deptuła, M., Schumacher, A., Łata, J., Cichorek, M., GRUBB, A. O., et al. (2017) · Bioorganic & Medicinal Chemistry · doi:10.1016/j.bmc.2017.01.004 · Cited by 17
Role of Endogenous Regulators of Hem- And Lymphangiogenesis in Corneal Transplantation
Clahsen, T., Büttner, C., Hatami, N., Reis, A., & Cursiefen, C. (2020) · Journal of Clinical Medicine · doi:10.3390/jcm9020479 · Cited by 17
Far-Infrared Radiation Thermotherapy Improves Tissue Fibrosis in Chronic Extremity Lymphedema
Li, K., Zhang, Z., Liu, N. F., Sadigh, P. L., Evans, V., Zhou, H., Gao, W., & Zhang, Y. X. (2017) · Lymphatic Research and Biology · doi:10.1089/lrb.2016.0057 · Cited by 16
New and Emerging Treatments for Lymphedema
Aldrich, M. B., & Schaverien, M. V. (2018) · Seminars in Plastic Surgery · doi:10.1055/s-0038-1632403 · Cited by 15
Lu, J., Hsia, K., Su, C.-K., Pan, Y.-H., Ma, H., Chiou, S., & Lin, C. (2023) · Journal of Functional Biomaterials · doi:10.3390/jfb14020104 · Cited by 16
Peng, C., Jiang, F., Liu, Y., Xue, Y., Cheng, P., Wang, J., Wang, L., & Gong, W. (2024) · Infectious Diseases & Immunity · doi:10.1097/id9.0000000000000104 · Cited by 14
Bertelli, M., Kiani, A. K., Paolacci, S., Manara, E., Dautaj, A., Beccari, T., & Michelini, S. (2019) · Journal of Biotechnology · doi:10.1016/j.jbiotec.2019.11.017 · Cited by 14
Maisel, K., Hrusch, C. L., Medellin, J. E. G., Potin, L., Chapel, D. B., Nurmi, H. J., Camacho, D. F., Gleyzer, R., Alitalo, K. K., Sperling, A. I., et al. (2020) · Mucosal Immunology · doi:10.1038/s41385-020-0308-4 · Cited by 14
Stromal regulation of tumor-associated lymphatics
Munir, H., Mazzaglia, C., & Shields, J. D. (2020) · Advanced Drug Delivery Reviews · doi:10.1016/j.addr.2020.08.001 · Cited by 15
Interleukin-13 and age-related macular degeneration
Fu, B., Liu, Z.-L., Zhang, H., & Gu, F. (2017) · International Journal of Ophthalmology · doi:10.18240/ijo.2017.04.06 · Cited by 14
Para- and Transcellular Transport Kinetics of Nanoparticles across Lymphatic Endothelial Cells
McCright, J., Yarmovsky, J., & Maisel, K. (2023) · Molecular Pharmaceutics · doi:10.1021/acs.molpharmaceut.3c00720 · Cited by 13
The Function of T Cell Immunity in Lymphedema: A Comprehensive Review
Fu, A., & Liu, C. (2023) · Lymphatic Research and Biology · doi:10.1089/lrb.2023.0002 · Cited by 12
Lin, T., Zhang, X., Yang, L., & Gong, L. (2019) · DNA and Cell Biology · doi:10.1089/dna.2018.4590 · Cited by 12
Emerging roles for lymphatics in acute kidney injury: Beneficial or maleficent?
Creed, H. A., & Rutkowski, J. M. (2021) · Experimental Biology and Medicine · doi:10.1177/1535370220983235 · Cited by 12
Masood, F., Bhattaram, R., Rosenblatt, M. I., Kazlauskas, A., Chang, J., & Azar, D. T. (2022) · Frontiers in Physiology · doi:10.3389/fphys.2022.846936 · Cited by 11
Mechanics of Lymphatic Pumping and Lymphatic FunctionPreprint
Razavi, M. S., Munn, L. L., & Padera, T. P. (2024) · Cold Spring Harbor Perspectives in Medicine · doi:10.1101/cshperspect.a041171 · Cited by 11
Staging Approaches to Lymphatic Surgery: Techniques and Considerations
Salibian, A. A., Yu, N., & Patel, K. M. (2024) · Journal of Surgical Oncology · doi:10.1002/jso.27984 · Cited by 9
The Lymphatic Highway: How Lymphatics Drive Lung Health and Disease
Zhang, X., Du, X., & Cui, Y. (2024) · Lung · doi:10.1007/s00408-024-00739-6 · Cited by 8
Urso, K., Álvarez, D., Cremasco, V., Tsang, K., Grauel, A. L., Lafyatis, R., von Andrian, U. H., Ermann, J., & Aliprantis, A. O. (2016) · JCI Insight · doi:10.1172/jci.insight.88057 · Cited by 8
Bessell, E., Finlay, R. E., James, L. K., Ludewig, B., Harris, N. L., Krebs, P., Hepworth, M. R., & Dubey, L. K. (2024) · Cell Reports · doi:10.1016/j.celrep.2024.114620 · Cited by 6
Metformin Use and Risk of Breast Cancer-Related Lymphedema: A Retrospective Analysis
Rubin, J., Pollack, B. L., Coleman-Belin, J. C., Campbell, A.-C., Roberts, A., Wagner, B. D., Kataru, R. P., Boe, L. A., Barrio, A. V., & Mehrara, B. J. (2025) · Journal of the American College of Surgeons · doi:10.1097/xcs.0000000000001434 · Cited by 6
Self-citationFu, A., & Liu, C. (2023) · Gland Surgery · doi:10.21037/gs-23-48 · Cited by 5
Wang, Z., Deng, Z., Dai, F., Yuan, M., Liu, S., LI, B.-S., & Cheng, Y. (2024) · Experimental and Therapeutic Medicine · doi:10.3892/etm.2024.12453 · Cited by 5
Pathophysiology and Molecular Research in Lymphedema
Kiwanuka, E., & Mehrara, B. J. (2022) · Springer eBooks · doi:10.1007/978-3-030-93039-4_3 · Cited by 5
Self-citationThe Impact of Stem/Progenitor Cells on Lymphangiogenesis in Vascular Disease
Mou, R., Chen, K., Zhu, P., Xu, Q., & Ma, L. (2022) · Cells · doi:10.3390/cells11244056 · Cited by 5
Pollack, B. L., Torrisi, J. S., Hespe, G. E., Ashokan, G., Shin, J., Mehrara, B. J., & Kataru, R. P. (2025) · Biomedicines · doi:10.3390/biomedicines13051026 · Cited by 4
Self-citationSung, C., Wan, J., Park, S. Y., Cooper, M. N., Bouz, A., Choi, D., Jung, E., Kim, G. H., Hong, Y. K., & Wong, A. K. (2022) · The FASEB Journal · doi:10.1096/fj.202200146rr · Cited by 4
Pedrosa, B. C. D. S., de Castro, P. M. M., Santos, L. V. S. E., de Andrade, D. L., Vilaça, A. F., Júnior, J. E. G. P., Ferreira, A. P. D. L., Lins, E. M., Maia, J. N., Andrade, M. D. A., et al. (2022) · Physiotherapy Theory and Practice · doi:10.1080/09593985.2022.2143252 · Cited by 4
Cytological and Biochemical Analyses of Lymphatic Fluid from Patients with Lymphatic Malformations
Zhou, J., Guo, L., Song, D., Li, J., Liu, Z., Sun, J., & Niu, Y. (2023) · Lymphatic Research and Biology · doi:10.1089/lrb.2021.0068 · Cited by 4
Lane, J. I., Nieves-Ortiz, E., Ndatabaye, O., Fatkhullina, A. R., Lopez, S., Dermody, T. S., & Esterházy, D. (2025) · The Journal of Experimental Medicine · doi:10.1084/jem.20241181 · Cited by 3
Keratinocytes: A key player in skin immunity and their emerging roles in secondary lymphedema
Chen, X., Kuonqui, K. G., Pal, S., Shin, J., Stull-Lane, A. R., Ashokan, G., Hespe, G. E., Mehrara, B. J., & Kataru, R. P. (2026) · JID Innovations · doi:10.1016/j.xjidi.2026.100471 · Cited by 4
Self-citationZhao, Q., Niu, Z., Pan, Y., Hao, Y., Ma, Y., Zhao, J., Du, J., & Yang, Y. (2025) · Frontiers in Cell and Developmental Biology · doi:10.3389/fcell.2025.1521320 · Cited by 3
Keratinocytes coordinate inflammatory responses and regulate development of secondary lymphedemaPreprint
Park, H. J., Kataru, R. P., Shin, J., Nores, G. D. G., Encarnacion, E. M., Klang, M. G., Riedel, E., Coriddi, M. R., Dayan, J. H., & Mehrara, B. J. (2023) · bioRxiv (Cold Spring Harbor Laboratory) · doi:10.1101/2023.01.20.524936 · Cited by 3
Self-citationLymphödem, Inflammation und neue Therapieansätze
Miller, A. (2021) · Phlebologie · doi:10.1055/a-1383-7624 · Cited by 2
Interleukin 13 alleviates traumatic brain injury by promoting pericyte autophagy
Ya, D., Guo, B., Jiang, Y., Deng, J., Tian, N., Li, X., Chen, W., & Liao, R. (2025) · Free Radical Biology and Medicine · doi:10.1016/j.freeradbiomed.2025.09.050 · Cited by 2
Peluzzo, A. M., Paul, A. S., Corbett, C. B., Kelemen, S. E., Fossati, S., Liu, X., & Autieri, M. V. (2025) · Arteriosclerosis Thrombosis and Vascular Biology · doi:10.1161/atvbaha.125.322669 · Cited by 1
Critical role of keratinocytes and protease‐activated receptor 2 in secondary lymphedema development
Park, H. J., Pal, S., Chen, X., Shin, J., Nores, G. D. G., Baik, J. E., Stull-Lane, A. R., Book, A. J., Clement, C. C., Encarnacion, E. M., et al. (2026) · Clinical and Translational Medicine · doi:10.1002/ctm2.70682 · Cited by 1
Self-citationLocal lymphatic circulation disorder: A key promoter of tissue inflammation and organ fibrosis
Wu, X., & Liu, C. (2026) · Life Sciences · doi:10.1016/j.lfs.2026.124575 · Cited by 1
Nathan, A. A., Dixit, M., Babu, S., & Balakrishnan, A. S. (2017) · Tropical Medicine & International Health · doi:10.1111/tmi.12969 · Cited by 1
Investigative strategies on lymphatic vessel modulation for treating lymphedema in future medicine
Kataru, R. P., Mehrara, B. J., & Kim, H. (2018) · Precision and Future Medicine · doi:10.23838/pfm.2018.00142 · Cited by 1
Self-citationBlei, F. (2015) · Lymphatic Research and Biology · doi:10.1089/lrb.2015.29018.fb
New and Emerging Therapies for Lymphedema: Part II
Sibley, R. C., & Rockson, S. G. (2022) · Springer eBooks · doi:10.1007/978-3-030-93039-4_27
Lymphatic Mechanoregulation in Development and Disease
Hemkemeyer, S. A., Carlantoni, C., & Frye, M. (2022) · Biology of extracellular matrix · doi:10.1007/978-3-031-19616-4_11
Metadata
- Authors
- Savetsky, I. L., Ghanta, S., Gardenier, J. C., Torrisi, J. S., García Nores, G. D., Hespe, G. E., Nitti, M. D., Kataru, R. P., & Mehrara, B. J.
- Affiliations
- Memorial Sloan Kettering Cancer Center (US)
- Corresponding author
- Mehrara, Babak J.
- Venue
- PLOS ONE
- Publisher
- Public Library of Science (PLoS)
- Published
- 2015-06-03
- Volume
- 10
- Issue
- 6
- Pages
- e0126908
- ISSN
- 1932-6203 (ISSN-L)
- PMC
- PMC4454507
- OpenAlex
- W560736474
- Cited by
- 114
- References
- 23
- Citations by year
- 2026: 8 · 2025: 11 · 2024: 11 · 2023: 6 · 2022: 18 · 2021: 10 · 2020: 11 · 2019: 8 · 2018: 11 · 2017: 12 · 2016: 6 · 2015: 2
- FWCI
- 4.51
- Type
- journal article
- Language
- en
- Open access
- gold
- doi.org
- Licence
- Locations
- PLoS ONE (publishedVersion, cc-by)
- PubMed Central (publishedVersion, cc-by)
- PubMed (publishedVersion)
- DOAJ (DOAJ: Directory of Open Access Journals) (submittedVersion, cc-by-sa)
- Funders
- Memorial Sloan-Kettering Cancer Center (CA008748, P30 CA008748)
- National Heart, Lung, and Blood Institute (R01HL111130)
- National Cancer Institute (T32CA009685, P30CA008748, T32CA009501)
- Topics
- Health Sciences › Medicine › Oncology › Lymphatic System and Diseases
- Health Sciences › Medicine › Surgery › Lymphatic Disorders and Treatments
- Health Sciences › Medicine › Infectious Diseases › Parasitic Diseases Research and Treatment
- Keywords
- lymphangiogenesis, Th2 cytokines, IL-4, IL-13, lymphatic endothelial cells, lymphedema, anti-lymphangiogenic therapy, lymphatic fibrosis, extracellular matrix, monoclonal antibodies
- MeSH terms
- Animals, Cell Movement, Cell Survival, Male, Interleukin-4, Th2 Cells, Interleukin-13, Lymphangiogenesis, Endothelial Cells, Cell Proliferation, Mice
About these checks
Registry, retraction, Cites and statistics results are computed, not judged, with one exception: a printed reference that no index lists is read once by a model before it counts as a citation error. Claims are extracted by a model and kept only when their quote appears verbatim in the text; each cited source is then checked, with a model’s help, for whether it says what the claim relies on. Those verdicts can be wrong — read the claim’s quote and the cited source before relying on one.
Statistics and arithmetic are recomputed, not judged.
Confidence bands are shown only for fields calibrated on our annotated test set. None is calibrated yet, so no band is shown.
What counts as a claim ›How we measure confidence ›How we check this ›
Are you an author, or do you see a problem with this page? Request a review
