

The DOI matches its Crossref record; 45 of the 45 references it cites were found in a registry or an index; none of the 11 sources its claims cite is checked for support yet.
Overexpression of RhoH Permits to Bypass the Pre-TCR Checkpoint
Open accessAbstract
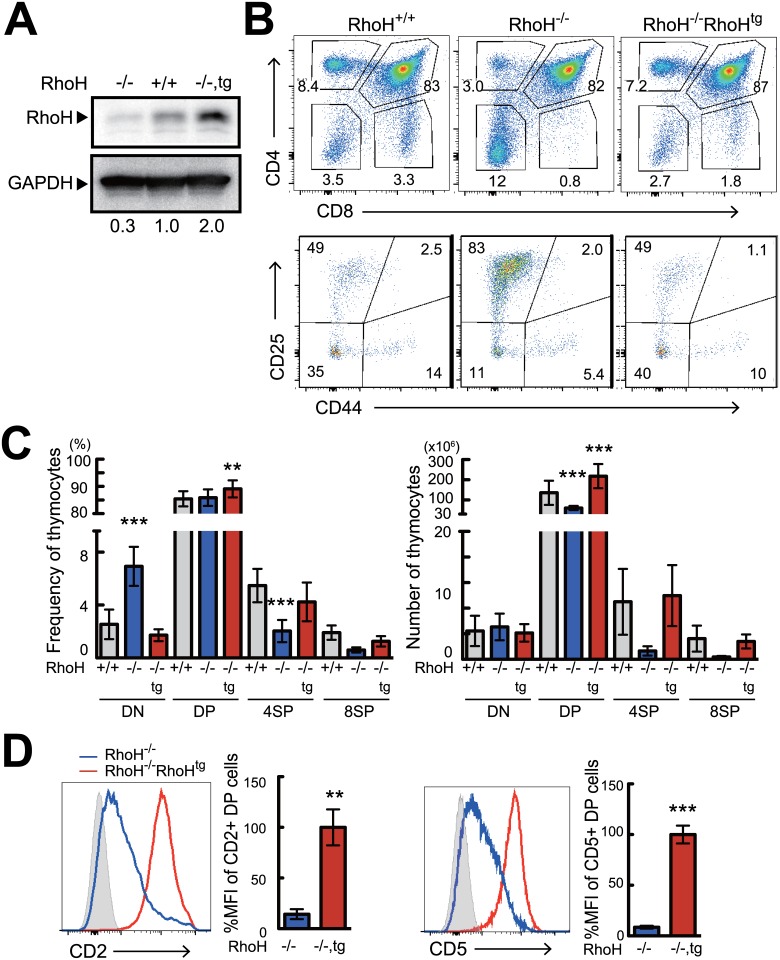
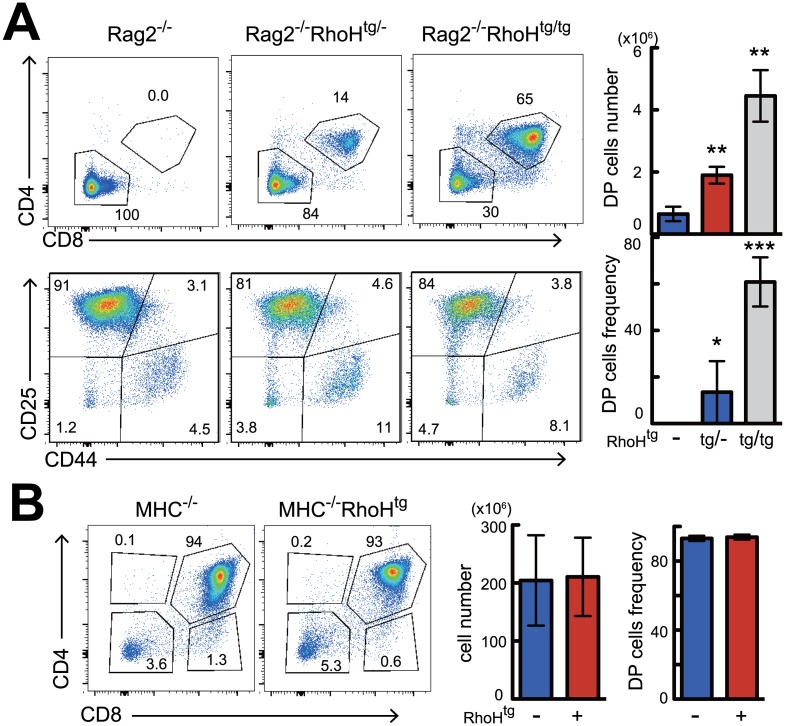
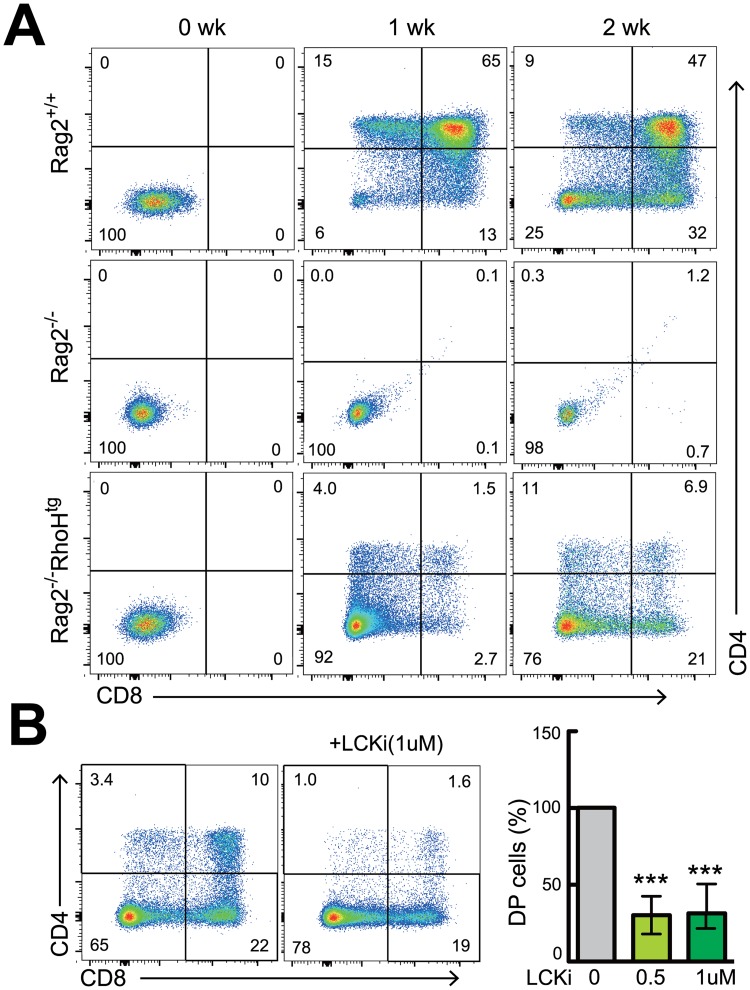
RhoH, an atypical small Rho-family GTPase, critically regulates thymocyte differentiation through the coordinated interaction with Lck and Zap70. Therefore, RhoH deficiency causes defective T cell development, leading to a paucity of mature T cells. Since there has been no gain-of-function study on RhoH before, we decided to take a transgenic approach to assess how the overexpression of RhoH affects the development of T cells. Although RhoH transgenic (RhoHtg) mice expressed three times more RhoH protein than wild-type mice, β-selection, positive, and negative selection in the thymus from RhoHtg mice were unaltered. However, transgenic introduction of RhoH into Rag2 deficient mice resulted in the generation of CD4+ CD8+ (DP) thymocytes, indicating that overexpression of RhoH could bypass β-selection without TCRβ gene rearrangement. This was confirmed by the in vitro development of DP cells from Rag2-/-RhoHtg DN3 cells on TSt-4/Dll-1 stroma in an Lck dependent manner. Collectively, our results indicate that an excess amount of RhoH is able to initiate pre-TCR signaling in the absence of pre-TCR complexes.
Overview
CoChat Summary
Written by AI from the paper’s full text.
TL;DR
Overexpression of RhoH in transgenic mice largely leaves normal thymocyte development intact, but in Rag2-deficient mice it generates CD4+CD8+ (DP) thymocytes without TCRβ rearrangement, bypassing the pre-TCR checkpoint. This bypass is thymocyte-intrinsic and Lck-dependent, suggesting excess RhoH can initiate pre-TCR signaling in the absence of pre-TCR complexes.
Key findings
- HA-tagged RhoH was functionally equivalent to endogenous RhoH: it restored thymic cellularity and CD4SP/CD8SP differentiation in RhoH-/- mice, restored CD2 and CD5 expression on DP thymocytes, and restored TCR-induced ERK phosphorylation.
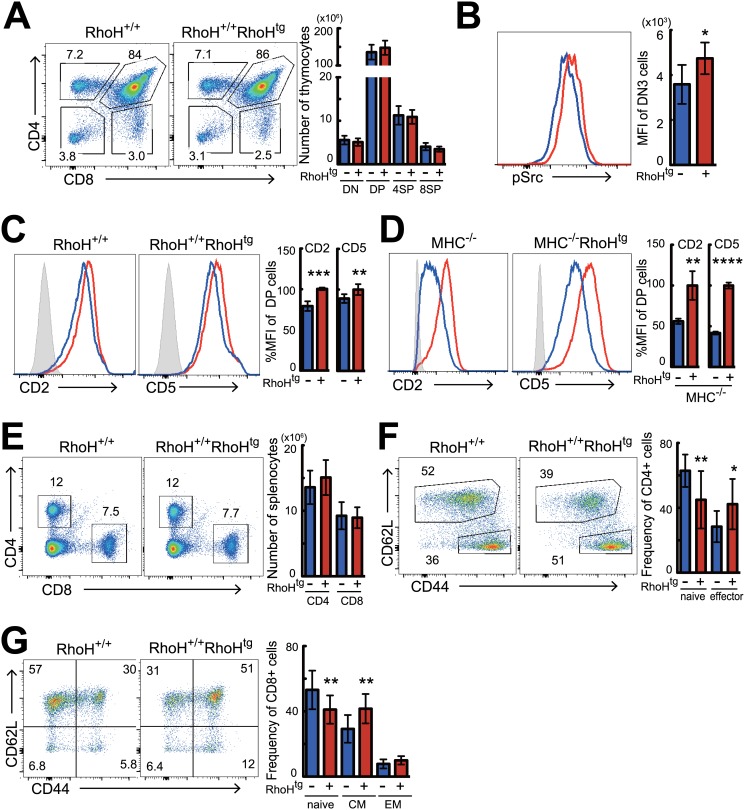
- In wild-type background, RhoH overexpression had little effect on thymocyte subsets, but caused a slight increase in phospho-Src in DN3 cells, increased CD2 and CD5 on DP cells, reduced naive CD4 and CD8 T cells, and increased activated/memory T cells in the periphery.
- Crossing RhoHtg mice with Rag2-/- mice produced DP thymocytes without TCRβ protein, in a dose-dependent manner (homozygous tg/tg generated more DP than heterozygous tg/-), but did not bypass positive selection, as no mature CD4SP or CD8SP cells appeared.
- Sorted Rag2-/-RhoHtg DN3 cells differentiated into DP cells in vitro on TSt-4/Dll-1 stroma with IL-7, and this was strongly inhibited by an Lck inhibitor, indicating Lck dependence.
Methods
- Generated hCD2 promoter-driven HA-tagged RhoH transgenic mice, backcrossed to C57BL/6J, and bred them to RhoH-/-, Rag2-/-, MHC-/-, and Nur77-GFP backgrounds.
- Analyzed thymocytes and splenocytes from 4–8 week old mice by flow cytometry, including cell sorting of DN3 cells, intracellular phospho-Src staining, and western blot for RhoH.
- Cultured 5×10^5 cells with TSt-4/Dll-1 stromal cells for 14 days in RPMI plus IL-7 (0.5 ng/ml), with or without Lck inhibitor III; statistics used unpaired Student’s t-test or two-way ANOVA with Tukey post-test.
Limitations
- The paper states that further analyses using RhoH conditional knockout mice are needed to define RhoH effector function in peripheral T cells, because the paucity of normal mature T cells in RhoH-/- mice made it difficult to determine RhoH’s requirement in primary peripheral T cells.
- The paper notes that it could not observe any apparent increase in anti-TCR mAb-stimulated “strong” signal transduction in RhoHtg mature T cells and DP thymocytes, and suggests effects might differ under weaker TCR stimulation or at different developmental stages.
- Evident from the text: the in vitro differentiation result in Fig 4A is shown from one out of three independent experiments, and the Lck-dependence conclusion relies on a pharmacological inhibitor rather than genetic Lck deletion.
Model-written summary. Check it against the paper before relying on it.
Integrity signals
Registry
Cites
Statistics
Figures
Verification
Claims the paper makes
23 Own result · 10 Own interpretation · 3 Check pending · 2 No full text of the sources · 2 Not checked yet
A result the paper reports from its own data — it cites no other source for it, so there is none to check. The quote shows it is in the paper.
In the paper
“We finally observed RhoH transgene made small increase of the phosphorylation of Src family protein which act as the key kinases on T cell development in thymus (Fig 2B)”
- Also stated in: § Discussion · plain
“In fact, we have found that Src family protein including Lck were activated under steady state in DN3 cells from RhoHtg mice”
§ Overexpression of RhoH Permits to Bypass the Pre-TCR Checkpoint > Results > Effects of over-expression of RhoH on T cells in the thymus and peripheral tissues
plainstates a cause- Asserted: passes — The authors put it forward as true.
- Checkable: passes — It can be checked against evidence.
- Load-bearing: unclear — It is unclear whether the paper’s conclusions depend on it.
- Based: passes — The paper gives a reason why it holds.
- Also stated in: § Discussion · plain
A result the paper reports from its own data — it cites no other source for it, so there is none to check. The quote shows it is in the paper.
In the paper
“In the periphery, the percentage and numbers of splenic CD4+ and CD8+ T cells from RhoHtg mice were similar to that of wild-type mice (Fig 2E and S2B Fig).”
§ Overexpression of RhoH Permits to Bypass the Pre-TCR Checkpoint > Results > Effects of over-expression of RhoH on T cells in the thymus and peripheral tissues
plain- Asserted: passes — The authors put it forward as true.
- Checkable: passes — It can be checked against evidence.
- Load-bearing: unclear — It is unclear whether the paper’s conclusions depend on it.
- Based: passes — The paper gives a reason why it holds.
A result the paper reports from its own data — it cites no other source for it, so there is none to check. The quote shows it is in the paper.
In the paper
“Although RhoH transgenic (RhoHtg) mice expressed three times more RhoH protein than wild-type mice, β-selection, positive, and negative selection in the thymus from RhoHtg mice were unaltered.”
§ Overexpression of RhoH Permits to Bypass the Pre-TCR Checkpoint > Abstract
plain- Asserted: passes — The authors put it forward as true.
- Checkable: passes — It can be checked against evidence.
- Load-bearing: passes — The paper’s conclusions depend on it.
- Based: passes — The paper gives a reason why it holds.
In the paper
“GFP expression on DP to CD4SP cells from RhoHtg Nur77-GFP mice, which were able to monitor the strength of TCR signaling in vivo during T cell developments [23], was also the same as the wild-type controls (S3A Fig).”
§ Overexpression of RhoH Permits to Bypass the Pre-TCR Checkpoint > Results > Effects of over-expression of RhoH on T cells in the thymus and peripheral tissues
What the sources say
- Check pendingcites [23] GL Stritesky, 2013, Murine thymic selection quantified using a unique method to capture deleted T cells, Proceedings of the National Academy of Sciences of the United States of America source
plain- Asserted: passes — The authors put it forward as true.
- Checkable: passes — It can be checked against evidence.
- Load-bearing: passes — The paper’s conclusions depend on it.
- Based: passes — The paper gives a reason why it holds.
A result the paper reports from its own data — it cites no other source for it, so there is none to check. The quote shows it is in the paper.
In the paper
“In addition to the unaltered Nur77-GFP expression during thymic T cell differentiation (S3A Fig), anti-TCR antibody-induced activation of ERK in DP and CD4SP cells from RhoHtg mice was also not increased (S3B Fig)”
§ Overexpression of RhoH Permits to Bypass the Pre-TCR Checkpoint > Discussion
plain- Asserted: passes — The authors put it forward as true.
- Checkable: passes — It can be checked against evidence.
- Load-bearing: passes — The paper’s conclusions depend on it.
- Based: passes — The paper gives a reason why it holds.
- It may state two separate claims as one. 7
- Probably not a substantial claim. 5
Create a free account to see these claims.
Create a free account to see these assumptions.
25 more claims
Create a free account to see all 40 claims and to verify the 7 references still open.
Claims other papers make about this one
Each is checked against this paper’s own text: does it say what the citing paper says it does?
In the citing paper
“RhoH myristoylation at the N-terminal may also assist RhoH attachment to the plasma membrane and promote its interacting partners, Lck, ZAP−70 and Syk recruitment to the membrane to facilitate T cell receptor (TCR) signalling [23,24,25].”
From The Role of RhoH in TCR Signalling and Its Involvement in Diseases (2021) · cites this paper as [24]
In the citing paper
“As a result, activated ZAP−70 will promote linker of activated T cells (LAT) and SLP76 signalling in T cell, crucial for T cell activation and development [23,24,25,36].”
From The Role of RhoH in TCR Signalling and Its Involvement in Diseases (2021) · cites this paper as [24]
Citations
Cites
CD5 expression is developmentally regulated by T cell receptor (TCR) signals and TCR avidity
Azzam, H. S., Grinberg, A., Lui, K., Shen, H., Shores, E. W., & Love, P. E. (1998) · The Journal of Experimental Medicine · doi:10.1084/jem.188.12.2301 · Cited by 587
Sportès, C., Hakim, F. T., Memon, S. A., Zhang, H., Chua, K., Brown, M. R., Fleisher, T. A., Krumlauf, M., Babb, R. R., Chow, C. K., et al. (2008) · The Journal of Experimental Medicine · doi:10.1084/jem.20071681 · Cited by 488
Insights into the initiation of TCR signaling
Chakraborty, A. K., & Weiss, A. (2014) · Nature Immunology · doi:10.1038/ni.2940 · Cited by 376
Adult T-cell progenitors retain myeloid potential
Wada, H., Masuda, K., Satoh, R., Kakugawa, K., Ikawa, T., Katsura, Y., & Kawamoto, H. (2008) · Nature · doi:10.1038/nature06839 · Cited by 368
V(D)J recombination activates a p53-dependent DNA damage checkpoint in scid lymphocyte precursors.Preprint
Guidos, C. J., Williams, C. J., Grandal, I., Knowles, G. C., Huang, M. T. F., & Danska, J. S. (1996) · Genes & Development · doi:10.1101/gad.10.16.2038 · Cited by 276
Zhumabekov, T., Corbella, P., Tolaini, M., & Kioussis, D. (1995) · Journal of Immunological Methods · doi:10.1016/0022-1759(95)00124-s · Cited by 268
Shinkai, Y., & Alt, F. W. (1994) · International Immunology · doi:10.1093/intimm/6.7.995 · Cited by 192
Murine thymic selection quantified using a unique method to capture deleted T cells
Stritesky, G. L., Xing, Y., Erickson, J. R., Kalekar, L. A., Wang, X., Mueller, D. L., Jameson, S. C., & Hogquist, K. A. (2013) · Proceedings of the National Academy of Sciences · doi:10.1073/pnas.1217532110 · Cited by 172
Mutations in the p53 and SCID genes cooperate in tumorigenesis.Preprint
Nacht, M., Strasser, A., Chan, Y. R., Harris, A. W., Schlissel, M. S., Bronson, R. T., & Jacks, T. (1996) · Genes & Development · doi:10.1101/gad.10.16.2055 · Cited by 172
Human RHOH deficiency causes T cell defects and susceptibility to EV-HPV infections
Crequer, A., Troeger, A., Patin, E., Ma, C. S., Picard, C., Pedergnana, V., Fieschi, C., Lim, A., Abhyankar, A., Gineau, L., et al. (2012) · Journal of Clinical Investigation · doi:10.1172/jci62949 · Cited by 159
Cited by
Regulating Rho GTPases and their regulators
Hodge, R. G., & Ridley, A. J. (2016) · Nature Reviews Molecular Cell Biology · doi:10.1038/nrm.2016.67 · Cited by 872
T cell receptor signaling for γδT cell development
Muro, R., Takayanagi, H., & Nitta, T. (2019) · Inflammation and Regeneration · doi:10.1186/s41232-019-0095-z · Cited by 86
T‐cell activation RhoGTPase‐activating protein plays an important role in TH17‐cell differentiation
Tamehiro, N., Nishida, K., Yanobu‐Takanashi, R., Goto, M., Okamura, T., & Suzuki, H. (2017) · Immunology and Cell Biology · doi:10.1038/icb.2017.27 · Cited by 31
Self-citationThe Role of RhoH in TCR Signalling and Its Involvement in Diseases
Ahmad Mokhtar, A. M., Hashim, I. F., Mohd Zaini Makhtar, M., Salikin, N. H., & Amin-Nordin, S. (2021) · Cells · doi:10.3390/cells10040950 · Cited by 25
Tamehiro, N., Nishida, K., Sugita, Y., Hayakawa, K., Oda, H., Nitta, T., Nakano, M., Nishioka, A., Yanobu-Takanashi, R., Goto, M., et al. (2019) · Journal of Allergy and Clinical Immunology · doi:10.1016/j.jaci.2018.09.032 · Cited by 25
Self-citation
Metadata
- Authors
- Tamehiro, N., Oda, H., Shirai, M., & Suzuki, H.
- Affiliations
- National Center for Global Health and Medicine (JP)
- Yamaguchi University (JP)
- Corresponding author
- Suzuki, Harumi
- ORCID
- Suzuki, Harumi
- Venue
- PLOS ONE
- Publisher
- Public Library of Science (PLoS)
- Published
- 2015-06-26
- Volume
- 10
- Issue
- 6
- Pages
- e0131047
- ISSN
- 1932-6203 (ISSN-L)
- PMC
- PMC4482576
- OpenAlex
- W2145592512
- Cited by
- 14
- References
- 45
- Citations by year
- 2025: 1 · 2024: 2 · 2023: 2 · 2022: 2 · 2021: 1 · 2019: 1 · 2018: 1 · 2017: 3 · 2016: 1
- FWCI
- 0.68
- Type
- journal article
- Language
- en
- Open access
- gold
- doi.org
- Licence
- Locations
- PLoS ONE (publishedVersion, cc-by)
- PubMed (publishedVersion)
- PubMed Central (publishedVersion, cc-by)
- DOAJ (DOAJ: Directory of Open Access Journals) (submittedVersion, cc-by-sa)
- Figshare (submittedVersion, cc-by)
- Funders
- National Center for Global Health and Medicine (25-103)
- Japan Society for the Promotion of Science (25460606, 15K09568, 25871164)
- Topics
- Life Sciences › Immunology and Microbiology › Immunology › T-cell and B-cell Immunology
- Life Sciences › Biochemistry, Genetics and Molecular Biology › Molecular Biology › Developmental Biology and Gene Regulation
- Life Sciences › Biochemistry, Genetics and Molecular Biology › Molecular Biology › Protein Kinase Regulation and GTPase Signaling
- Keywords
- RhoH, pre-TCR signaling, T cell development, thymocyte differentiation, beta-selection, double-negative thymocytes, Lck, ZAP-70, transgenic mice
- MeSH terms
- Animals, Cell Differentiation, Cells, Cultured, Female, Mice, Inbred C57BL, Mice, Inbred ICR, Mice, Transgenic, T-Lymphocytes, Thymus Gland, Transcription Factors, Up-Regulation, Receptors, Antigen, T-Cell, alpha-beta, Gene Expression Regulation, Developmental, Genes, T-Cell Receptor, rho GTP-Binding Proteins, Mice, Cell Cycle Checkpoints
About these checks
Registry, retraction, Cites and statistics results are computed, not judged, with one exception: a printed reference that no index lists is read once by a model before it counts as a citation error. Claims are extracted by a model and kept only when their quote appears verbatim in the text; each cited source is then checked, with a model’s help, for whether it says what the claim relies on. Those verdicts can be wrong — read the claim’s quote and the cited source before relying on one.
A language model drew the claims from the paper on 2026-11-12, under version 3 of the claim definition (model deepseek-v4.1-flash, prompt extract-v3).
A second model labelled each claim on 2026-11-12 (model jev-1.13-20260917, definition revision gold-guideline-v0.2).
Statistics and arithmetic are recomputed, not judged.
Confidence bands are shown only for fields calibrated on our annotated test set. None is calibrated yet, so no band is shown.
What counts as a claim ›How we measure confidence ›How we check this ›
Are you an author, or do you see a problem with this page? Request a review
How to cite
Cite CoChat for the checks on this page, and the paper for its own findings.
- This page
- CoChat. (2026). Citation check: Overexpression of RhoH Permits to Bypass the Pre-TCR Checkpoint. https://app.cochat.ai/papers/10.1371/journal.pone.0131047
- The paper
- Tamehiro, N., Oda, H., Shirai, M., & Suzuki, H. (2015). Overexpression of RhoH Permits to Bypass the Pre-TCR Checkpoint. PLOS ONE. https://doi.org/10.1371/journal.pone.0131047
